


INTRODUCTION
Malaria is one of the most infectious diseases, exhibiting a very high death toll among humans (Murray et al. Reference Murray, Rosenfeld, Lim, Andrews, Foreman, Haring, Fullman, Naghavi, Lozano and Lopez2012). Although a number of species is known to infect mammals, the great majority of haemosporidian parasites appear in bird hosts (Martinsen et al. Reference Martinsen, Perkins and Schall2008). More than 200 blood parasites have been described in bird hosts and novel aspects of their evolution and impact on host life histories are regularly coming to light (Valkiūnas, Reference Valkiūnas2005). Concerning this matter, second-generation sequencing platforms may allow a more detailed look at the co-evolution between host and parasite. However, haemosporidians are obligatory intracellular parasites, underlining the inevitability of analysing host sequences alongside parasite sequences. In this regard, several hurdles currently make analyses inefficient or outright impossible. Usually only a small fraction of all host blood cells are infected by parasites. In addition, since erythrocytes of birds are enucleated, parasite nuclei are not the most common ones present in infected blood. Moreover, bird hosts prospectively comprise 50 to 100 times larger genomes than their haemosporidian parasites, leading to severe under-representation of parasite sequences.
Considering these problems, there is a great need for separation of parasites from the infected host blood before applying further analyses of the parasite genome. Consequently, such separation strategies should not affect genomic analyses, as in the case of DNA-intercalating dyes. In particular, uitilization of such dyes consequently leads to a blockade of the fluorescence channels required for further fluorescence-based analyses and fluorescent bead-based sequencing approaches. In the present study, we address this matter using Leucocytozoon buteonis (L. buteonis), a blood parasite infecting common buzzards, Buteo buteo and other members of the genus. L. buteonis belongs to a complex of cryptic species infecting most birds of prey, formerly clustered under the name of L. toddi (Valkiūnas et al. Reference Valkiūnas, Sehgal, Iezhova and Hull2010). Here, we report for the first time the successful monitoring and sorting of leucocytozoids using flow cytometry without additional labelling. The presence of leucocytozoids in the blood samples was initially demonstrated by Giemsa-staining, while the successful enrichment of leucocytozoids was shown by Giemsa staining of the sorted population and an additional quantitative real-time PCR using specific primers for parasite and host.
MATERIALS AND METHODS
Source material and blood sample preparation
Blood samples were taken under permission from the local authorities at Gütersloh (Untere Landschaftsbehörde, Kreis Gütersloh) within a ringing programme of common buzzard nestlings (Chakarov et al. Reference Chakarov, Boerner and Krüger2008). After initial sampling, solely L. buteonis-infection was confirmed microscopically and verified via sequencing of cytochrome b fragments amplified with primers common for all 3 genera of the Haematozoa, namely Plasmodium, Haemoproteus and Leucocytozoon (for primer sequences see Table 1). Sequencing was performed at the CeBiTec Center for Biotechnology (University of Bielefeld, Germany) using the Sanger sequencing method with Taq-polymerase (cat. no. 2200000, 5 Prime, Hamburg, Germany). Animals with high parasitaemia were identified and handled following the procedure described by Omori and coworkers (Reference Omori, Sato, Toda, Sasaki, Isobe, Nakanishi, Murata and Yukawa2010). Up to 100 μl of blood were taken into a heparinized capillary (Brand, Wertheim, Germany) and mixed with 500 μl of distilled water. After 2 min, lysis was terminated by adding 500 μl of 1·8% (w/w) saline. Lysed blood was kept at 4 °C.
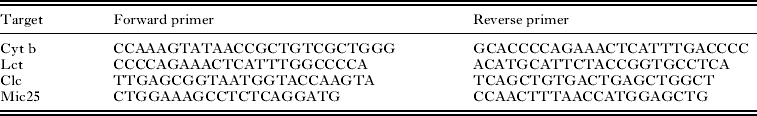
Table 1. Primer sequences
Giemsa staining
Blood smears for optical estimation of infection intensity were prepared, air-dried and fixed in absolute ethanol. Staining was performed using Giemsa stain (dilution 1:5, Sigma-Aldrich, Taufkirchen, Germany). Infection intensity was estimated after microscopic examination of at least 5000 erythrocytes at 400× magnification.
Labelling of blood samples and respective flow cytometric analyses
One hour after harvesting, prepared blood samples were centrifuged (1500 g, 5 min) followed by re-suspension of the pellet in 500 μl of Alsever's solution (Sigma-Aldrich). Prepared blood samples were labelled with SYTOX green (1:20 000, Molecular Probes, Göttingen, Germany) for 10 min. After centrifugation (1500 g, 5 min), subsamples were re-suspended in 1 ml of Alsever's solution (Sigma-Aldrich) and diluted 10x in Alsever's solution (Sigma-Aldrich). For flow cytometric analyses, labelled samples were filtered using a Cell Trics 30 μm filter (Partec, Münster, Germany). Acquisition was performed with a CyFlow space flow cytometer (Partec, Münster, Germany). The analysis was processed with the FloJo software (Tree Star, OR, USA). Parasite area was defined in a 2-dimensional scattergram of FL-1 and forward scatter (FSC). As control, uninfected blood samples were used.
Flow cytometric measurement of unlabelled blood samples
Prepared blood samples were handled as described above without SYTOX green-labelling. Acquisition was performed with the CyFlow space flow cytometer (Partec). The analysis was performed using the FloJo software (Tree Star, OR, USA). Parasite area was defined in a 2-dimensional scattergram of FSC and side scatter (SSC) by combining scattergrams from infected and uninfected blood samples.
Sorting
Sorting of labelled and unlabelled L. buteonis-infected subpopulations was performed using CyFlow Space equipped with a piezo crystal-based Cell Sorter module (PPCS, Partec). Sorted populations were collected in fetal calf serum-coated (Sigma-Aldrich, lot: 126K3398) 50 ml Falcon tubes (TPP AG, Trasadingen, Switzerland). Giemsa staining was performed after cytospinning for 5 min at 113 g (Shandon Cytospin 4, Thermo Fisher Scientific, Waltham, MA, USA) in order to microscopically examine enriched populations.
Nucleic acid isolation
DNA was isolated through a standard phenol-chloroform method according to Sambrook and Russell (Reference Sambrook and Russell2001). DNA concentrations were measured with NanoValue Plus (GE Healthcare, Little Chalfont, UK).
Real-time PCR
All qPCR reactions were performed in triplicate using Platinum SYBR Green qPCR SuperMix-UDG (Invitrogen, Life Technologies GmbH, Darmstadt, Germany) according to the manufacturer's guidelines. The pipetting robot CAS-1200 (QIAGEN, Hilden, Germany) was applied for sample preparation, subsequent analysis was performed using Rotor Gene 6000 (QIAGEN, Hilden, Germany). We used 3 primer sets designed to amplify (1) 183 bp of the mitochondrial cytochrome b gene of L. buteonis (designated Lct), (2) 180 bp of the avian nuclear Clock-gene (further referred to as Clc) and (3) 300 bp fragment including a microsatellite in the buzzard nuclear genome (further referred to as Mic25) (Johnson et al. Reference Johnson, Fowlie and Amos2005; Johnsen et al. Reference Johnsen, Fidler, Kuhn, Carter, Hoffmann, Barr, Biard, Charmantier, Eens, Korsten, Siitari, Tomiuk and Kempenaers2007).
RESULTS
After collection of blood samples from more than 100 common buzzards, initial investigations focused on potential acute L. buteonis-infections. As representatively shown in Fig. 1A, several of the blood samples offered about 4·0 ± 1·2% strongly deformed spindle-shaped blood cells, which were infected with L. buteonis. Giemsa-stained L. buteonis appeared intensely violet (macrogametocytes) and brightly violet (microgametocytes, Fig. 1B arrow) among the non-deformed uninfected erythrocytes (Fig. 1B arrowheads).

Fig. 1. Giemsa staining of an acute Leucocytozoon buteonis-infected blood sample collected from representative infected Buteo buteo. (A) 4·0 ± 1·2% of present blood cells showed a violet colour after exposure to Giemsa staining. Scale bar = 100 μm. (B) Characteristic morphology for L. buteonis-infection was observable in Giemsa-positive blood cells (arrow), while Giemsa-negative cells offered normal blood cell-like morphology (arrowheads). Scale bar = 20 μm.
In order to enrich L. buteonis-infected blood cells and isolate L. buteonis, blood samples were analysed using flow cytometry followed by respective sorting. In the first place, flow cytometric measurements were performed after SYTOX green staining of L. buteonis-infected and -uninfected blood samples (according to respective Giemsa-stainings). Here, infected samples revealed the presence of L. buteonis, as shown by a characteristic pattern according to Omori and coworkers (Reference Omori, Sato, Toda, Sasaki, Isobe, Nakanishi, Murata and Yukawa2010) (data not shown).
Furthermore, we investigated the possibility of distinguishing between infected and non-infected blood samples without an additional labelling step. As shown in Fig. 2A, plotting of the measured side scatter (SSC) against the forward scatter (FSC) showed a subpopulation of 4·51% of events in the L. buteonis-infected sample. Importantly, in the uninfected blood sample, the same measured area showed a subpopulation of only 0·256% of events (Fig. 2B).

Fig. 2. Flow cytometric analyses revealed characteristic subpopulation in Leucocytozoon buteonis-infected blood samples from Buteo buteo without additional labelling. (A) Subpopulation of 4·51% of events is observable in the L. buteonis-infected blood sample. (B) The uninfected blood sample revealed only 0·256% of events in the same measured area. SSC, Side scatter; FSC, forward scatter.
To further investigate the observed subpopulations of labelled and unlabelled L. buteonis-infected blood samples, enrichment of those cells belonging to the subpopulations was performed using CyFlow Space equipped with a piezo crystal-based Cell Sorter module (Partec). After enrichment, the presence of L. buteonis was revealed by Giemsa-staining in the sorted fraction of the labelled sample (data not shown). Importantly, L. buteonis parasites were also found in the enriched unlabelled blood sample, as shown by violet Giemsa-staining (Fig. 3, arrowheads). Moreover, the parasite-specific cytochrome b fragment showed elevated levels in the sorted population as demonstrated by quantitative real-time PCR in both the unlabelled and the labelled blood sample, while host-specific genes showed a decreased signal (Fig. 4).
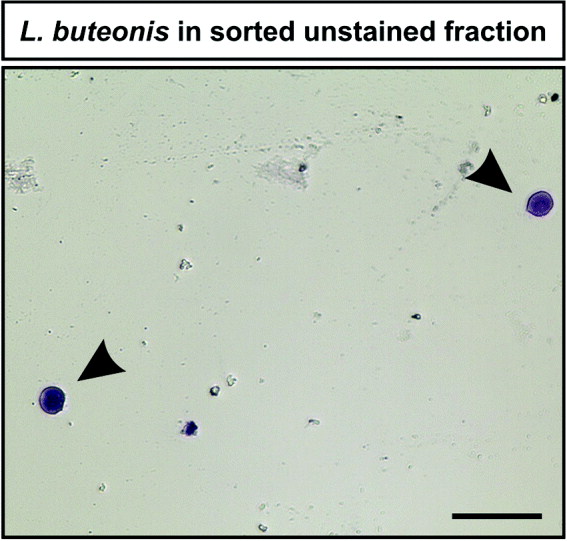
Fig. 3. Label-free enrichment of characteristic subpopulations revealed the presence of Leucocytozoon buteonis. Violet-stained L. buteonis parasites were observed in the enriched subpopulation from an unlabelled Buteo buteo blood sample after Giemsa staining (arrowheads). Scale bar = 50 μm.

Fig. 4. Unlabelled enriched subpopulation revealed characteristic Leucocytozoon buteonis signal comparable to labelling approach. Quantitative real-time PCR analyses exhibited an elevated level of Lct (1000 times) in the enriched subpopulations of the labelled and the unlabelled blood sample, while host-specific genes showed decreased signal levels (50–100 times).
DISCUSSION
This study describes for the first time the successful flow cytometric enrichment of L. buteonis from infected Buteo buteo blood without the need of additional labelling. A 2-dimensional scattergram consisting of SSC and FSC revealed a specific, defined area, whose sorting was followed by further analyses of the parasite-enriched fraction. Giemsa staining served for affirming both an initial infection of the blood sample by L. buteonis and successful sorting of the parasite. Moreover, quantitative real-time PCR revealed decreased levels of host-specific genes in the sorted fraction, while a parasite-specific gene displayed elevated levels.
Although a very low level of host-specific gene expression was still detectable in the enriched fraction, particularly the highly increased levels of the mitochondrial cytochrome b gene of L. buteonis give evidence for successful enrichment of the parasite. Remarkably, Omori and coworkers (Reference Omori, Sato, Toda, Sasaki, Isobe, Nakanishi, Murata and Yukawa2010) recently demonstrated successful sorting of Leucocytozoon gametocytes from chicken blood via flow cytometry. In accordance with our findings, the authors also showed no completely absent host-specific gene expression in the enriched fraction, but a highly elevated level of the protozoa-specific clpC gene (Omori et al. Reference Omori, Sato, Toda, Sasaki, Isobe, Nakanishi, Murata and Yukawa2010).
Therefore, our findings demonstrate the parasite-specificity of the defined area detected in the 2-dimensional scattergram. Noteworthy, the FSC is known to correlate with the cell volume and the SSC with cytoplasmic granularity. Thus, the morphology of potential cells located within the subpopulation seems to correlate with those of L. buteonis-infected cells, underlining the validity of the here applied enrichment method. Importantly, we demonstrated the suitability of our proof-of-principle method for enrichment of avian haemosporidia by successfully applying an additional labelling-based enrichment using SYTOX green, resulting in comparable enrichment of the parasite and depletion of the host genome.
In the last decades, several strategies and methods have been used to enrich and isolate parasite cells for further analyses. For instance, Henry and Dick (Reference Henry and Dick1978) showed that cells infected by Leucocytozoon parasites can be separated from avian blood cells via Ficoll density-gradient centrifugation. However, no indication was provided concerning the separation efficiency. Recently, Palinauskas and coworkers (2010) successfully used laser-capture microdissection for separation of single haemosporidian cells. Likewise, similar results were achieved by applying manual separation and multiple washings of separated cells. Although resulting in successful PCR analyses, the yield of DNA was relatively low and probably not sufficient for sequencing approaches. Moreover, currently available whole-genome amplification kits are not optimized to alleviate the problem of analysing only the parasite genome. Underlining the advantages of the here applied enrichment method, flow cytometric approaches provide great opportunities, as enrichment of parasite cells are possible in a short time and at singe-cell level. Considering these potential advantages, several studies reported the possibility to detect malarian parasites via flow cytometric measurements in the mammalian system (Saito-Ito et al. Reference Saito-Ito, Akai, He, Kimura and Kawabata2001; Xie et al. Reference Xie, Li, Johnson, Zhang, Milhous and Kyle2007). As already discussed above, Omori and coworkers (Reference Omori, Sato, Toda, Sasaki, Isobe, Nakanishi, Murata and Yukawa2010) also recently reported identification of Leucocytozoon gametocytes in avian blood followed by respective sorting. However, to our knowledge, current flow cytometric approaches for detection of malarian pathogens always require DNA-intercalating dyes, such as YOYO-1 (Xie et al. Reference Xie, Li, Johnson, Zhang, Milhous and Kyle2007), SYTO-24 (Omori et al. Reference Omori, Sato, Toda, Sasaki, Isobe, Nakanishi, Murata and Yukawa2010), Hoechst 33258 (Brown et al. Reference Brown, Battye and Howard1980) or acridine orange (Saito-Ito et al. Reference Saito-Ito, Akai, He, Kimura and Kawabata2001). As mentioned above, utilization of such dyes consequently leads to a blockade of the fluorescence channels required for further fluorescence-based analyses. Thus, although bead-based flow cytometric sorting for further DNA-sequencing has been reported in other contexts (Spiro et al. Reference Spiro, Lowe and Brown2000; Sandberg et al. Reference Sandberg, Stahl, Ahmadian, Bjursell and Lundeberg2009), the unavoidable use of DNA-intercalating dyes for detection of pathogens before sequencing prohibits such applications. Moreover, several other molecular analyses are also not adaptable after DNA-labelling, such as immunocytochemical staining or GFP-transfection. Therefore, detection and enrichment of malarian parasites without the need of additional staining steps is of great interest for basic and applied science.
Taken together, our study demonstrates the successful flow cytometric enrichment of L. buteonis from infected buzzard blood without the need of additional labelling with DNA-intercalating dyes. This method may allow future investigation of intracellular blood parasite genomes using next-generation sequencing platforms or fluorescence-based super-resolution microscopy.
ACKNOWLEDGEMENTS
We would like to thank Thomas Grünkorn for invaluable help in the fieldwork and Partec GmbH (Münster, Germany) for support.
FINANCIAL SUPPORT
N.C. is supported by the Volkswagen Foundation within its Evolutionary Biology initiative, grant I/84 196. O.K. holds a Heisenberg Professorship of the German Science Foundation (DFG, KR 2089/2-1). D.W. is supported by a FiF grant of the Bielefeld University.


