Introduction
JBS Haldane's Reference Haldane1949 paper Disease and Evolution (Haldane, Reference Haldane1949) presaged human host–pathogen coevolution as a field of study (Lederberg, Reference Lederberg1999). Haldane noted that the ‘surprising biochemical diversity’ exhibited by mammalian and avian species is likely a consequence of selection from pathogens, with: ‘a particular race of bacteria or virus being adapted to individuals of a certain range of biochemical constitution’. By way of example, Haldane pointed out that different human blood group antigens may have determined the susceptibility of our ancestors to particular strains of bacteria. At the conference where he presented this work, Haldane also introduced the hypothesis that mutations responsible for heritable human blood disorders, such as the thalassaemias, had spread in certain populations due to the protection they afforded their carriers against death from malaria. Few today would dispute any of the arguments in Disease and Evolution, and the malaria hypothesis has gone on to be confirmed as an example of selection from a specific pathogen leaving a detectable signature on the human genome (Allison, Reference Allison1954; Siniscalco et al. Reference Siniscalco1961; Flint et al. Reference Flint, Hill and Bowden1986; Hill et al. Reference Hill1991).
Whilst the list of malaria resistance loci continues to grow (Kwiatkowski, Reference Kwiatkowski2005; Band et al. Reference Band2015), examples of genetic changes as a consequence of selection from any other known human pathogen are few. In a review of the host genetics of human infection (Hill, Reference Hill2006), Adrian Hill highlighted six human genes known to have a particularly strong impact on disease susceptibility. Of these, three are malaria resistance loci. The fourth is the prion protein gene, for which the selective agent is a special case of human infectious disease, consisting as it does of transmissible prion proteins themselves. The fifth is a deletion in the gene for C–C chemokine receptor type 5 (CCR5Δ32), which offers near-complete resistance to human immunodeficiency virus (HIV) infection in the homozygous state (Dean et al. Reference Dean1996; Huang et al. Reference Huang1996; Liu et al. Reference Liu1996). However, the high frequency of this mutation in Northern European populations cannot be attributed to selection from HIV since it is such a recent addition to the set of human pathogens. Smallpox and the plague have been suggested as potential selective pressures to account for the distribution of CCR5Δ32, with smallpox shown to be a theoretically more plausible candidate (Galvani and Slatkin, Reference Galvani and Slatkin2003), but the cases for either are weak (Hummel et al. Reference Hummel2005; Hedrick and Verrelli, Reference Hedrick and Verrelli2006), and others have suggested that CCR5 diversity may not be a consequence of any recent selection (Sabeti et al. Reference Sabeti2005). The sixth gene highlighted by Hill is that encoding fucosyltransferase 2. A loss-of-function mutation in this gene affords resistance to Norwalk-like virus (Lindesmith et al. Reference Lindesmith2003; Thorven et al. Reference Thorven2005), and other diarrhoea-causing pathogens (Imbert-Marcille et al. Reference Imbert-Marcille2014) – but it is not clear to what extent selection from these pathogens (or perhaps a combination of these and other infectious diseases) has determined the frequency of the mutation worldwide.
Haldane himself foresaw the difficulty of detecting human biochemical adaptations to pathogens, due to the transient nature of the advantage in most cases: ‘a disease such as diphtheria or tuberculosis is caused by a number of biochemically different races of pathogens … in a different epidemic a different a different type [of host] would be affected’ (Haldane, Reference Haldane1949). Our best-understood examples of Plasmodium falciparum malaria resistance mutations (haemoglobinopathies, glucose-6 phosphate dehydrogenase deficiency, southeast Asian ovalocytosis) all cause far-reaching changes to red blood cell physiology, changes which are likely to affect multiple, even all, strains of P. falciparum. Were it not for the fact that these mutations all cause severe physiological problems in the homozygous state, and are thus under balancing selection, we may never have detected them as resistance mutations at all since they might have become fixed in an ancestral human population.
One set of diverse human proteins that are prime candidates for Haldane's notion of biochemical, pathogen strain-specific adaptation are the human leucocyte antigens (HLAs). Class I and class II HLA molecules are responsible for the display of intracellularly derived peptide antigens (class I) and extracellularly derived peptide antigens (class II), so that they can be recognized by T-cell receptors. The nature of the HLA molecule binding cleft determines the type of peptide which can be presented, creating a potential recognition bottleneck in human adaptive immunity. Hundreds of different alleles have been reported at the three class I loci and the three paired class II loci responsible for peptide display (HLA-A, B and C in class I and HLA-DRA and HLA-DRB, HLA-DPA and HLA-DPB and HLA-DQA and HLA-DQB in class II) – polymorphism which has been attributed to selection, most likely from pathogens (Doherty and Zinkernagel, Reference Doherty and Zinkernagel1975; Hughes and Nei, Reference Hughes and Nei1988; Parham et al. Reference Parham1989; Takahata and Nei, Reference Takahata and Nei1990; Hedrick, Reference Hedrick2002; Borghans et al. Reference Borghans, Beltman and De Boer2004; De Boer et al. Reference De Boer2004; Prugnolle et al. Reference Prugnolle2005; Lenz, Reference Lenz2011; Eizaguirre et al. Reference Eizaguirre2012a, Reference Eizaguirreb). It has in particular been argued that host–pathogen coevolution as opposed to heterozygote advantage is necessary to maintain such levels of polymorphism (Borghans et al. Reference Borghans, Beltman and De Boer2004). Specific HLA genotypes have been shown to confer susceptibility or resistance to different infectious disease outcomes (Hill et al. Reference Hill1991; Kaslow et al. Reference Kaslow1996; Jeffery et al. Reference Jeffery1999; Dunstan et al. Reference Dunstan2014). A recent study comparing the genetic diversity of an indigenous North American population, before and after the arrival of European invaders (and their pathogens), found a dramatic change in the frequency of a HLA-DQA1 allele (Lindo et al. Reference Lindo2016), which might reflect that population's changing experience of infectious disease.
Population-level evolution of the pathogen HIV has been shown to occur in response to the immunological selection pressure generated by the presence of particular HLA types (Cotton et al, Reference Cotton2014; Payne et al. Reference Payne2014), emphasizing the coevolutionary potential of pathogen/HLA interactions. Although, as previously noted, HIV is unlikely to have had enough time to drive substantial changes in human allele frequencies, the relationship between HIV and HLA is worth considering in more detail, since it is the best studied pathogen–HLA interaction to date, with data drawn from cohorts of thousands of patients (reviewed in McLaren and Carrington, Reference McLaren and Carrington2015). Certain HLA alleles are associated with better viral control and a slower progression to acquired immune deficiency syndrome (AIDS) (e.g. HLA B*57 and HLA B*27 alleles), whilst others are associated with faster progression to AIDS (e.g. some HLA B*35 alleles). As noted by McLaren and Carrington, many individuals with a protective HLA type progress to AIDS at a similar rate to those without; thus, there is no HLA allele that guarantees control of HIV. However, even though protection is not consistent across individuals, a chimpanzee Major Histocompatibility Complex group B (MHC-B) variant, Patr-B*06 : 03, with structural similarities to HLA B*57, is associated with lower SIV loads in chimpanzee fecal samples (Wroblewski et al. Reference Wroblewski2015) – demonstrating that aspects of the way HLA/MHC molecules help combat retroviruses may be consistent across species. Recent studies have been able to identify the amino acids present at specific sites in HLA-binding grooves, which account for protective effects previously identified at the allelic level – underscoring that the specific properties of the peptides that HLA molecules are capable of presenting to T cells has a critical impact on disease progression (The International HIV Controllers Study, 2010; McLaren et al. Reference McLaren2015). However, the expression level of HLA-C has also been shown to have a protective effect, with higher expression of HLA-C associated with better viral control (Thomas et al. Reference Thomas2009; Kulkarni et al. Reference Kulkarni2011; Apps et al. Reference Apps2013). Whether the protective effect of HLA-C expression level is due to better presentation to T cells or to interactions with other elements of the immune system (e.g. natural killer cells) is unknown.
We have previously shown that a multi-strain pathogen and multi-gene host HLA haplotypes have the potential to display complex coevolutionary cycling (Penman et al. Reference Penman2013). Within the framework we proposed, at any given time, only a small subset of host homozygotes would be susceptible to severe infection. The nature of that subset depended on the state of the pathogen population. However, this generated enough selection pressure to drive long-lasting non-overlapping associations between alleles at separate HLA loci, even in the presence of recombination between those loci. We proposed that such non-overlapping associations could be a signature of pathogen selection and could even be harnessed as a means to functionally classify different HLAs. Our original model, however, included only a single pathogen species. HLAs must be under selection from multiple pathogens simultaneously. Here we simulate the coevolution of two linked HLA loci with two independently circulating pathogens, where antigens from either pathogen can be displayed at either HLA locus. We show that, despite conflicting selection from a second pathogen, a pathogen that causes consistent, high mortality could theoretically leave a strong signature in HLA population genetics.
Methods
We adopted an individual-based simulation approach, extending that described in Penman et al. (Reference Penman2013). We considered 10 different HLA-binding types (represented by the digits 1–10), which could be found on HLA molecules encoded by either of two linked HLA loci in the host genome. There was no restriction on which binding properties could be present at which HLA locus, which meant there were 100 possible HLA haplotypic combinations ([1,1]; [1,2]; [1,3] … [10,10]) in our simulated population, arranged into diploid host genotypes. Once a host had been infected with a pathogen expressing a peptide that could be displayed by an HLA molecule encoded in that host's genome, we assumed that host to have lifelong immunity against infection with any other pathogen of that species expressing that peptide.
We assumed that two pathogen species were present (1 and 2). Each species possessed a number of antigenically variant peptides, expressed at two different sites per pathogen, and defined by the HLAs that could bind them (i.e. a digit between 1 and 10). We allowed four variants per antigenic site on each pathogen, thus 16 possible strains of each pathogen (K ij). The distribution of variant peptides, which could be displayed by particular HLA binding types for each antigenic site on each pathogen, is given in Table 1. A visualization of the relationship between host HLA genotype and pathogen strains is provided in Fig. 1.
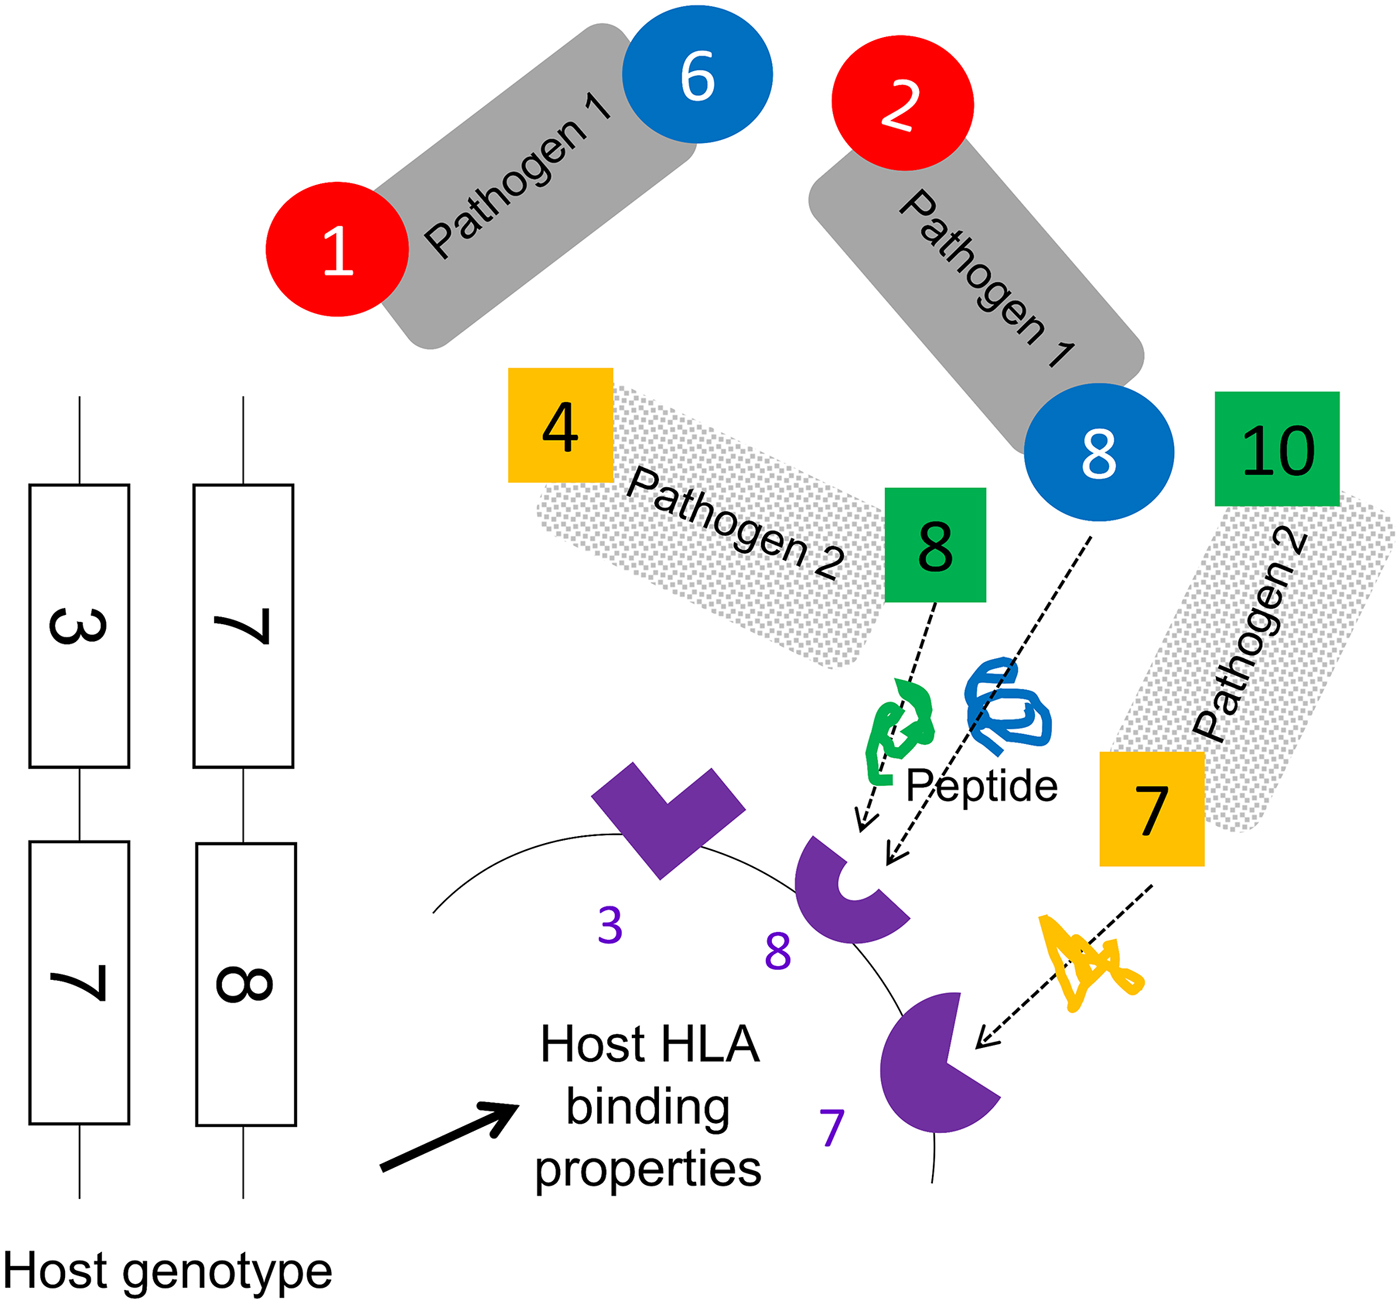
Fig. 1. A schematic representation of model assumptions. As noted in the Methods, we allowed there to exist 10 HLA types with different binding properties (represented by the numbers 1–10), which could be encoded by genes found at either locus of a two locus HLA haplotype. Pathogen species 1 and 2 each possess two antigenic sites (represented here by different colours), at which antigens containing peptide fragments which could be bound by specific HLA molecules can be expressed. Four different antigens can be expressed at each antigenic site (see Table 1 for a description of which antigenic variants are present on which site in which pathogen species). The combination of HLA-binding types, which can present peptides from a particular pathogen defines its strain, e.g. a possible strain of pathogen 1, is [2,8]. As illustrated in this figure, certain HLA molecules are capable of presenting a peptide from either pathogen 1 or pathogen 2. Note that this figure does not display the entire range of possible host or pathogen genotypes.
Table 1. The antigenic properties of the two pathogens
We conceptualize pathogen antigenic variation in terms of which host HLA-binding sites are capable of presenting a peptide from any particular pathogen antigenic site. As shown in Table 1, for pathogen 1, site i, we assume that there are four possible peptide variants the pathogen can express, which can be displayed by HLA molecules 1, 2, 3 and 4, respectively. It therefore becomes possible to define a pathogen strain in terms of which HLA types are capable of displaying the particular motifs found at its two antigenic sites (e.g. ‘strain 2,8 of pathogen 1’ – which expresses peptides that can be bound by HLA molecules 2 and 8). We restrict the number of possible variants at each of the antigenic sites in the model to four. Our model must allow for the possibility that the molecular properties, which allow a pathogen peptide to be displayed by a particular HLA molecule, might be shared by peptides from a different species of pathogen, since the fact that a particular HLA molecule might be involved in making an effective response to more than one pathogen species is the focus of this investigation. Thus, as shown in the table, HLA molecule 2 is capable of displaying a peptide from pathogen 1 antigenic site i, and from pathogen 2 antigenic site j. However, crucially, our model does not assume that these two peptides are identical – merely that they can both be displayed by HLA molecule 2. An adaptive immune response to a peptide from pathogen 1 displayed by HLA molecule 2, therefore, only confers lifelong protection against infection with other strains of pathogen 1, which display the peptide that can be displayed by HLA molecule 2. HLA molecules 2, 3, 4, 8 and 9 can all display peptides from either pathogen. HLA molecules 1, 6, 5 and 7 can only display a peptide from one or other pathogen species (see underlining in the third column).
HLA binding types 1 and 6 only present motifs from pathogen 1. HLA binding types 5 and 10 only present motifs from pathogen 2. All other HLA binding types can present motifs from either pathogen. We assumed no cross-immunity between the pathogens; thus, whatever peptide from pathogen K ij happened to be displayed by HLA i would not elicit any memory immune response against a peptide from pathogen L ij that could also be displayed by HLA i.
Each host in the population was represented by a vector containing the host's age, sex, diploid HLA genotype, infection status and immunological status. A maximum of 2000 hosts could exist in the population, but this maximum did not have to be present at every time step. If, in a given generation, the population size ever dropped down to or below an arbitrarily chosen threshold (for the simulations shown here, 20 individuals), the population was deemed to have failed and that particular simulation ceased. A single time step of our simulation represented 1 day. During each day, every host could (with probabilities defined in Table 2) become infected; recover from infection; die from infection or die by random chance. Every time step, adult (>5400 days (~15 years) old) female hosts could also reproduce with a given probability, choosing a male partner at random, and generating an offspring genotype via Mendelian inheritance. For the simulations shown here, the age of reproducing males was not restricted to >15 years, but applying such a restriction makes no difference to the conclusions. An individual with the offspring genotype was then added to the population. If the population happened to be at its maximum possible size of 2000, then the new individual replaced a randomly chosen existing member of the population.
Table 2. Different events that could take place within each time step and the probability of each
Every time a new infection occurred, one of that pathogen's antigenic sites could mutate, so that it expressed one of the other peptides possible at that site with probability m. Every time hosts reproduced, recombination could occur between the two HLA loci (in either maternal or paternal genotype), with probability r. For simplicity, our model does not explicitly simulate HLA mutation: over the timescale simulated, in a small population, frequency changes of existing HLA variation are likely to be more important than the spontaneous emergence of new HLA variants. However, in each time step, there was a fixed probability (α) of a new host individual, of randomly generated diploid genotype selected from HLA genes 1–10, replacing a randomly chosen existing member of the population. This represents migration into the population and ensured that the stochastic loss from the population of one of the pathogen species, or of a particular HLA-binding specificity, was not permanent.
Parameter values and starting conditions
Our purpose was to determine whether it is possible that a specific pathogen species should leave a population genetic signature in the HLA region, despite conflicting selection pressures from other pathogens. Our analyses therefore focused on varying the probabilities of death from infection associated with the two pathogens (θ 1 and θ 2). We varied θ 1 between 0 and 0.0001 per day, and θ 2 between 0 and 0.002 per day. For most of our simulations, θ 1 and θ 2 applied to hosts of any age, but we also explored whether our conclusions would change if infectious disease mortality only affected young children. To achieve this, we carried out separate simulations where we only applied probabilities θ 1 and θ 2 of dying whilst infected to those <1800 days (~5 years) old.
For pathogen 1, the transmission parameter and the probability of recovering from infection during any given day were always β 1 = 0.3 and σ 1 = 0.02. When pathogen 2 was continuously present, we also applied β 2 = 0.3 and σ 2 = 0.02. However, we additionally sought to investigate the consequences of the periodic loss of pathogen 2 from the population. To generate this behaviour, we applied a higher transmission parameter (β 2 = 0.4) and a higher probability of recovering from infection on any given day (σ 2 = 0.1).
Rates of recombination in the HLA region appear to vary considerably (Carrington, Reference Carrington1999; Cullen et al. Reference Cullen2002). The results in the main text use a value of r = 0, thus are more likely to apply to HLA loci that are physically very close, but we explore the effects of two higher recombination probabilities (r = 0.01 and a very high probability of r = 0.05) in the Supplementary material.
All other parameters were fixed at values chosen to be plausible for human populations. The probability of dying from non-infectious disease causes on any given day (μ) was = 0.00007, and the probability of a female over the age of 5400 days (~15 years) giving birth on any given day (ϖ) was = 0.0015. These values ensured that the population exhibited a plausible age distribution for a human population in the absence of modern medicine: pyramidal in shape, with the greatest numbers of individuals in the youngest age groups and ~5% or less of the population over the age of 40 years (see Supplementary Fig. S1). The probability of a new individual of a random genotype entering the population during any day was set at α = 0.000278, equivalent to assuming a migrant might arrive on average once every 3600 days, and the mutation probability of the pathogen was set at m = 0.00001 per new infection.
At the start of each simulation, 1000 hosts were present, with ages randomly assigned between 1 and 12600 days (~35 years). Ninety per cent of the HLA haplotypes in the population were of the combination [3,3], intended to capture the fact that a human population might be dominated by a relatively small number of founding HLA haplotypes. The remaining 10% of HLA haplotypes present were generated at random from the 10 possible HLA-binding types. No hosts had any pre-existing immunity to either pathogen at the start of the simulation. To seed infections, 10 hosts were chosen at random to be infected with randomly generated strains of pathogen 1, and 10 with randomly generated strains of pathogen 2. The simulations ran for 270 000 days (~740 years). For each parameter combination presented in the main text or the Supplementary material, we carried out 300 simulations.
Results
(i) High mortality from a single pathogen selects for host HLA haplotypes, which recognize as many variants as possible from a single antigenic site on that pathogen
We first considered the behaviour of the model when just one of the two pathogens caused mortality. We observed that when the mortality caused by pathogen K is very high, the two most frequent host haplotypes in the population after 740 years of coevolution contained within them exactly the four HLA-binding types required to display all of the possible variants present at one of the antigenic loci belonging to pathogen K. Figure 2 displays the results of a simulation exhibiting such adaptation as a consequence of high levels of mortality from pathogen 2. The [5,4] and [7,3] dominate the population, and between them could present any peptide that could be displayed at locus 1 of pathogen 2.
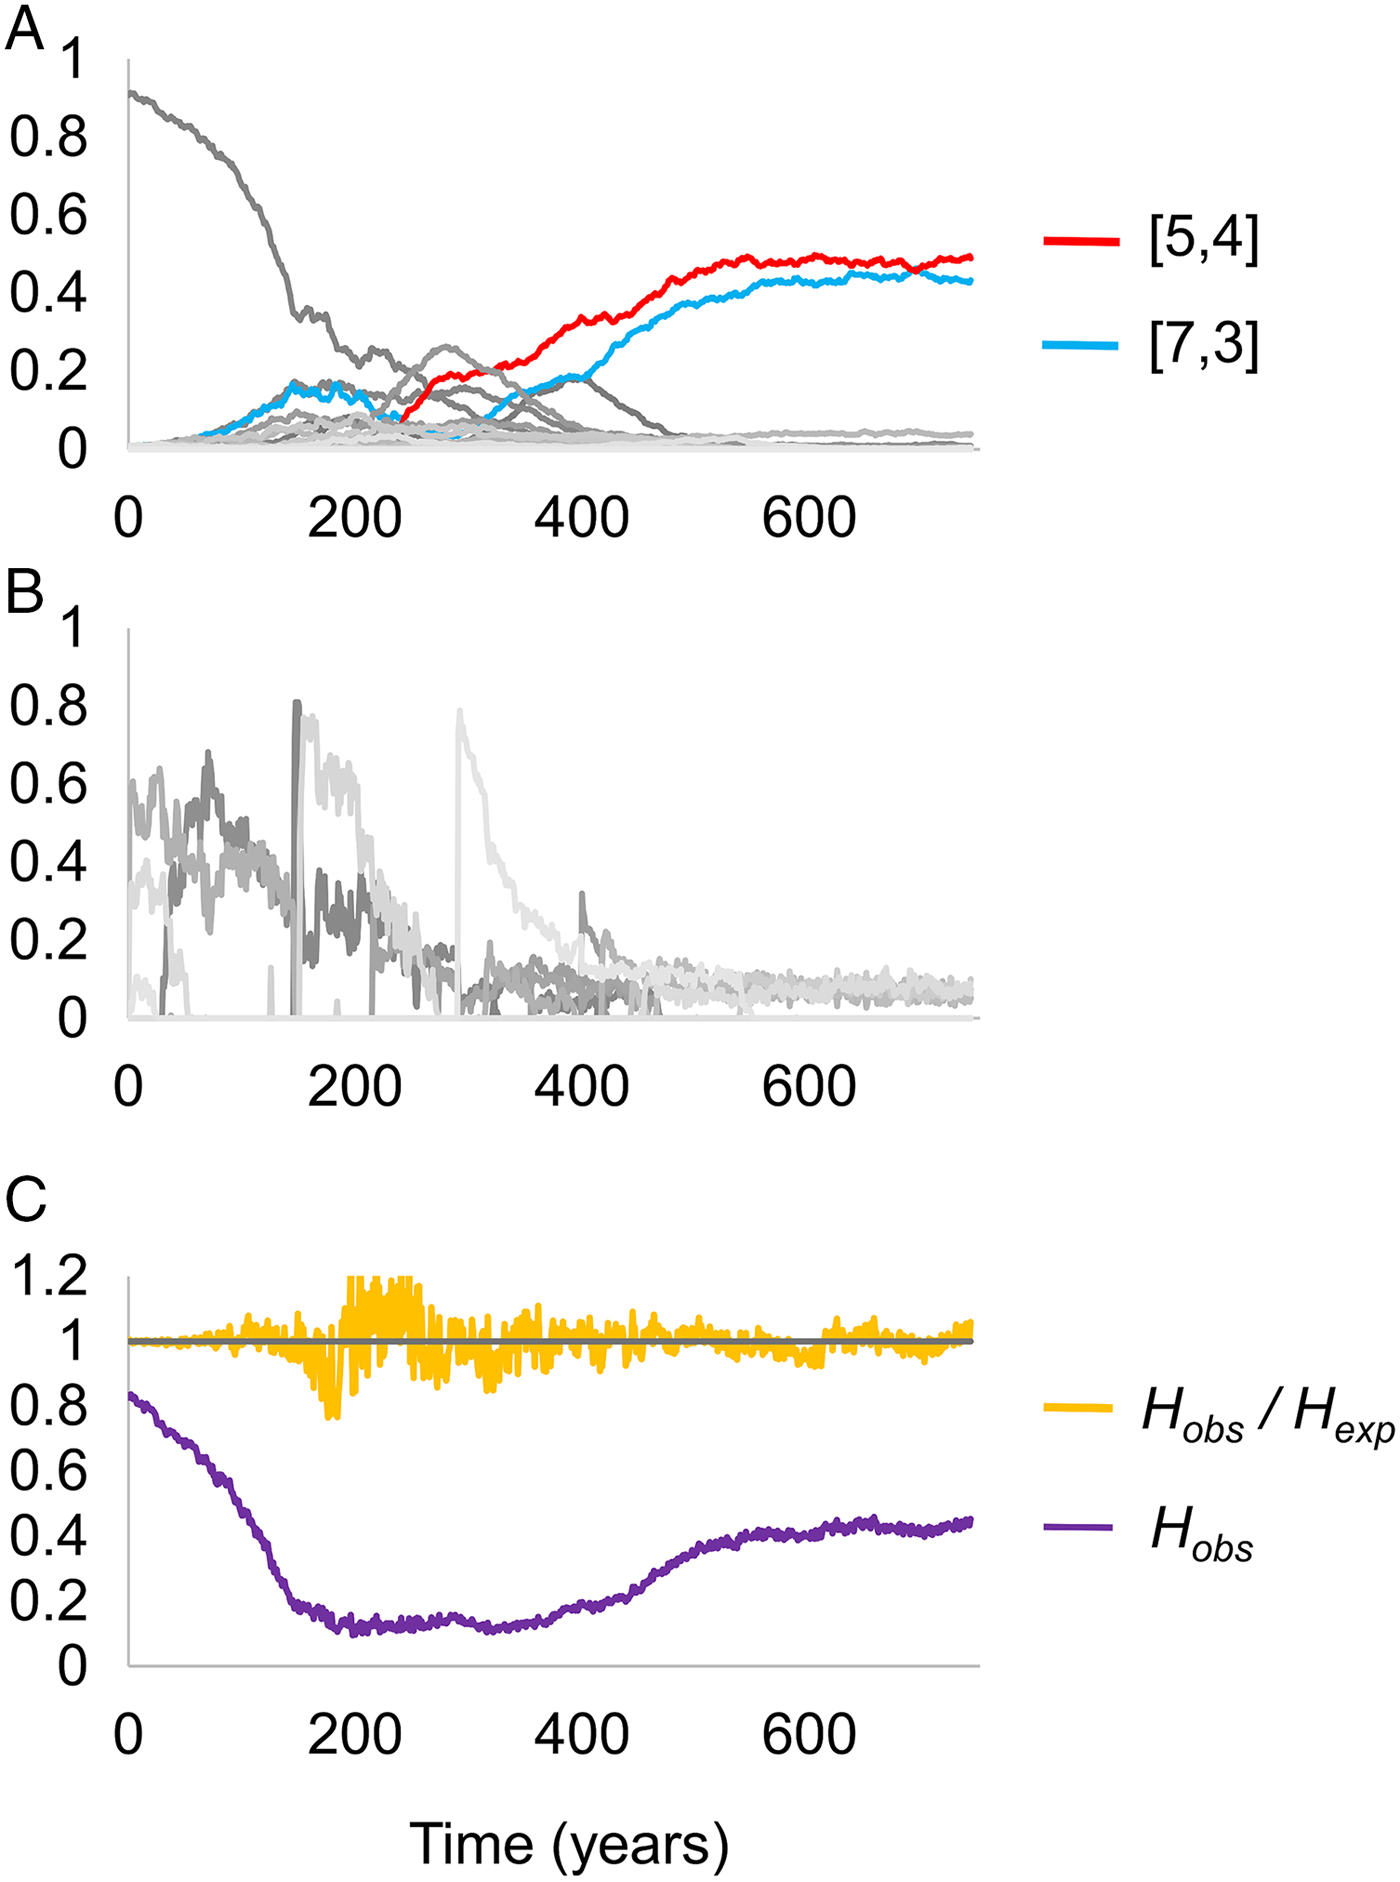
Fig. 2. Changing frequencies of HLA haplotypes over time, under selection from pathogen 2. Panel (A) illustrates the frequencies of different HLA haplotypes over the course of a single simulation, panel (B) illustrates the frequencies of different strains of pathogen 2 during the same simulation, and panel (C) indicates the proportion of the population that is homozygous for any HLA haplotype (homozygosity, H), and the ratio of the observed homozygosity in the simulation (H obs) to that expected under Hardy–Weinberg proportions (H exp). Each shade of grey in panels (A) and (B) represents a different haplotype or pathogen strain. There are too many HLA haplotypes and pathogen strains to label individually, but two host haplotypes have been highlighted in red and blue. Between them, these haplotypes cover all four possible variants at antigenic site 1 of pathogen 2. Parameter values as follows: r = 0.01, β 2 = 0.3, σ 2 = 0.02, θ 1 = 0 and θ 2 = 0.002; other parameters were as detailed in the Methods.
As noted in the Methods, we started each simulation with the population containing a high frequency of a single haplotype. Figure 2C shows that the high level of homozygosity (H obs) associated with this state declines as pathogen selection begins, but as adaptation to pathogen 2 emerges, homozygosity rises once more – reflecting the high frequency of only a few HLA haplotypes in the adapted population.
Taking the behaviour shown in Fig. 2 as the most extreme form of population genetic adaptation possible, we defined three levels of population genetic adaptation to a multi-strain pathogen, which should occur at different pathogen mortality rates:
(i) Weak adaptation to pathogen K: one of the two most frequent HLA haplotypes in the population can display one of pathogen K’s unique motifs.
(ii) Moderate adaption to pathogen K: the two most frequent HLA haplotypes in the host population contain exactly the four HLA types required to display all of the possible variants present at one of pathogen K’s two antigenic loci, and the combined frequency of those two haplotypes is ⩽50%
(iii) Strong adaptation to pathogen K: the two most frequent haplotypes in the population contain exactly the four HLA types required to display all of the possible variants present at one of pathogen K’s two antigenic loci, and the combined frequency of those two haplotypes is >50%. This is the case represented in Fig. 2.
(ii) A high-mortality pathogen can leave a strong genetic signature despite conflicting selection from a second pathogen
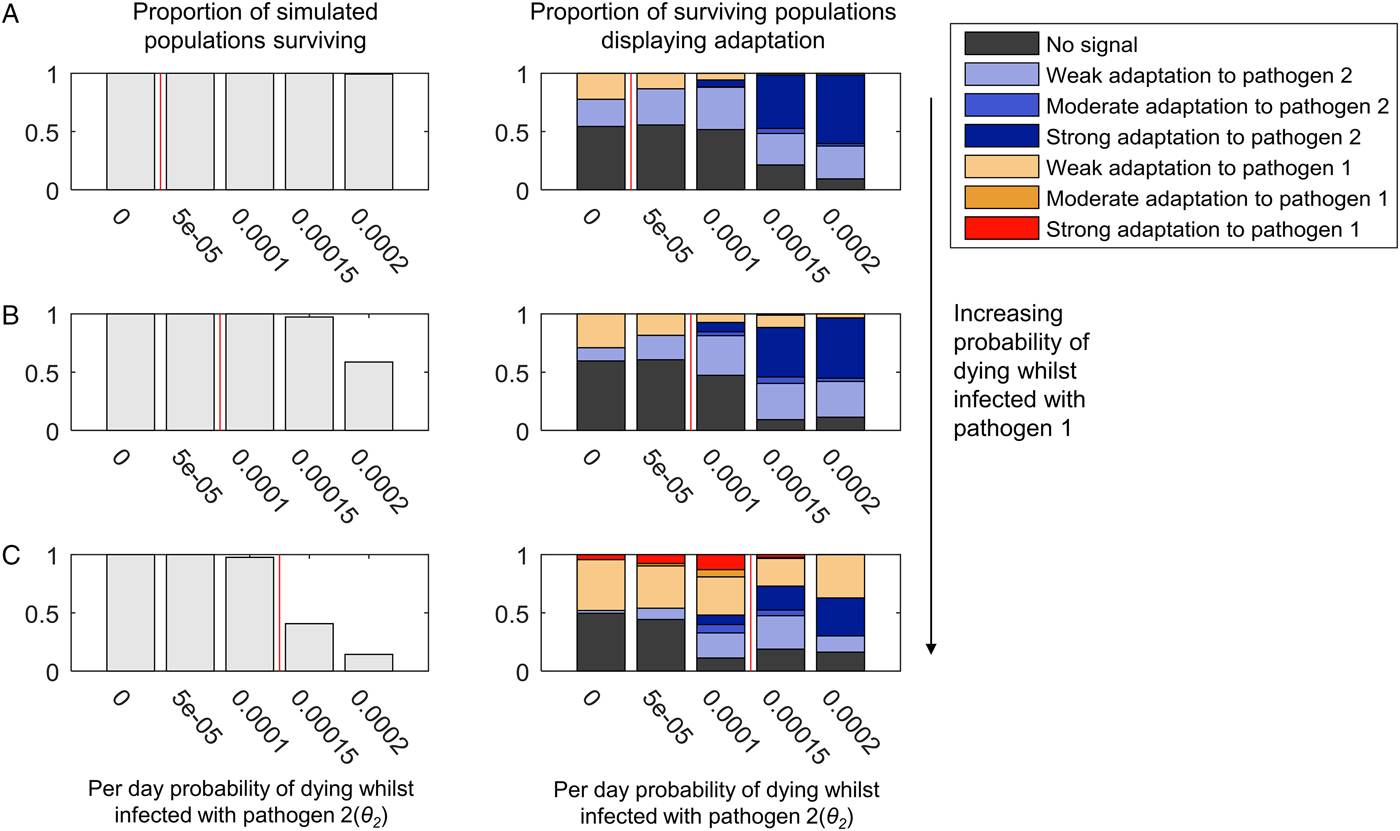
Figure 3 illustrates the population genetic patterns observed when both pathogens 1 and 2 cause mortality, and are continuously present in the population. The strength of adaptation to pathogen 2 increases with the probability of mortality whilst infected with pathogen 2 (indicated on the x-axis in each graph).

Fig. 3. The adaptation of populations under continuous selection from pathogens 1 and 2. The bar chart on the left-hand side of each panel illustrates the proportion of simulated populations surviving, out of 300 simulations at each parameter combination. The bar chart on the right-hand side of each panel illustrates the proportion of the surviving populations displaying adaptation to one or other pathogen, or no adaptation signal (see legend, and see the text for definition of different types of adaptation). Within each graph, the mortality caused by pathogen 2 (θ 2) increases along the x-axis. The mortality caused by pathogen 1 is zero in panel (A) (θ 1 = 0), and increases in value in panels (B) and (C) (B: θ 1 = 0.00005, C: θ 1 = 0.0001). Pathogen 2 has a higher probability of causing death during infection than pathogen 1 (θ 2 > θ 1) in the regions to the right-hand side of the vertical red line in each panel. β 2 = 0.3, σ 2 = 0.02 and r = 0. All other parameter values were as detailed in the ‘Methods’ section.
Adaptation to pathogen 2 at high levels of mortality occurs despite the presence of conflicting selection from pathogen 1 (Fig. 3B and C). Mortality from pathogen 1 at a low level (Fig. 3B) barely disrupts adaptation to pathogen 2 at all, despite the greater pathogen burden on the population evidenced by the reduction in population survival. A higher level of pathogen 1 mortality (Fig. 3C) is associated with some reductions in the probability of observing adaptation to pathogen 2, but so long as pathogen 2 has the greater probability of causing mortality (bars to the right of the red lines in Fig. 3), there is a greater probability that the population will display a form of adaptation to pathogen 2 than pathogen 1 (54% adaptation to pathogen 2, 27% adaptation to pathogen 1 at θ 2 = 0.00015; 47% adaptation to pathogen 2, 37% adaptation to pathogen 1 at θ 2 = 0.0002).
When both pathogens 1 and 2 cause a high level of mortality, we might have expected the conflicting selection pressures to lead to many simulated populations displaying no obvious adaptation. However, as seen in Fig. 3C, where both θ 1 = 0.0001 and θ 2 = 0.0001 (i.e. the pathogens have identical mortality probabilities), 89% of simulations display adaptation to one or other pathogen. At this level of pathogen 2 mortality, adding mortality from pathogen 1 simply increases the probability of observing any population adaptation at all. When θ 1 = 0 and θ 2 = 0.0001, 52% of simulations display no adaptation (Fig. 3A); when θ 1 = 0.00005 and θ 2 = 0.0001, 47% of simulations display no adaptation (Fig. 3B), but when θ 1 = 0.0001 and θ 2 = 0.0001, only 11% of simulations display no adaptation (Fig. 3C).
The patterns just described are largely unchanged by the addition of recombination (Supplementary Figs S2 and S3). However, the probability of observing strong adaptation to pathogen 2 in the presence of high mortality from pathogen 1 is reduced at 5% recombination between the HLA loci (Supplementary Fig. S3C). Our definition of strong population adaptation involves the top two HLA haplotypes in the population having a combined frequency >50%. Recombination breaks up haplotypic associations; thus, it is entirely reasonable that high levels of recombination should make strong adaptation less likely. Nevertheless, adaptation to pathogen 2 itself (when weak, moderate and strong forms are taken together) increases with increasing pathogen 2 mortality in our simulations at 5% recombination (Supplementary Fig. S3C), despite the conflicting selection from pathogen 1.
When we limited infectious disease mortality to individuals <5 years of age, we obtained similar patterns at higher values of θ 1 and θ 2 (Supplementary Fig. S4). To achieve a selective pressure capable of shaping the population's HLA distribution when individuals are only vulnerable to infectious disease mortality for a short period of time requires higher individual probabilities of death from infection within that window of vulnerability.
(iii) High-mortality pathogens are less likely to leave a strong genetic signature if their presence in the population is not continuous
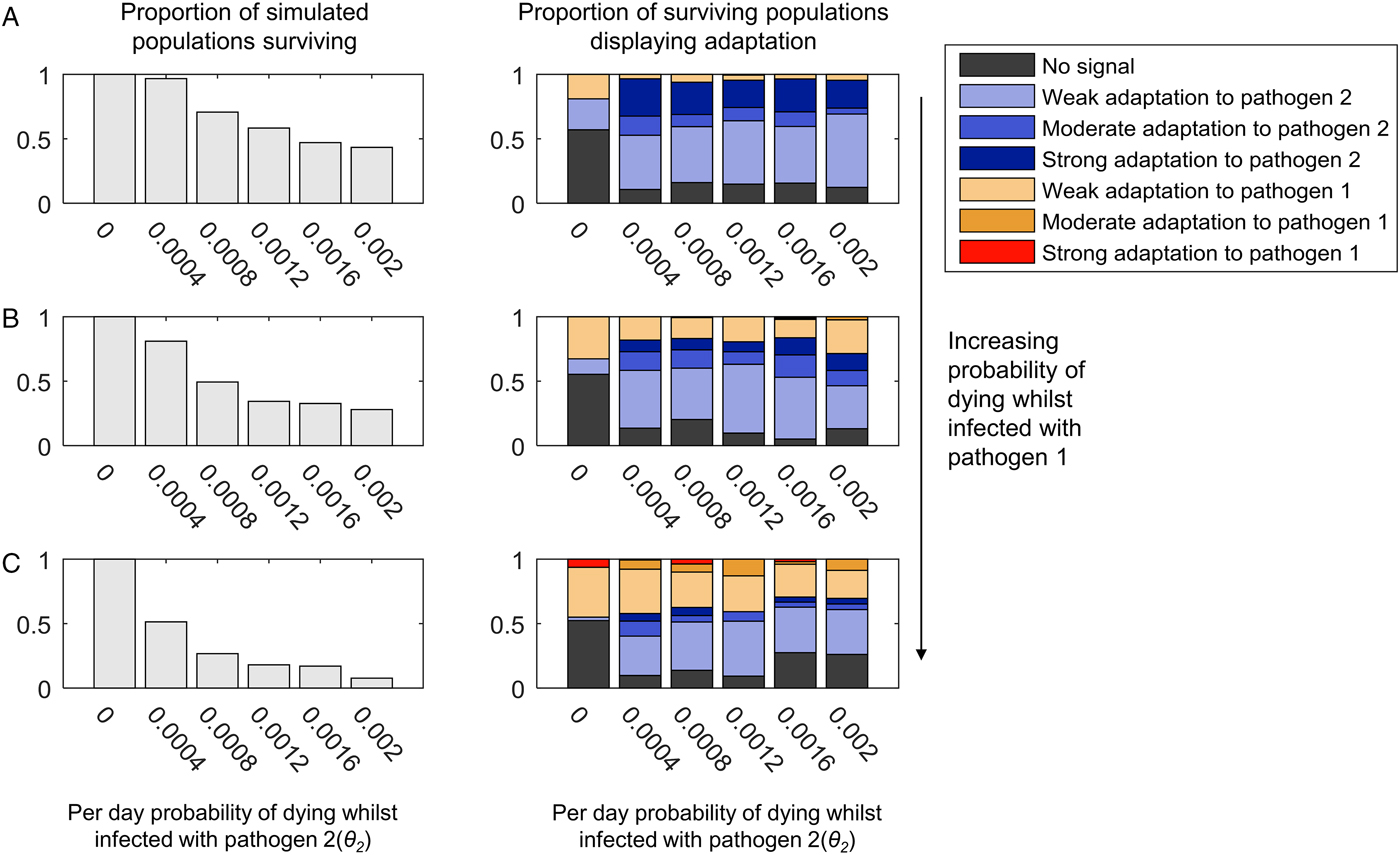
If we allow pathogen 2 to have a faster recovery rate and a higher transmission probability, we can generate scenarios where pathogen 2 can become lost from the population due to burning through its available susceptible hosts. Following such stochastic loss, pathogen 2 can be reintroduced by an infected host arriving in the host as a random introduction. As shown in Fig. 4, weak, moderate or strong adaptation to an intermittently present pathogen 2 can still be observed if pathogen 2 causes mortality. However, the greater the mortality caused by the continuously present pathogen 1, the more likely we are to observe adaptation to pathogen 1 at the expense of adaptation to pathogen 2, and less likely we are to observe moderate or strong adaptation to pathogen 2 (compare panels 4A–C). A low level of mortality from the continuously present pathogen 1 (θ 1 = 0.0005) causes more loss of adaptation to the intermittently present pathogen 2 than when pathogen 2 was continuously present (compare Fig. 4B and 3B).

Fig. 4. The adaptation of populations under continuous selection from pathogen 1 and intermittent selection from pathogen 2. This figure uses the same layout as Fig. 3. Unlike in Fig. 3, however, the transmission parameter and recovery rate for pathogen 2 have been given values that lead to pathogen 2 being lost and reintroduced into the population (β 2 = 0.4 and σ 2 = 0.1). The range of mortality rates affecting to those infected with pathogen 2 (θ 2) are also higher than in Fig. 3, as indicated by the x-axis of each graph. Just as in Fig. 3, the mortality caused by pathogen 1 is zero in panel (A) (θ 1 = 0), and increases in value in panels (B) and (C) (B: θ 1 = 0.00005, C: θ 1 = 0.0001). All other parameters are as given in the Methods.
In Fig. 4, we allowed the intermittently present pathogen 2 much higher mortality rates than the continuously present pathogen 1, so as to maximize the selective pressure caused by pathogen 2. As shown in the left-hand panels in Fig. 4, at the highest mortality probabilities, the pathogen load approaches that at which most populations do not survive. Interestingly, however, increasing the probability of death from infection with pathogen 2 seems to have little impact on the probability of observing a population specifically adapted to pathogen 2 (compare the left to right trends within the graphs in Fig. 4 with the graphs in Fig. 3). It may be that for mortality-causing pathogens, which are only present intermittently, the frequency of the exposure of the population to the pathogen is more important than the chance of dying whilst infected in determining whether or not the population exhibits population genetic adaptation to that pathogen. Additionally, too high a mortality rate for pathogen 2 may contribute to its rapid loss from the population during any individual epidemic, which could also reduce its ability to leave a population genetic signature.
When we allowed recombination to occur between the HLA loci, we observed a clear reduction in the probability of observing strong population adaptation to the intermittently present pathogen (pathogen 2) (Supplementary Figs S5 and S6). At 5% recombination between the loci, we never observed strong adaptation to pathogen 2 (Supplementary Fig. S6), although weak and moderate adaptation was still possible. As noted previously, this effect is unsurprising, since our definition of strong population adaptation involves >50% of the HLA haplotypes in the population being adapted to the pathogen in question. If pathogen 2 is only intermittently present, every time it is absent from the population, recombination will act unchecked to break up the haplotypic combinations that are specifically adapted to pathogen 2 – thus maintaining combined frequencies of such haplotypes >50% is unlikely.
Discussion
Our simulations demonstrate that individual high-mortality pathogens have the potential to generate specific signatures amongst HLA genes, despite conflicting selection from other mortality-causing pathogens. These signatures take the form of population-level HLA haplotype frequency patterns. The most important implications of our two-pathogen model can be summarized as follows:
(i) The greater the overall pathogen burden, the more likely a population is to display specific adaptation to any pathogen.
(ii) For continuously present pathogens, the higher the pathogen mortality, the more likely the pathogen is to leave a signature.
(iii) Population genetic signatures of adaptation to intermittently present pathogens can be readily disrupted by selection from continuously present pathogens, and the lethality of an intermittently present pathogen per se is not a predictor of whether adaptation will occur.
Pathogens which are likely to have caused high levels of mortality for continuous periods in the history of various human populations include P. falciparum, Leishmania spp. Mycobacterium tuberculosis, Streptococcus pneumoniae, Treponema pallidum, poliovirus, smallpox virus and yellow fever virus. Our simulations suggest that pathogens such as these might be more likely to have determined the array of HLA haplotypes that successfully reached high frequencies in affected populations than characteristically intermittent pathogens, such as Bacillus anthracis, Yersinia pestis or Rickettsia spp. We demonstrated that the mortality rate of an intermittently present pathogen has little effect on the probability of observing adaptation to that pathogen, and speculated that the frequency of introduction of intermittently present pathogens may be more important. However, to make any prediction of the frequency of introduction and/or duration of epidemics necessary for any given intermittent pathogen to have left an HLA signature will require additional theoretical work, as well as improved understanding of the strain diversity present in the pathogen species of interest.
Although the population genetic signatures of pathogen selection we have identified take the form of HLA haplotype frequency patterns, our model makes no explicit assumption that selection acts at the allelic or haplotypic level. However, we do assume that the effects of being able to express different HLA molecules combine additively. This means that it is always advantageous to maximize the diversity of HLA recognition types present in a host genome, and this in turn generates a specific form of selection at the haplotypic level, for only certain combinations of haplotypes maximize HLA recognition diversity when they coexist. Maximizing recognition diversity certainly seems likely to be a major factor in determining the evolution of HLA alleles and haplotypes – but it is possible that HLA alleles interact with one another in non-additive ways too. The most obvious ways in which this could occur are (i) if HLA expression level is important (as for HIV and HLA-C), or (ii) if HLA alleles differ in the breadth of types of peptide that they can display (i.e. in their binding promiscuity), which certainly affects MHC-based infectious disease susceptibility in chickens (Chappell et al. Reference Chappell2015), and which is also linked to expression level of the MHC/HLA molecule in question (Chappell et al. Reference Chappell2015). The type of population genetic pattern, which may result from pathogen selection where HLA expression level or binding promiscuity (or both) is crucial, is beyond the scope of our present model, and allowing for such effects in future models is a priority.
Most pathogens possess greater antigenic diversity than that represented in our model, and humans certainly possess greater HLA diversity. Furthermore, our definitions of ‘weak’, ‘moderate’ and ‘strong’ patterns of selection rely on our complete knowledge of the modelled system and which antigenic variants are expressed by which pathogens. These definitions are therefore not intended to be applied directly to human populations (where such complete knowledge is beyond our current understanding), but rather to illustrate the principle that the highest frequency HLA haplotypes present in a given human population might represent ‘moderate’ or ‘strong’ population genetic signatures of specific pathogens. In other words, those haplotypes might, between them, maximize the capacity of the human immune system to recognize the antigenic diversity present at just one variable site of a single pathogen species, despite the fact that HLA loci are under selection from multiple pathogen species. We propose that it is worth considering which of the mortality-causing pathogens that have coexisted with particular populations for a long time could be responsible for the elevation of particular combinations of HLA haplotypes. An additional important principle to emerge from our model is that selection from identical pathogens could still result in completely different suites of HLA haplotypes reaching high frequency in different populations, depending on the antigenic site, which happened to become immunodominant (i.e. the antigenic site that population's HLAs evolved to target).
Will it ever be feasible to measure the degree to which HLA recognition capacity in a population prioritizes the variants of a specific pathogen antigen? The immune epitope database (Vita et al. Reference Vita2015) is an invaluable resource, collating our current knowledge of antibody and T-cell epitopes. It is, however, limited by the experiments that have so far been carried out, so does not represent an unbiased sampling of epitopes that could be recognized. However, as epitope prediction continues to improve for different MHC molecules, and as whole-genome datasets become available for more and more pathogens, it may become possible to look for correlations between the highest frequency HLA haplotypes in specific populations and their capacity, across multiple HLA loci, to recognize the variation encoded by candidate antigenic regions in high-mortality pathogen genomes. If evolutionary HLA–pathogen relationships can be identified in this way, they will help focus our attention on the most immunogenic elements of those pathogens, which will be of enormous benefit to ongoing efforts to develop effective treatments and prophylaxis.
In the ‘Introduction’, we noted that selection from malaria parasites has had the most easily measurable impact on human genetics. It is becoming clear, however, that understanding malaria selection by examining a single locus at a time is insufficient: interactions between protective mutations at separate loci can cancel out the malaria protective effect of both when they are coinherited (Williams et al. Reference Williams2005). Furthermore, such epistasis may have determined the particular suites of protective variants that coexist in given populations (Penman et al. Reference Penman2009, Reference Penman2011, Reference Penman, Gupta and Buckee2012). The simulations we present here demonstrate that these principles could be usefully applied to understanding human–pathogen coevolution generally: adaptation to a pathogen can take the form of the specific collection of alleles found across several loci, not the particular variants found at only a single locus.
In addition to the likely non-additive fitness consequences of particular alleles at different HLA loci, HLA alleles have been shown to interact epistatically with variants at killer cell immunoglobulin-like receptor loci (KIRs) (Martin et al. Reference Martin2002; Hiby et al. Reference Hiby2004; Khakoo et al. Reference Khakoo2004; Seich al Basatena et al. Reference Seich al Basatena2011). KIRs are natural killer cell receptors, which are very likely to be undergoing coevolution with pathogens (Carrillo-Bustamante et al. Reference Carrillo-Bustamante, Kesmir and de Boer2013, Reference Carrillo-Bustamante, Kesmir and de Boer2014, Reference Carrillo-Bustamante, Kesmir and de Boer2015; Parham and Moffett, Reference Parham and Moffett2013; Penman et al. Reference Penman2016), and many KIRs interact directly with HLA molecules in order to perform their function. The repertoire of KIR alleles present in a particular population may thus also shape the set of HLA haplotypes that come to dominate. Balancing selection for extremely high polymorphism in both HLAs and KIRs is evident in a detailed study of a West African population (Norman et al. Reference Norman2013). Cappittini et al. observed that HLA-A and -B haplotypic combinations in an Italian population are configured, so that HLA-B alleles that do not serve as KIR ligands are more likely to be found alongside HLA-A alleles, which do serve as KIR ligands – maximizing the chance that at least one of HLA-A or-B in an individual's genome should have an interacting KIR (Capittini et al. Reference Capittini2012). It has also been shown that class I HLAs tend to exist in haplotypes that either combine HLA-B and -C KIR ligands, or have HLA-B alleles that are able to supply ligands for another natural killer cell receptor, CD94:NKG2A (Horowitz et al. Reference Horowitz2016). Such effects will have acted alongside selection from specific pathogens in determining the HLA patterns that have emerged in individual populations, and incorporating them in future simulation models will assist in attempts to delineate the population genetic signatures of both.
Theoretical work on generalized host–pathogen systems has shown that selection from two independent pathogens, interacting with two separate host loci, can drive the evolution of ‘high complementarity equilibria’, whereby the host loci exhibit strong linkage disequilibrium (Kouyos et al. Reference Kouyos2009). For that specific type of population genetic patterning to emerge, both pathogens would have to be present. Here we have focused on the confounding effects of dual pathogen selection to show that a single pathogen can still drive population genetic patterning even when a second pathogen interacts with the same loci. However, future work should also consider the situation where a subset of pathogens interact solely with a subset of HLA loci, and other pathogens interact solely with a different subset – the overarching population genetic rules governing the associations between different sets of alleles at different HLA loci are likely to be affected by such structuring.
Concluding remarks
As Haldane pointed out, surviving infectious disease is on a par with the pressure to find food or successfully mate in terms of evolutionary significance. For human–pathogen coevolution, the case for malaria selection is clear, but we have few other examples of infectious diseases that can be linked directly to changes in human allele frequencies. Our simulations suggest that evolutionary signatures of specific, continuously present, high-mortality human pathogens should exist in the form of particular combinations of HLA haplotypes. Identifying and understanding such patterns could ultimately pay dividends as we seek to mitigate or emulate the contributions of different genotypes to human health.
Financial support
S.G. receives funding from the European Research Council under the European Union's Seventh Framework Programme (FP7/2007-2013)/ERC grant agreement no. 268904-DIVERSITY.
Supplementary material
The supplementary material for this article can be found at https://doi.org/10.1017/S0031182017001159.