Kaolin clay, quartz and feldspars are used for the production of whiteware porcelains and vitrified ceramic products that are white in colour or artificially coloured, translucent (except for thick pieces) and resonant (Singer & Singer, Reference Singer and Singer1963). Their characteristics have been reviewed recently in the case of vitreous sanitary ware by Bernasconi et al. (Reference Bernasconi, Marinoni, Pavese, Francescone and Young2014). Chen et al. (Reference Chen, Wang and Hon2004) studied the kinetics of mullite formation and the evolution of mullite grain width in kaolin sintering at 1300°C. The phase transformation of kaolinite, as a function of temperature, was reviewed extensively by Chakraborty (Reference Chakraborty2014). The locations of the compositions of various ceramic products in a triaxial diagram (Romero & Perez, Reference Romero and Perez2015) are shown in Fig. 1.

Fig. 1. Triaxial diagram showing compositions of various porcelain products, modified after Romero and Pérez (Reference Romero and Perez2015). Group 5 also includes α-alumina filler.
The raw materials and the processing and microstructure of porcelains were studied by Carty & Senapati (Reference Carty and Senapati1998). The formation of the first liquid happens at temperatures >985°C, related to the disappearance of K-feldspar and subsequent progressive decrease in crystalline SiO2 until total disappearance. Mullite, formed mainly from kaolinite, is the only crystalline phase in equilibrium with melt at the end of the process, although SiO2, which is not totally dissolved in the liquid phase, usually remains in porcelains. Mullite compositions may be referred to as the solid solution series Al4+2xSi2−2xO10−x, corresponding approximately to the range 55–90 mol.% Al2O3 (Schneider et al., Reference Schneider, Schreuer and Hildmann2008). The two stoichiometric compositions of mullite are 2Al2O3·SiO2 and 3Al2O3·2SiO2 (referred to by many as 2:1 or primary mullite and 3:2 or secondary mullite, with 77 and 72 wt.% Al2O3, respectively). Mullite compositions ranging from 2:1 to 3:2 have been observed in clay-derived vitreous ceramics (Lee et al., Reference Lee, Souza, McConville, Tarvornpanich and Iqbal2008).
Mullite crystals show various morphologies as a function of the processing method. In the case of standard porcelains, small (<0.5 μm long) primary 2:1 mullite crystals formed in clay relicts and 3:2 acicular (>1 μm long) mullite crystals formed in feldspar relicts were distinguished by Iqbal & Lee (Reference Iqbal and Lee1999). Iqbal & Lee (Reference Iqbal and Lee2000) and Lee & Iqbal (Reference Lee and Iqbal2001) reviewed the compositions and morphologies of three different types of mullite formed during the firing of porcelains. Type I, 2:1 primary mullite, with a crystal aspect ratio in the range 1:1–3:1, grows in micro-regions of kaolinite clay agglomerates. Type II, 3:2 secondary mullite, with a crystal aspect ratio of 3:1–10:1, crystallizes from feldspar-clay micro-regions. Finally, type III, 3:2, secondary needle-like mullite, with a crystal aspect ratio of 30:1–40:1, forms in micro-ternary regions of fine clay, feldspar and quartz. These types were also observed in industrial blends made of 50% kaolinitic clay, 40% feldspar and 10% quartz of porcelain stoneware (Martín-Márquez et al., Reference Martín-Márquez, Rincón and Romero2010).
The appearance of the various phases in industrial porcelains was studied by scanning electron microscopy (SEM; Carty & Senapati, Reference Carty and Senapati1998; Iqbal & Lee, Reference Iqbal and Lee1999, among others). Microstructural features of porcelains are characterized by various fields such as feldspar melts with well-developed, elongate mullite crystals and continuous or discontinuous areas where small mullite crystals were grown from the kaolinite matrix. Large, partially dissolved quartz crystals surrounded by melt were observed, along with relicts of small quartz crystals almost totally dissolved in the melt. Large quartz crystals were usually surrounded by cracks; no cracks were observed in small grains.
The microstructure and improvements in the properties of porcelain have been considered in the past (Iqbal, Reference Iqbal and Lee2000, among others). In these works, analysis of the mullite microstructure was mainly performed by optical microscopy (OM) and SEM. However, powder X-ray diffraction (XRD) is used increasingly for microstructural analysis of materials (e.g. Mitemeijer & Scardi, Reference Mittemeijer and Scardi2013).
Crystallite-size data for mullite in ceramics have been presented in numerous works (Serrano et al., Reference Serrano, Bastida, Amigó and Sanz1996; Sainz et al., Reference Sainz, Serrano, Bastida and Caballero1997, Reference Sainz, Serrano, Amigó, Bastida and Caballero2000; Kojdecki et al., Reference Kojdecki, Serrano, Clausell and Bastida2001). Sanz (Reference Sanz2015) integrated XRD microstructural analysis with OM and SEM studies to establish the microstructural evolution of mullite on triaxial porcelains. The porcelains were produced from three blends that differed only in terms of the nature of one of the triaxial constituents, considering two types of firing cycles (faster and shorter or slower and longer) and four firing temperatures in a restricted industrial range (1270–1340°C). No significant variance was observed for the (110) crystallite size following analysis of the whole set of samples, considering the types of blends and firing cycles as independent variables. However, a preferential elongation was observed when comparing crystallite sizes (with greater sizes for 001 reflections than for 110 reflections) by the Voigt function method (Langford, Reference Langford1978) with greater lengths of prismatic faces measured using electron microscopy.
XRD microstructural analysis by the method of Warren & Averbach (Reference Warren and Averbach1950) using (001) reflection, which involved average crystallite size and size distributions, was used for deducing the crystal-growth mechanisms of phyllosilicates and other minerals with the Mudmaster program (Eberl et al., Reference Eberl, Środoń, Lee, Nadeau and Northrup1987, Reference Eberl, Drits, Środoń and Nüesch1996, Reference Eberl, Drits and Środoń1998; Lanson & Kübler, Reference Lanson and Kübler1994). Mean crystallite sizes obtained from (001) reflections (estimated from XRD patterns by the Voigt function method and by the Warren–Averbach method) were in agreement with measurements of crystallite thickness by electron microscopy (Clausell et al., Reference Clausell, Bastida, Serrano, Pardo and Huertas2007; Pardo et al., Reference Pardo, Bastida, Serrano, Ibañez and Kojdecki2009).
Sainz et al. (Reference Sainz, Serrano, Bastida and Caballero1997) observed simultaneous and parallel growth of crystallites and crystal aggregates during the thermal transformation of kyanite using SEM and XRD microstructural analysis (Voigt function and Warren–Averbach methods). The method of Kojdecki (Reference Kojdecki2004) was used by Sanz et al. (Reference Sanz, Bastida, Kojdecki, Caballero and Serrano2009) for XRD microstructural analysis of mullite developed in the slow and long firing of two triaxial blends with different feldspar raw materials, with or without petalite. Prismatic crystallite was the dominant form, a preferential growth of crystallites was observed when the petalite-bearing blend was used and greater size was detected at higher firing temperatures. The Warren–Averbach method was also used by Sanz et al. (Reference Sanz, Bastida, Kojdecki, Caballero and Serrano2011) for XRD microstructural analysis of mullite in whitewares produced by fast firing of two triaxial blends differing in the particle size of the quartz raw material. Significant differences in the mean crystallite size of mullite were found at temperatures >1320°C for blends with finer quartz particle sizes.
The crystallite size in powder XRD corresponds to the domain size of coherent diffraction and is not directly comparable to crystal size measured by microscopic methods. However, increasing mean volume-weighted (D110) was related to the width of mullite crystals measured by electron microscopy, formed by firing of kyanite at 1350 and 1600°C over long periods (Sainz et al., Reference Sainz, Serrano, Bastida and Caballero1997).
XRD microstructural analysis may provide information on various directions and is particularly useful when a particular direction of diffraction corresponds with the predominant crystal faces. Kaolinite is an excellent example of this case, as mean 001 XRD crystallite sizes are directly comparable (being of a similar order of magnitude) to direct measurements of crystallite thickness performed by SEM (Clausell et al., Reference Clausell, Bastida, Serrano, Pardo and Huertas2007; Pardo et al., Reference Pardo, Bastida, Serrano, Ibañez and Kojdecki2009). However, this approach may not be applied to mullite and thus complementary observations of crystals by electron microscopy are necessary in order to establish a relationship between the growth mechanisms in crystallites and crystals (Sainz et al., Reference Sainz, Serrano, Bastida and Caballero1997; Yoon et al., Reference Yoon, Sarin and Kriven2008). The D110 size is measured in a direction perpendicular to the 110 planes, corresponding to that with the lowest crystal-growth velocity in mullite (Serrano, Reference Serrano, Bastida, Amigó and Sanz1996) and thus it is particularly useful for comparing the crystallite growth achieved by the mullite crystals in various conditions.
The aim of the present work was to study the influence of two different industrial kaolins, which do not influence significantly the chemical composition of the triaxial blend used, in the production of porcelains with respect to the mullite content, the average composition of mullite, the crystallite size using the Warren–Averbach method by analysis of the 110 diffraction direction and the relationship with the width of mullite prismatic faces {110} observed by SEM.
EXPERIMENTAL METHODS FOR MINERALOGICAL AND MICROSTRUCTURAL ANALYSIS
Powder X-ray diffraction
X-ray diffraction patterns were obtained using a Bruker D5005 diffractometer, with a graphite monochromator, using Cu-Kα radiation, a 1° divergence slit, a 1° anti-scatter slit and a 0.5 mm receiving slit, running under the Diffrac-Plus System. Data collection was performed in fast and slow data collection modes. The fast mode was applied in the angular range 2–72°2θ with a scanning step of 0.05°2θ and a 5 s counting time for phase identification, and the slow mode was applied in the ranges 15–18 and 30–33°2θ for selected reflections with a 0.02°2θ step and a 25 s counting time. The slow data collection mode was used for microstructural analysis, calculation of the average mullite composition and semi-quantitative analysis of mullite and quartz in the crystalline fraction of the porcelains.
The programs EVA, MAINT and SEARCH of the Diffrac-Plus System (Bruker AXS) were used for raw data evaluation and processing. Identification was performed on fast XRD patterns using quartz as the internal standard for calibration of angular 2θ positions. The samples (20 g samples of porcelain) were ground using a 100 mL vibrating-cup mill Fritsch Pulverisette 9 with tungsten carbide-coated stainless steel elements (cup, ring and cylinder) for 3 s to obtain fine powder passing through a 230 mesh (ASTM-E11) sieve. The sample holder was filled with the prepared powder avoiding preferential orientation according to Niskanen (Reference Niskanen1964) (see below).
Standard profiles, needed for evaluation of instrumental line broadening in selected X-ray patterns, for XRD microstructural analysis were obtained from pure mullite developed by firing at 1700°C and subsequent removal of the glassy phase by acid leaching (Serrano et al., Reference Serrano, Bastida, Amigó and Sanz1996; Sainz et al., Reference Sainz, Serrano, Bastida and Caballero1997).
Electron microscopy
Images of mullite crystals were obtained using a Hitachi 4100 field emission scanning electron microscope (FESEM) at an accelerating voltage of 30 kV and an extraction potential of 10 kV. Kaolin sample preparation was performed according to Clausell et al. (Reference Clausell, Bastida, Serrano, Pardo and Huertas2007). Thin slides (30 μm thick) of fired porcelains, sectioned with a low-speed saw Buehler IsoMet LS, previously treated with 10% hydrofluoric acid, were placed on the FESEM holder and then coated with Au–Pd using a Struers Epovac device. Digital images were then collected with the aid of the EMIP program (Hitachi).
MATERIALS
Raw materials
The raw materials used were kaolin clays (kaolin B and kaolin M), feldspar flux (S) and quartz (G). The feldspar S (100% <50 μm) comes from Quaternary deposits of silica-feldspar sands in Segovia (Spain) and is K2O-rich. The quartz (G) is an industrial washed sand (100% <50 μm) from Segovia (Spain) with a very low level of impurities.
Kaolin B is sedimentary kaolin (100% <60 μm) from Arguisuelas, Cuenca (Spain) with kaolinite microstructural characteristics similar to that of Poveda de la Sierra, Guadalajara (Spain) (Aparicio & Galán, Reference Aparicio and Galán1999), while kaolin M is an halloysitic industrial kaolin (100% <10 μm) of hydrothermal origin from Matauri Bay, New Zealand (Wilson & Keeling, Reference Wilson and Keeling2016), wet processed and dried to obtain a halloysite content of ~88%. Crystal morphologies of halloysite provide rheological properties different to those of high-quality kaolins made of platy crystals (Clarke, Reference Clarke2008), which affect casting.
Additional details for the raw materials (particle-size distribution, method for chemical analysis by X-ray fluorescence, thermal analysis) and processing can be found in the survey of Sanz (Reference Sanz2015). The mean particle size of kaolin B is 6 μm, while that of kaolin M is 0.3 μm.
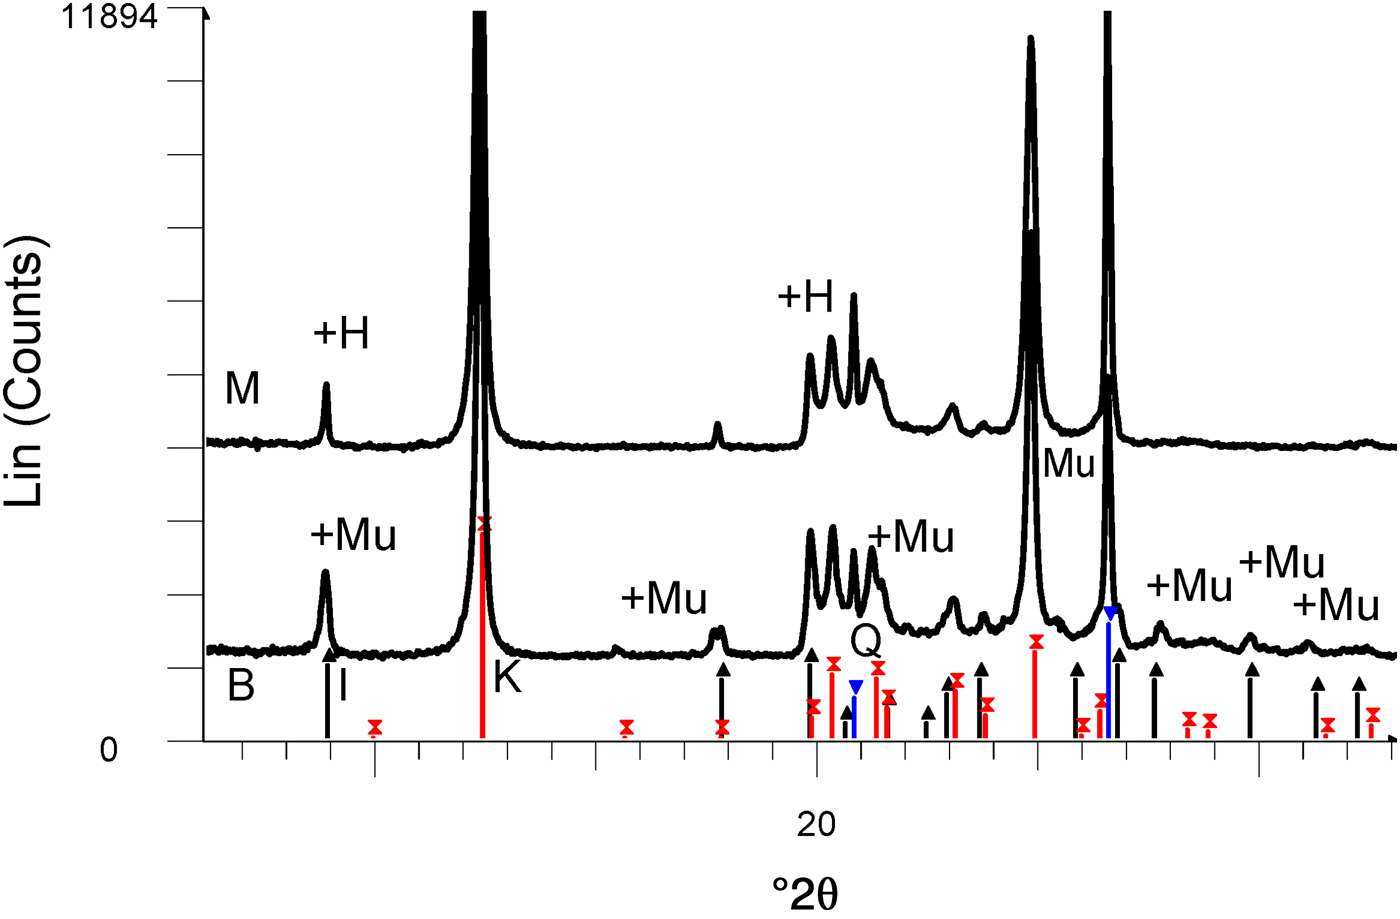
The chemical compositions of kaolin B and kaolin M are listed in Table 1. The kaolins have comparable SiO2, Al2O3 and Na2O contents. Kaolin B is richer in K2O, Fe2O3, CaO and MgO and has a smaller LOI value than kaolin M. These differences in chemical composition are only significant for K2O in the blends studied here (BGS with kaolin B and MGS with kaolin M), as shown below. The greater K2O content in kaolin B is mainly related to the more abundant muscovite (cf. Fig. 2).

Fig. 2. XRD patterns of kaolins M and B. The reflections are labelled to match those in the PDF2 database of the International Centre for Diffraction Data (ICDD): in sample M, there is overlap of the first peaks of halloysite (labelled H) and illite (black lines with upwards-pointing triangles) and coincidence of kaolinite (red lines with crosses) with 7 Å halloysite. There is overlap of muscovite (labelled Mu) and illite in sample B. Quartz peaks are indicated by blue lines with inverted triangles.
Table 1. Chemical analyses of kaolins provided.
LOI = loss on ignition at 1000°C.
The XRD traces of the kaolins are shown in Fig. 2. Kaolin B contains kaolinite and minor illite and quartz, while kaolin M contains a mixture of kaolinite and 7 Å halloysite and minor quartz. The predominant polytype is kaolinite because the ratio of intensities of the peaks at 7.0 and 4.4 Å is ~20 (instead of <2, which is typical of 7 Å halloysite; Brindley, Reference Brindley and Brown1961).
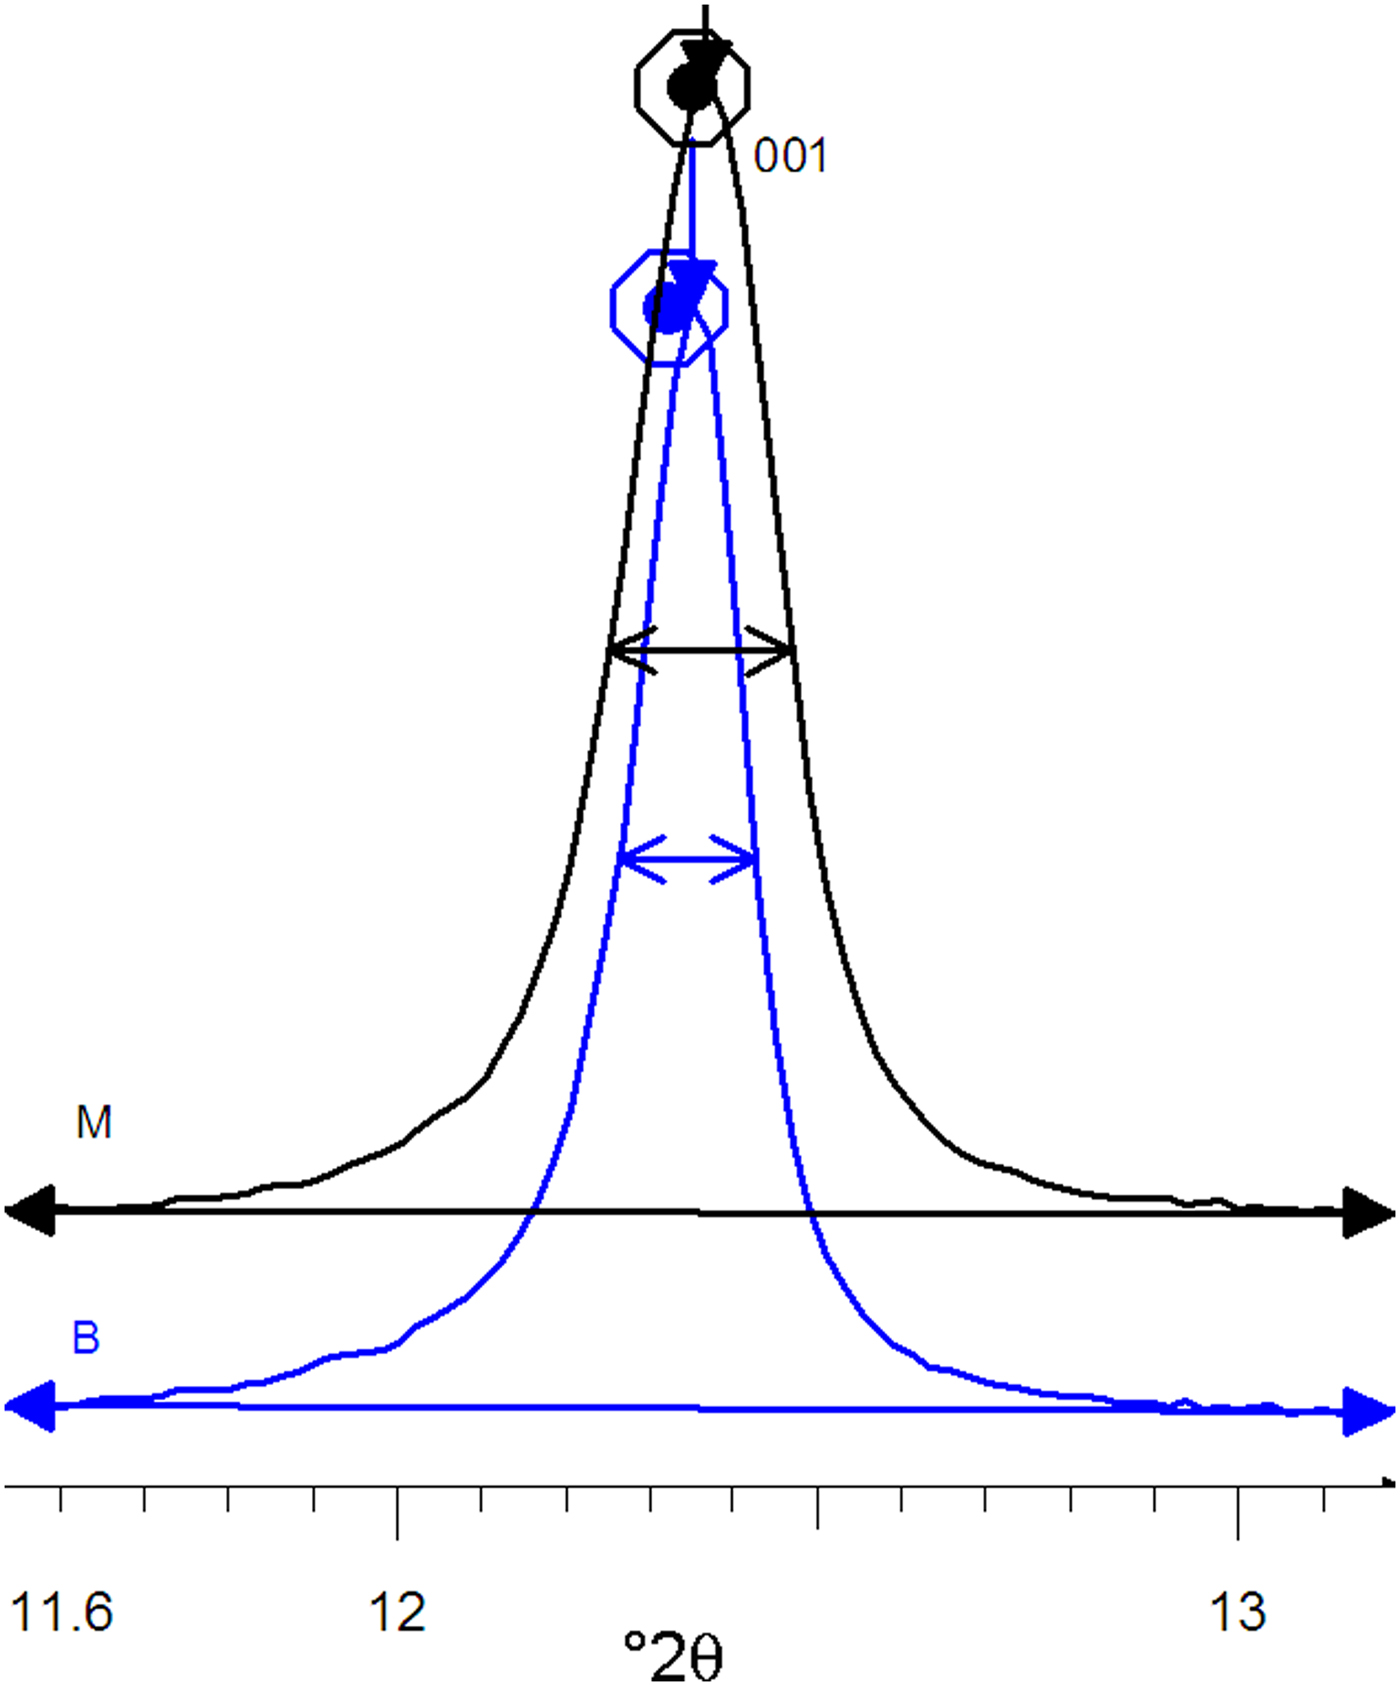
The XRD patterns of kaolins B and M differ mainly in terms of the full width at half maximum (FWHM) of the reflection near 7 Å (which was related to the crystalline thickness in the 001 diffraction direction (Amigó et al., Reference Amigó, Bastida, Sanz, Signes and Serrano1994). Kaolin M has a larger FWHM value than its kaolin B counterpart (0.220° and 0.164°, respectively) in the XRD patterns (Fig. 3), where profiles are represented at normalized height (d 001 spacing of both peaks at 7.16 Å). Both kaolins were recognized by FESEM (see Fig. 4) using the method of Clausell et al. (Reference Clausell, Bastida, Serrano, Pardo and Huertas2007). The predominant particle shape of both kaolins is platy, but in kaolin M, flattened cylinders were also found in which unclosed pores were noted. Note the presence of a flattened pore at the bottom right of Fig. 4a. The statistics of >100 measurements for each type of kaolin particle are included in Table 2.

Fig. 3. Profiles of 001 peaks of the B and M kaolins at normalized height.
Fig. 4. Field emission scanning electron microscopy images. (a) Halloysitic kaolin M. A longitudinal opening along a particle oblique to the plane of the image is indicated by an arrow. (b) Kaolin B. Scale bars: 500 nm.
Table 2. Statistical analysis of >100 FESEM measurements of crystallite thicknesses.
Production of whitewares
The formulation of whitewares consisted of 53% kaolin, 33% feldspar and 14% quartz. Two blends (BGS, MGS) were prepared from the two kaolins (B and M). Both blends were fired in an electric kiln at four different temperatures with fast/short (5°/min up to firing temperature held for 90 min) or slow/long (2°/min up to firing temperature held for 180 min) firing cycles, with subsequent unforced cooling. The samples were labelled by adding R or L to the composition label and adding 1, 2, 3 or 4 according to the firing temperature (1270, 1300, 1320 or 1340°C, respectively). The complete processing route was shown in the survey of Sanz (Reference Sanz2015). The chemical compositions of both blends are shown in Table 3 (data from Sanz, Reference Sanz2015).
Table 3. Chemical compositions (wt.%) of BGS and MGS. One significantly different value is marked in bold. Note that the difference for Na2O + K2O is not significant considering errors.

CALCULATIONS – XRD METHODS
The average Al2O3 content of mullite was estimated from slow XRD patterns by the ratio of intensities of the 220 and 111 reflections (Ban & Okada, Reference Ban and Okada1992). Semi-quantitative analysis of mullite and quartz in the crystalline fraction of the porcelains was performed with the reference intensity method (Davis & Smith, Reference Davis and Smith1989) implemented by the S-Q option of the EVA program (Diffrac-Plus System, Bruker AXS) using the 100 reflection of quartz and the 111 reflection of mullite.
The line-profile analyses of selected reflections of mullite used in the microstructural analysis and in the calculation of the average mullite composition were performed with the program PROFILE available in the software package DIFFRAC-AT (Bruker and Socabim). The experimental profiles were fitted to analytical functions (pseudo-Voigt and split-Pearson VII) after subtraction of an adjusted linear background and taking into account the effect of the Cu-Kα2 component on the experimental profile.
The Warren & Averbach (Reference Warren and Averbach1950) method was applied using the Wincrysize program (Bruker AXS – Sigma-c GmbH software) to obtain area-weighted apparent crystallite size values measured as unit-cell column lengths (L) in the direction perpendicular to the diffraction plane 110 by double-line analysis of the 110 and 220 reflections. The method was described by Sainz et al. (Reference Sainz, Serrano, Bastida and Caballero1997). Relative errors for mean crystallite sizes were determined by the method of Pielaszek et al. (Reference Pielaszek, Łojkowski, Gierlotka and Doyle2006).
RESULTS
X-ray diffraction
Figure 5 shows a set of XRD patterns recorded with fast data collection (BGSL samples). Figure 6 shows sample data for the 110 and 220 diffraction peaks collected using the slow mode, which was used for microstructural analysis (by Warren–Averbach method), as well as of the 220 and 111 diffraction peaks used for estimating average Al2O3 contents in mullite. The ratio of mullite to (quartz + mullite) was determined using 120 and 100 reflections of mullite and quartz, respectively. The small amount of cristobalite present was not considered in the semi-quantitative analysis.
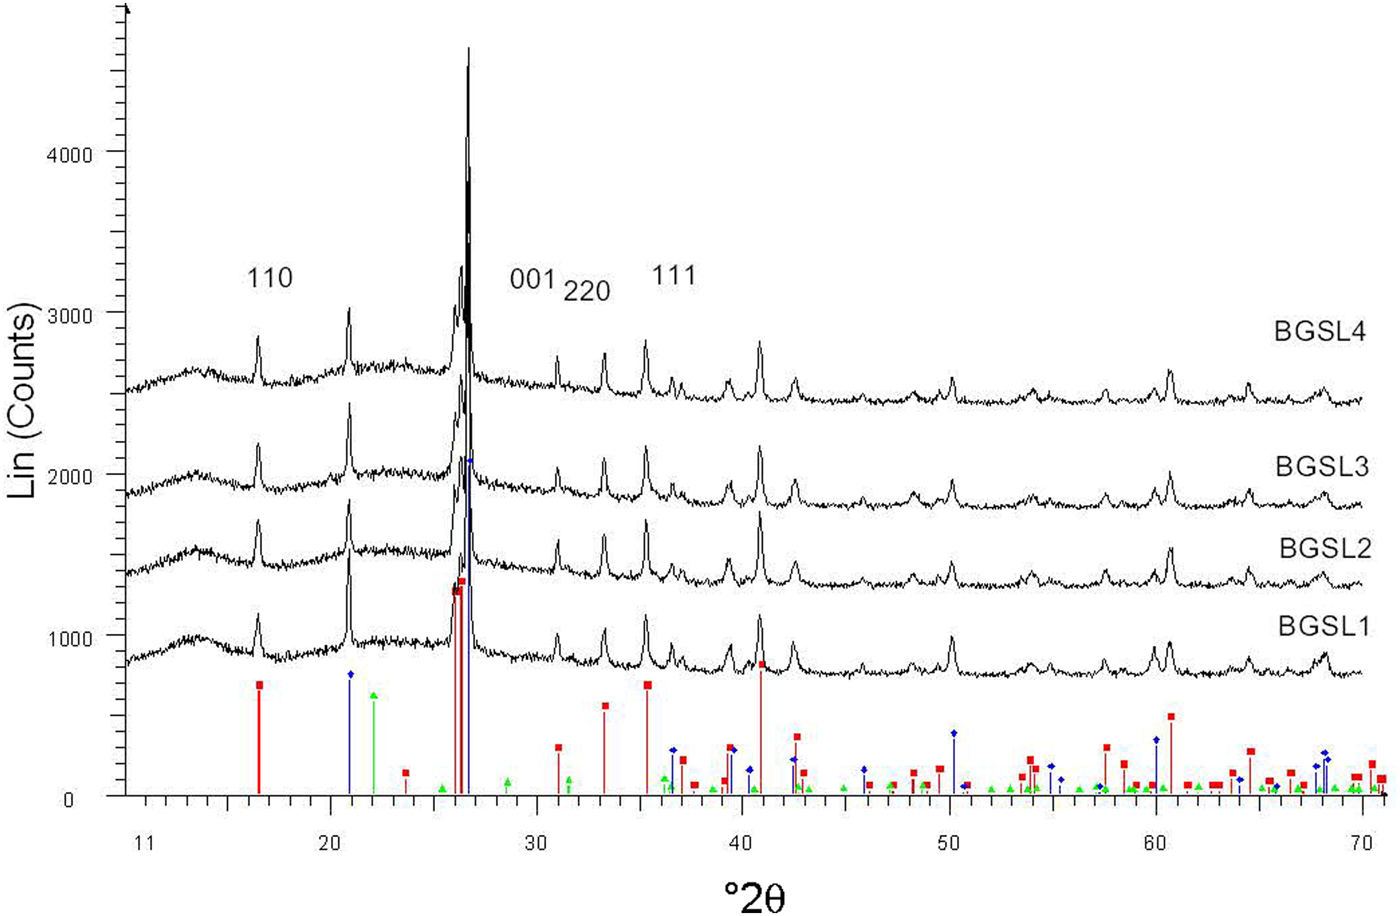
Fig. 5. Examples of XRD patterns collected with the fast mode (BGSL samples). Key to the symbols: mullite (squares), quartz (diamonds), cristobalite (triangles).

Fig. 6. Selected diffraction peaks obtained by slow data collection. The 110 and 220 peaks belong to mullite. The 220 and 111 peaks were used to estimate average Al2O3 content in mullite. The 100 peak of quartz was used as an internal intensity standard of crystalline constituents.
Table 4 lists the average Al2O3 content in mullite and the semi-quantitative analysis of mullite and quartz in the crystalline fraction of the porcelains. The calculated values for Al2O3 content in mullite were very similar and near the stoichiometric 3:2 composition (71.8 wt.% Al2O3), without significant variations considering errors were in the range of 5.7–6.9%. These values were similar to those reported by Serrano et al. (Reference Serrano, Bastida, Amigó and Sanz1996) for mullites formed in stoneware from illite–kaolinite compositions by long firings (50–150 h at 1150°C) of kaolinite KGa-1 of the Source Clays Repository of The Clay Minerals Society and were also similar to sintered mullite compacts fired with a heating rate of 1°/min up to 950°C, then with 5°/min up to 1300°C and held at 1300°C for 30 min from a powdered Malaysian kaolin (Chen et al., Reference Chen, Wang and Hon2004).
Table 4. Al2O3 content in mullite and mullite content in the crystalline fraction of porcelain.
REF = reference of porcelain sample; A = wt.% of Al2O3 in mullite; M = wt.% of mullite in the crystalline fraction of the sample; RER %< = maximum value for relative error in each column.
Figure 7 shows the advance of mullite formation (wt.%) in the crystalline fraction of the samples. A significant increase in mullite content was observed in fast firing of the MGS blend (MGSR samples) with increasing temperature. Similar behaviour was observed in the fast firing of the BGS blend (BGSR samples) at 1300–1340°C. Under slow firing, the increase in mullite content was evident in MGS and BGS blends treated at 1320°C or 1340°C and at 1300°C or 1340°C, respectively. Under the same firing temperature, differences in mullite contents were significant and positive between MGSR and BGSR sets at 1270–1340°C and between BGSL and BGSR sets at 1270–1320°C (no significant differences were found at 1340°C). Negative differences were observed between the MGSL and MGSR sets heated at 1320 and 1340°C.
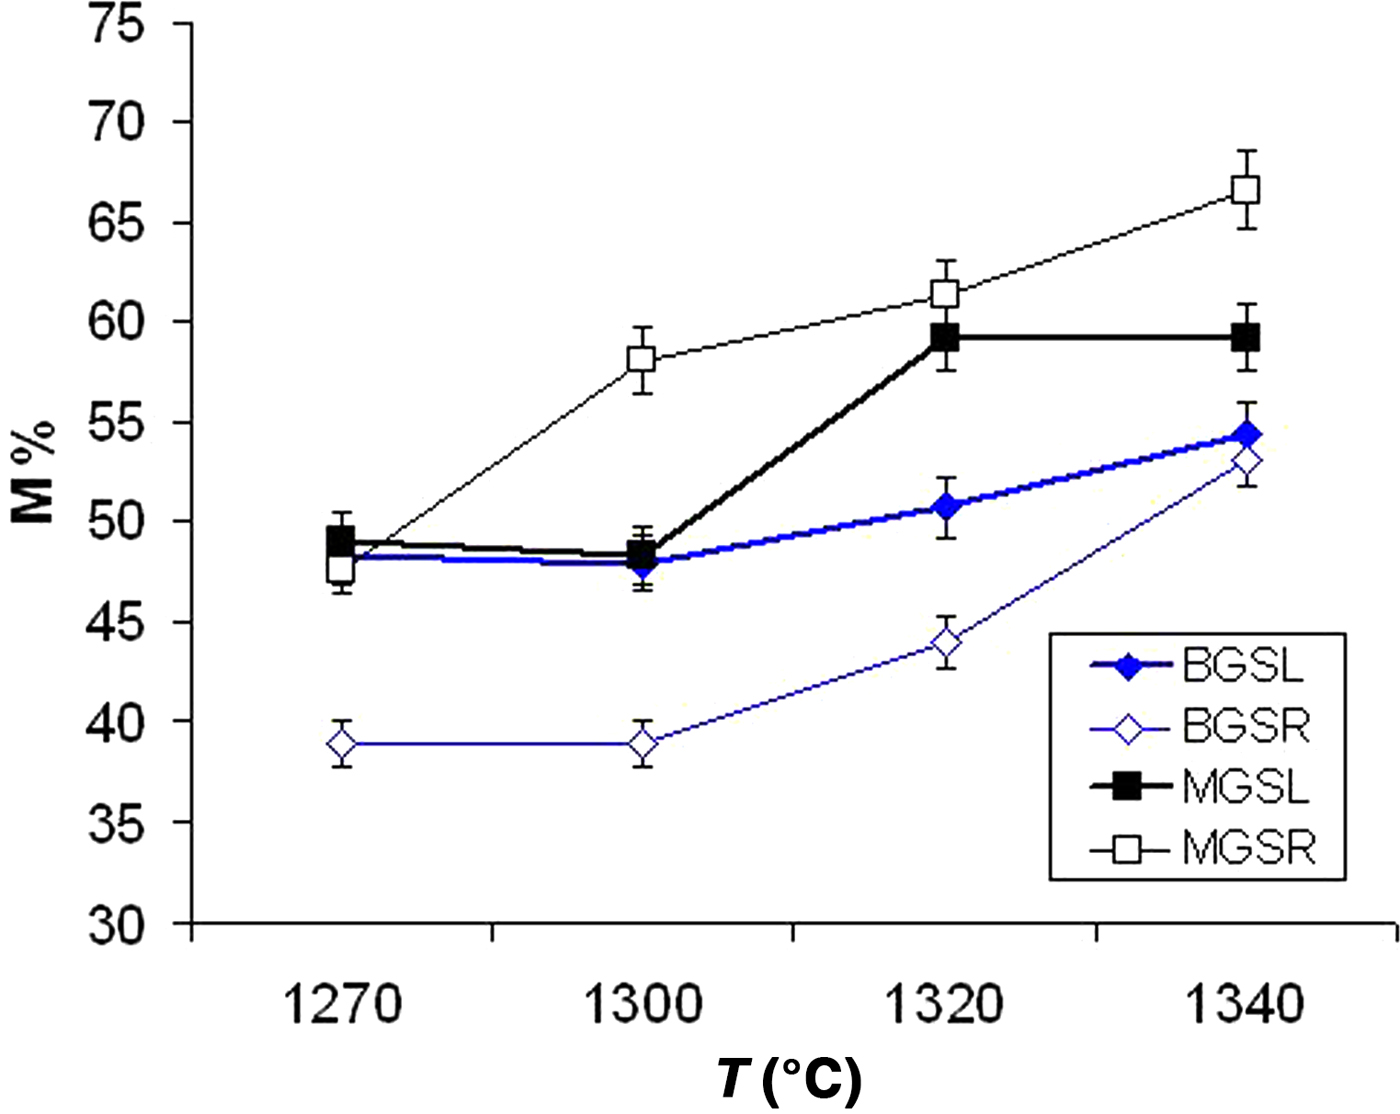
Fig. 7. Mullite content (M%) in the crystalline fraction of the two blends (data from Table 4).
Table 5 lists descriptive parameters of the mullite 110 crystallite size distribution in the samples studied and the fired reference kaolinite GW for comparison (with data from Serrano et al., Reference Serrano, Bastida, Amigó and Sanz1996) calculated using the Warren–Averbach method.
Table 5. Main parameters of size distribution of D110 of mullite for the various firings at various temperatures (°C). MGSL MGSR, BGSL and BGSR correspond to the MGS and BGS blends with long, slow firings (L) and short, fast firings (R). Values in bold represent significant positive differences.

a Lack of significant difference of the property at subsequent temperatures. Mean = mean crystallite size <D110>; Mo-110 = modal value of D110; T (°C) = maximum firing temperature; RER%< = maximum relative error; FWHM = full width at half maximum.
The evolution of mean crystallite size <D100> with firing temperature is shown in Fig. 8. The mean crystal sizes of mullites of the MGS and BGS blends are comparable at 1270 and 1340°C and in slow firing cycles, but significantly positive at 1300°C (very slight) and 1320°C (see also Table 5). Under increasing firing temperature, significantly higher values were only recognized for MGS, at 1320°C under slow firing (Fig. 8a) and also at 1320°C (with no significant difference in value at 1340°C) under fast firing (Fig. 8b), and no significant differences in the cases of the other firings. Figure 9 shows the distributions of crystallite sizes D110 for various sets of samples. In fast firing of the MGS blend, the modal crystallite size value is gradually displaced to larger particle sizes with increasing temperature (Fig. 9b). The FWHM of distribution and the mean <D110> values follow the same trend, reaching a maximum value at 1320°C. The lower modal values of crystallite sizes observed in the BGS2L (1300°C) and BGS3L (1320°C) samples are probably related to artefacts produced by the size-calculation program, as the peak profiles in the XRD traces do not show particular anomalies (cf. Fig. 5).
Fig. 8. Evolution of mean crystallite size <D110> with firing temperature. (a) Slow firing, (b) fast firing. See text for discussion.
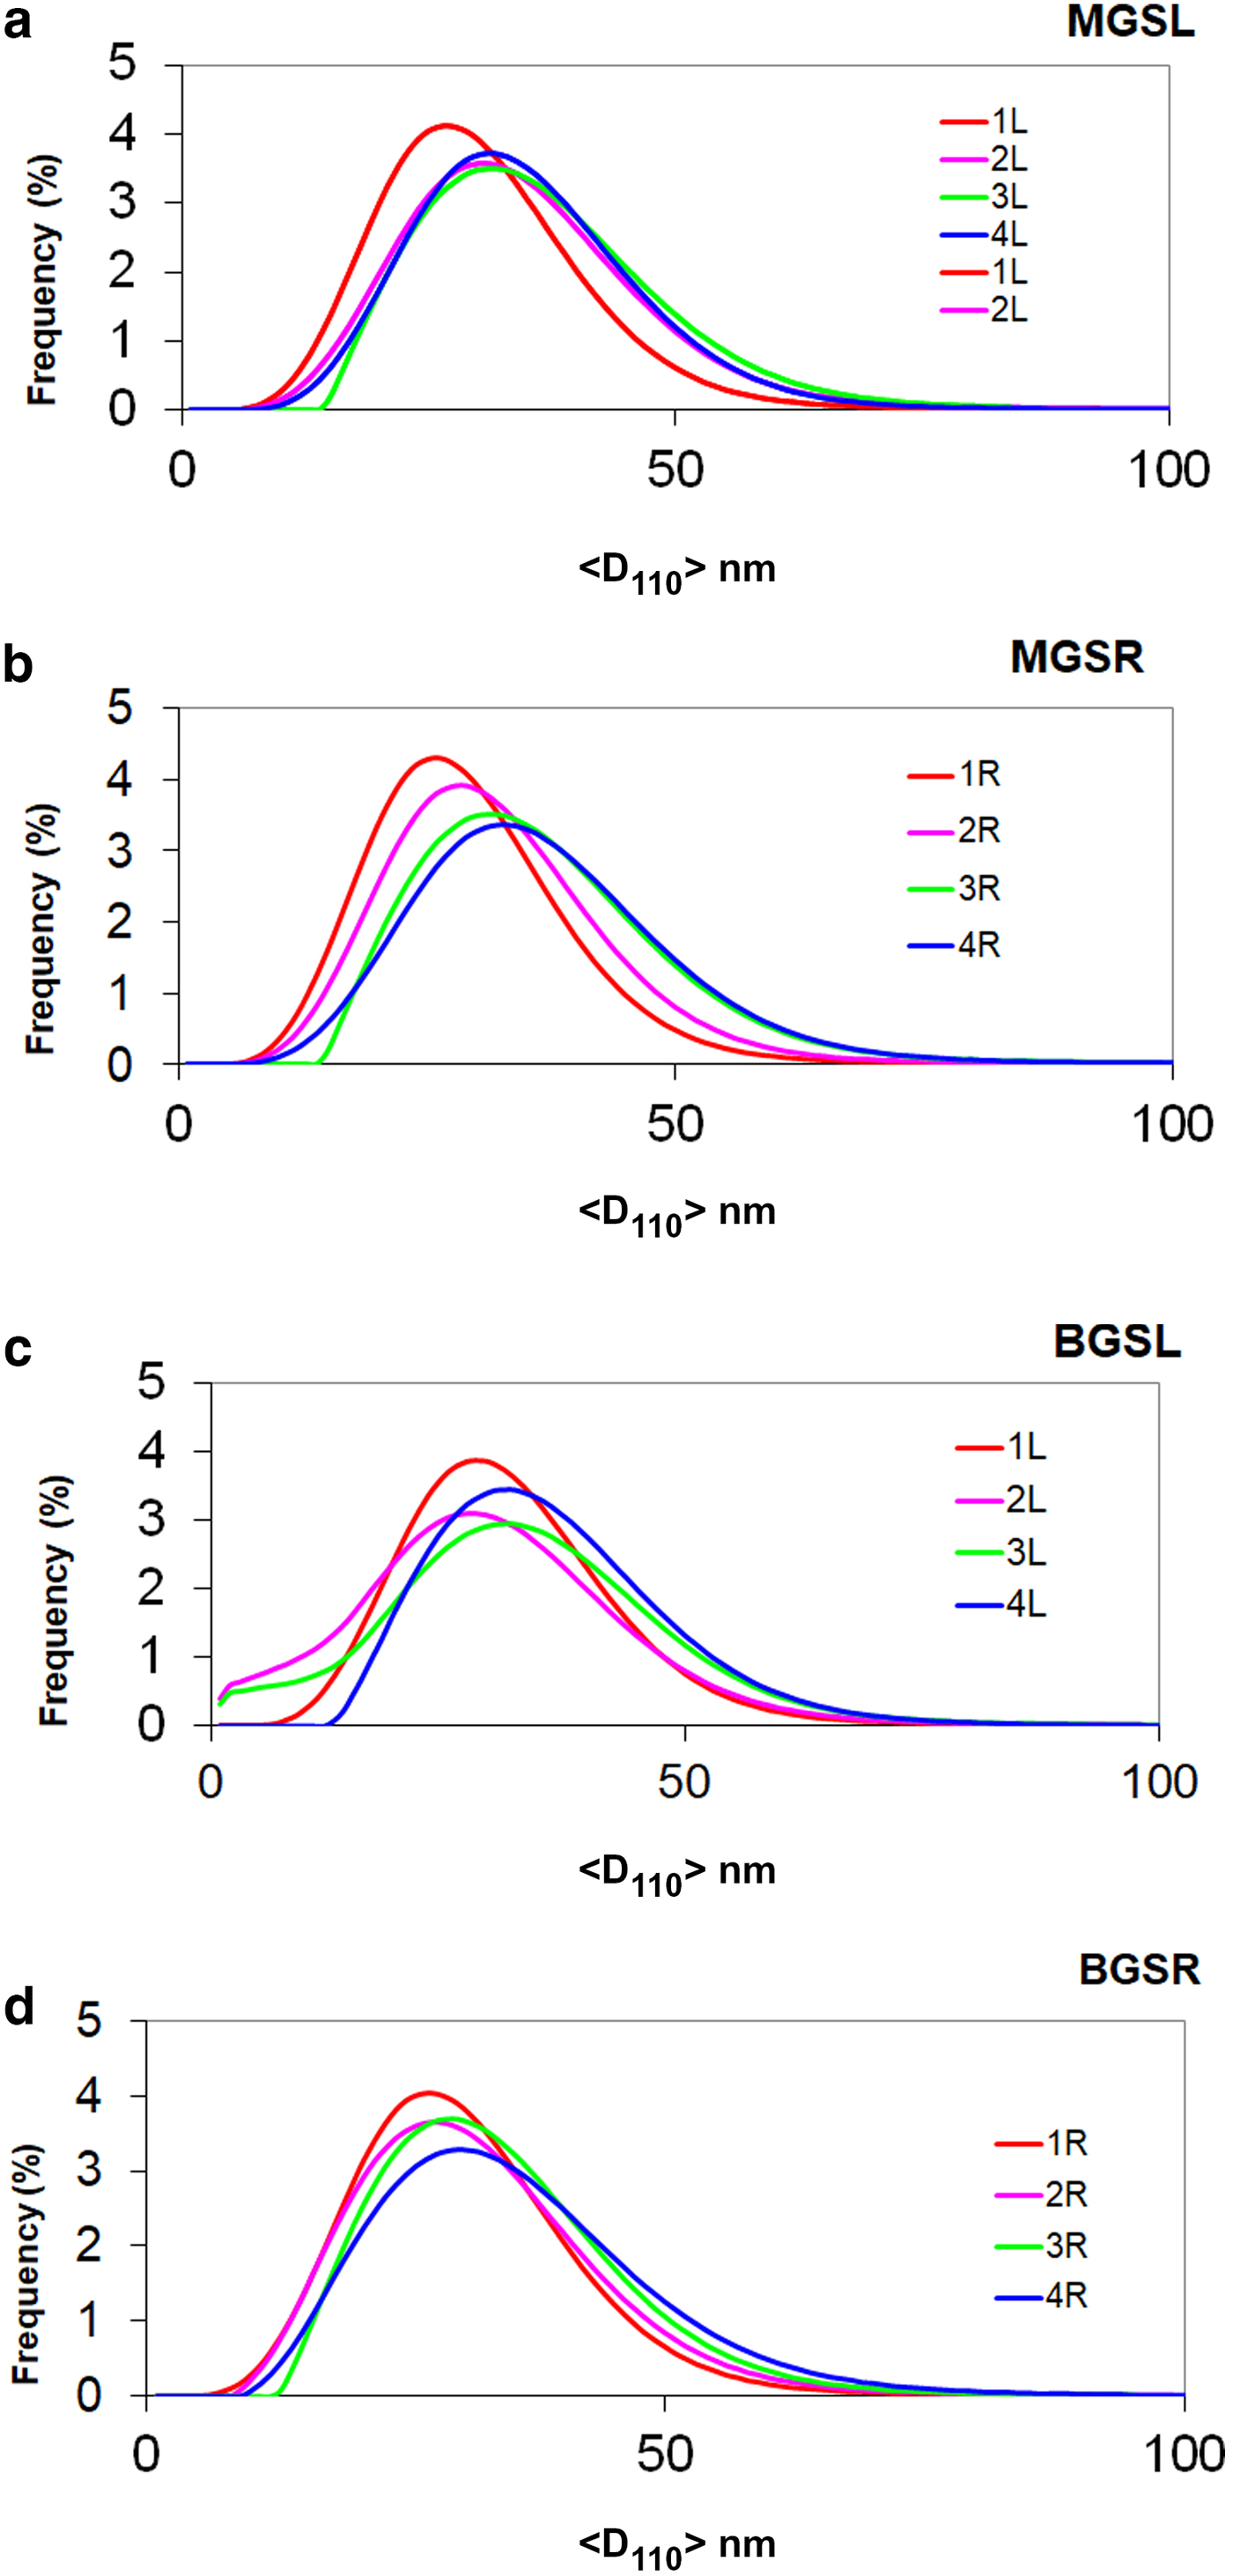
Fig. 9. Frequency of crystallite size distributions (%) vs. size value <D110> (nm). Distributions 1L, 2L, 3L and 4L and 1R, 2R, 3R and 4R correspond to firings at 1270, 1300, 1320 and 1340°C for slow (L) and fast firing cycles (R), respectively. (a) MGSL, (b) MGSR, (c) BGSL and (d) BGSR.
No significant differences in <D110> mean crystallite sizes were observed between slow or fast firings of kaolin B and M blends at any firing temperature. Exceptions are the higher <D110> values in the fast firing at 1320°C of kaolin B and in the slow firing at 1300°C of kaolin M (Table 5). Significant positive differences of mean crystallite sizes <D110> were found for slow firing of blends with kaolin B and kaolin M at any firing temperature, except at 1340°C, in which significant differences were not observed. No significant differences in <D110> were observed in the fast firing cycles of both blends at the same temperature.
Higher modal values of D110 crystallite size were observed at the same firing temperatures in both slow and fast firing cycles in blends with kaolin M (Table 5). No significant differences in modal crystallite sizes of mullite after slow and fast firing were observed for both blends at any temperature, except at 1300°C (slight significant negative difference). However, the differences for both blends at the same temperature were significantly positive, except at 1340°C (no significant difference). Finally, differences in FWHM were only significant above 1320°C in the slow firing of the blend with kaolin B and in the fast firing of the blend with kaolin M.
EVOLUTION OF MICROSTRUCTURE
The maximum sizes observed in the crystals of the porcelains studied were <20 μm, corresponding to partially dissolved quartz grains. Figure 10 shows a contraction crack around a quartz grain also affecting the grain, which is surrounded by a viscous Si-rich melt with tiny mullite grains. The presence of minute mullite grains may account for the bimodal distributions of mullite determined by the Warren–Averbach method in some whiteware porcelains (Sanz, Reference Sanz2015).
Fig. 10. Scanning electron microscopy image of a coarse quartz grain (light grey) with minute mullite grains growing in the dissolved area (MGSL4 sample, polished etched surface). Scale bar: 5 μm.
FESEM microphotographs of the broken surfaces of samples etched chemically with hydrofluoric acid (at 10% in water) are shown in Fig. 11. Table 6 lists comparative statistics of width measurements obtained from >600 measurements from each sample and the mean values (<D110>) of XRD crystallite sizes for the 110 reflection (Table 5). Larger mean widths (MW) of mullite prisms are usually associated with larger values of <D110> although exceptions are observed (e.g. MGS1L and MGSL3). Greater MW/<D110> ratios were observed in the MGS blends.
Fig. 11. SEM images of the etched porcelain samples. (a) MGS1L, (b) MGS3L, (c) MGS1R, (d) MGS3R, (e) BGS1R and (f) BGS3R. Scale bars: (a–d) 250 nm, (e,f) 500 nm.
Table 6. Comparative results of mean values of measured widths (MWs) of mullite prisms and crystallite sizes. MW/D110 values are indicative of the small numbers of crystallites across the prismatic {110} faces of mullite crystals.
W = width; <D110> = mean X-ray diffraction crystallite size. σ = standard deviation of W measurements; MoW = mode of W or W value of maximum frequency; Min W = minimum value of W; Max W = maximum value of W.
Figures 11a and 11b show decreases in the MW and modal width of D110 after slow firing of MGS at 1270 and 1320°C. Figures 11c and 11d show the increase in MW of mullite prisms (cf. Table 6) after fast firing of MGS at 1270 and 1320°C, concurring with significant changes of the <D110> parameter (cf. Table 5). Figures 11c and 11d show the apparent increase in MW from 1270 to 1320°C in fast firing of the MGS blend. Figures 11a and 11c (corresponding to slow and fast firing of the MGS blend at 1270°C, respectively) show the greater value for slow firing at this temperature. Figures 11e and 11f, corresponding to the BGS sample fired at 1270 and 1320°C, also show the increase in MW under fast firing of the BGS blend. An apparent increase in MW of the mullite prism may be observed, which is in agreement with Table 6, concurring with a significant increase in <D110> (Table 5). Note that the widths of mullite prismatic faces may be equidimensional if the faces are perpendicular to the plane of the image.
DISCUSSION
The mullite in the samples studied has similar Al2O3 contents that are close to the stoichiometric composition 3:2 (Table 4), similar to that reported in mullites in stoneware produced from illite–kaolinite compositions and from thermal transformations of kaolins (Serrano et al., Reference Serrano, Bastida, Amigó and Sanz1996) and from sintered mullite at 1300°C (Chen et al., Reference Chen, Wang and Hon2004).
A general trend of increasing mullite content in the crystalline fraction of the porcelains studied with increasing temperature was observed in the temperature range 1300–1340°C (or 1270–1340°C in the BGSL set), but no significant change from 1300 to 1320°C in the MGSR set. In addition, no significant increases were found between 1320 and 1340°C for the MGSL set, nor between 1300 and 1320°C for the BGSL set.
Considering the same firing temperature, significant differences in the mullite contents were observed between the BGSR and BGSL sets (negative, but not significant at 1340°C), and positive differences were observed between the MGSR and MGSL sets (not significant at 1270 and 1340°C). No significant differences were observed in the mean crystallite size <D110> of mullites between the MGS and BGS blends at the same temperature, except for the significant positive differences in slow firing cycles at 1300°C (very slight) and 1320°C. With increasing firing temperature, significantly higher values were observed for MGS at 1320°C in slow firing cycle (Fig. 8a) and at 1320°C in fast firing cycle (Fig. 8b), without significant differences in the remaining sample sets.
No significant differences in modal crystallite size were observed in the different firing sets, but an increase in the FWHM was observed at 1320°C in the MGSR sample sets. This, coupled with greater <D110> mean values, may indicate crystallite growth with increasing temperature, as was clearly displayed by the displacement to the right of the broadened distributions (Fig. 9b). All of the mean obtained <D110> sizes (Table 5) are within the range of grain-width values of sintered mullite at 1300°C measured by transmission electron microscopy (Chen et al., Reference Chen, Wang and Hon2004).
The prevalent forms of mullite crystals are {110} prisms. However, there is not always agreement between the increase of the width of prism faces and that of <D110> values (Table 6) because there is no preferred direction of growth perpendicular to 110 planes. In fact, perpendicular to 110 planes is the direction of slower growth, allowing for greater development of the faces of these prisms (Serrano et al., Reference Serrano, Bastida, Amigó and Sanz1996).
The small number of crystallites in the mean thickness of mullite prisms (MW/<D110> of Table 6) – <4 for the observed MGS samples and <2 for the observed BGS samples – is consistent with the preferred aggregation of crystallites in the [001] direction. This preferred aggregation is related to the preferential elongation of crystals observed by Sanz (Reference Sanz2015) after comparing crystallite size data obtained by the Voigt function method (Langford, Reference Langford1978) with lengths of the prismatic faces. In addition, there is not always agreement between the increase of width of prism faces and that of mean sizes <D110> because the direction perpendicular to 110 planes is not the preferred direction for growth.
The chemical compositions of the kaolins B and M used do not affect significantly the chemical compositions of the blends studied for the system SiO2 – Al2O3 – (K2O + Na2O). The two kaolins differ mainly in terms of particle size (smaller in kaolin M) and the mineralogical features of the kaolin-group minerals, consisting mainly in kaolin M of kaolinite platelets and 7 Å halloysite (as laths and flattened, open cylinders), whereas kaolin B is made up mainly of thicker hexagonal platelets of kaolinite. In addition, the FWHM of the 7 Å reflection (which was related to the crystallite thickness in the 001 diffraction direction by Amigó et al., 2001) is less (thicker) in kaolin B. Hence, the porcelain samples studied show no differences in the average mullite composition, which was near to a 3:2 stoichiometric composition.
CONCLUSIONS
There is a general trend of increasing mullite content in the crystalline fraction of the porcelains produced after faster firing in both blends. Differences in mullite content between the fast and slow firing of porcelain obtained at the same temperature were mainly negative using kaolin B, but positive using kaolin M.
No significant changes in the average Al2O3 contents of the mullites produced were observed. The composition of the mullites approaches the stoichiometric composition 3:2, similar to that of mullite in stoneware produced from illite–kaolinite compositions, from thermal transformations of kaolin and from sintered mullite at temperatures of ~1300°C.
Significant negative differences of <D110> mean crystallite size of mullite were observed at 1320 and 1340°C between blends with B or M kaolins in slow firing cycles. In contrast, no significant differences were observed in the fast firing cycles.
The compositions of the kaolins B and M used do not affect significantly the chemical compositions of the blends studied, and thus the differences observed in the evolution of 110 mullite crystallite growing should be related to the main particle size features of the kaolins used. Kaolin B has a larger particle size and larger crystallite thickness in the 001 direction of kaolinite platelets. In contrast, the kaolinite in kaolin M has a much smaller particle size and smaller crystallite thickness in the 001 direction.
The slow firing of the blend with kaolin M at 1320°C was optimal as it yielded a greater mullite content in the crystalline fraction and a larger mean crystallite size <D110> of mullite.
Although the 110 reflection corresponds to the direction of smaller crystalline growth, the Warren–Averbach method was useful for showing small differences in crystallite-size distributions of mullite along the 110 direction in the studied porcelains. These differences are related to mullite crystallite growth observed in firings of the same blend at 1320 or 1340°C, mainly for the mean crystallite size, and ultimately for the FWHM (in the slow firing of both blends and in fast firings of the blend with kaolin M). No significant differences in the <D110> mean crystallite sizes of mullites were observed between the MGS and BGS blends at the same temperature in the fast firing cycles, but significant positive differences in slow firing at 1300°C (very slight) and 1320°C were noted. With rising firing temperatures, significantly higher values were observed only for MGS at 1320°C in the slow firing cycle.
Small apparent numbers of crystallites were recorded across the measured prismatic {110} mullite faces. There was not always agreement between the increase in the mean thickness of the mullite prism faces and that of mean crystallite sizes because the direction perpendicular to 110 planes is not preferred for aggregation of mullite crystallites.
ACKNOWLEDGMENTS
This work was funded by CICYT (Spanish Government). The authors acknowledge the assistance of the reviewers and of the Associate, Principal and Production Editors.