


INTRODUCTION
Permafrost as perennially frozen ground is climate-controlled in formation, distribution, and properties, which makes it sensitive to climate variations (e.g., Chadburn et al., Reference Chadburn, Burke, Cox, Friedlingstein, Hugelius and Westermann2017). Annual mean air temperatures below 0°C and freezing periods that exceed thawing periods generally induce downward freezing and persistent frozen state of loose deposits and bedrock in nonglaciated regions. Permafrost distribution on Earth closely relates to late Quaternary climate history. In general, glacial periods promoted permafrost aggradation and ground ice formation in unglaciated regions (Tarasov and Peltier, Reference Tarasov and Peltier2007; Willeit and Ganopolski, Reference Willeit and Ganopolski2015), while interglacial periods triggered intense permafrost thaw and ground-ice melt.
Ground freezing synchronous with ongoing sedimentation is termed as syngenetic, whereas epigenetic freezing occurs in preexisting deposits (Romanovskii, Reference Romanovskii1993). Syngenetic ice-wedge (IW) polygons are typical landforms in past and modern tundra environments. Very ice-rich deposits intersected by syngenetic IWs built up Ice Complex (IC) (Ledovyi kompleks – Ледовый комплекс; Solov'ev, Reference Solov'ev1959) strata during stadial and interstadial stages of the mid- and late Pleistocene (e.g., Konishchev, Reference Konishchev2013) reaching up to several decameters thickness (Schirrmeister et al., Reference Schirrmeister, Kunitsky, Grosse, Wetterich, Meyer, Schwamborn, Babiy, Derevyagin and Siegert2011) and extending across Beringia. The most prominent IC of Marine Oxygen Isotope Stage (MIS) 3 to MIS 2 age is termed the Yedoma IC (Tumskoy, Reference Tumskoy2012) and covered an area of at least 1,387,000 km2 on unglaciated Beringian lowlands (Strauss et al., Reference Strauss, Schirrmeister, Grosse, Wetterich, Ulrich and Hubberten2013). Despite their formation during different periods, the ICs share common characteristics. Those are the presence of fine-grained sediments with considerable amounts of intrasedimental ice that exceeds the total pore volume of the ground (excess ice) and of organic material, which accumulated in former polygon centers (Schirrmeister et al., Reference Schirrmeister, Froese, Tumskoy, Grosse, Wetterich and Elias2013). The minerogenic parts of former polygons are intersected by syngenetic wedge ice that developed below the former polygon rims by repeated wintertime frost cracking of the ground and springtime meltwater infill that refroze in vertical ice veins (Leffingwell, Reference Leffingwell1915). Thus, IC strata developed by ongoing sedimentation and wedge-ice growth in poorly drained accumulation areas during different periods of the late Quaternary and preserve traces of tundra-steppe environments in nonglaciated Beringia (Solov'ev, Reference Solov'ev1959).
The general climate-driven pattern of cold-stage IC permafrost accretion and warm-stage IC permafrost degradation (i.e., thermokarst) provides, however, only a first-order approximation in understanding past permafrost dynamics. Besides long-term freezing conditions, thin snow cover allowing for deep ground freezing and frost cracking, but also providing sufficient snowmelt for IW formation, and low deposition rates, were required to create ice-rich permafrost of the IC type. IC dynamics are furthermore altered by second-order controls such as on-site conditions in water and sediment supply, relief, and vegetation, which promote either aggradation or degradation processes (Shur and Jorgenson, Reference Shur and Jorgenson2007).
The sedimentary, paleontological, and ground-ice inventories of IC strata preserve past climate and environmental proxy data and allow differentiating stadial and interstadial stages of glacial periods. Syngenetic IW growth in developing polygon tundra is not limited to cold glacial conditions but may take place also during colder interglacial periods. For example, late Holocene palustrine deposits with syngenetic IWs above lacustrine and taberal deposits of drained thermokarst lake basins are common (Wetterich et al., Reference Wetterich, Schirrmeister, Andreev, Pudenz, Plessen, Meyer and Kunitsky2009; Opel et al., Reference Opel, Dereviagin, Meyer, Schirrmeister and Wetterich2011). These deposits are referred in Russian terminology to the Alas Complex (Alasnyi kompleks – Аласный комплекс; Kaplina, Reference Kaplina2009, Reference Kaplina2011).
Warm periods with intense thermokarst commonly overprinted or even erased older (ice-rich) formations and formed a small-scale landscape mosaic of lakes, wetlands, and remnant hills of older permafrost formations (Kienast et al., Reference Kienast, Wetterich, Kuzmina, Schirrmeister, Andreev, Tarasov, Nazarova, Kossler, Frolova and Kunitsky2011). Thus, thermokarst of the last interglacial period is one of the reasons for rarity and poor preservation of older ice-rich permafrost in Beringia. However, there are cases where ice-rich permafrost can survive through interglacial conditions known from eastern Beringia (e.g., Froese et al., Reference Froese, Westgate, Reyes, Enkin and Preece2008; Reyes et al., Reference Reyes, Froese and Jensen2010). In western Beringia, IC remnants predating the last interglacial period are described in the Indigirka Lowland (Achchagyi-Allaikha site; Nikolskiy et al., Reference Nikolskiy, Basilyan, Sulerzhitsky and Pitulko2010; Kaplina, Reference Kaplina2011), in the Yana Uplands (Batagay megaslump; Ashastina et al., Reference Ashastina, Schirrmeister, Fuchs and Kienast2017; Murton et al., Reference Murton, Edwards, Lozhkin, Anderson, Savvinov, Bakulina and Bondarenko2017), and at both sides of the Dmitry Laptev Strait (Cape Svyatoi Nos on the mainland coast: Nikolskiy and Basilyan, Reference Nikolskiy, Basilyan, Nikolskiy and Pitul'ko2004; and Bol'shoy Lyakhovsky Island of the New Siberian Archipelago: Schirrmeister et al., Reference Schirrmeister, Oezen and Geyh2002) (Fig. 1). The latter surviving IC is examined in this study and called Yukagir IC in regional stratigraphy (Nikolskiy and Basilyan, Reference Nikolskiy, Basilyan, Nikolskiy and Pitul'ko2004; Tumskoy, Reference Tumskoy2012). The impact of the last interglacial warming on preexisting ice-rich permafrost such as the Yukagir IC is rarely studied, but of interest concerning recent warming of the Arctic and potentially indicative of the interplay between past climate and permafrost settings.

Figure 1. Study region in northeastern Siberia showing locations of Ice Complexes (ICs) predating the last interglacial period (indicated by blue dots) (i.e., the southern coast of Bol'shoy Lyakhovsky Island, the Oyogos mainland coast and Cape Svyatoi Nos at the Dmitry Laptev Strait, the Batagay megaslump in the Yana Upland, and the Achchagyi-Allaikha site in the Indigirka lowland) (a) and the southern coastline of Bol'shoy Lyakhovsky Island at the Dmitry Laptev Strait between the Zimov'e River mouth and Cape Kamenniy Mys' where the Yukagir IC was studied in several profiles (indicated by green dots) (b). Background: pan-sharpened GeoEye image, August 11, 2013.
The study aims are the following: (1) providing, for the first time, cryolithologic and extended paleontological proxy data of the Yukagir IC and its stratigraphic context on Bol'shoy Lyakhovsky Island; (2) presenting new radioisotope disequilibria (230Th/U) ages of the Yukagir IC peat; (3) reconstructing the circumstances of Yukagir IC formation before, and its preservation during and after, the last interglacial period; (4) comparing the main characteristics of the Yukagir IC of MIS 7 age to those of studied IC strata of MIS 5 (Buchchagy IC: Wetterich et al., Reference Wetterich, Tumskoy, Rudaya, Kuznetsov, Maksimov, Opel, Meyer, Andreev and Schirrmeister2016), MIS 3 (Molotkov-Yedoma IC: Wetterich et al., Reference Wetterich, Tumskoy, Rudaya, Andreev, Opel, Meyer and Schirrmeister2014) and MIS 2 (Sartan-Yedoma IC: Wetterich et al., Reference Wetterich, Rudaya, Tumskoy, Andreev, Opel, Schirrmeister and Meyer2011) ages; and (5) discussing the paleoenvironmental conditions that maintained IC formation during different periods of the late Quaternary.
STRATIGRAPHIC CONTEXT OF THE YUKAGIR IC
The studied Yukagir IC is exposed on the southern coast of Bol'shoy Lyakhovsky Island (New Siberian Archipelago; Figs. 1 and 2) and was subject to previous studies in terms of geochronology (Schirrmeister et al., Reference Schirrmeister, Oezen and Geyh2002; Table 1) and paleoecology (Andreev et al., Reference Andreev, Grosse, Schirrmeister, Kuzmina, Novenko and Bobrov2004; Reference Andreev, Schirrmeister, Tarasov, Ganopolski, Brovkin, Siegert, Wetterich and Hubberten2011). The stratigraphy is discussed subsequently from oldest to youngest and illustrated schematically in Figure 2.
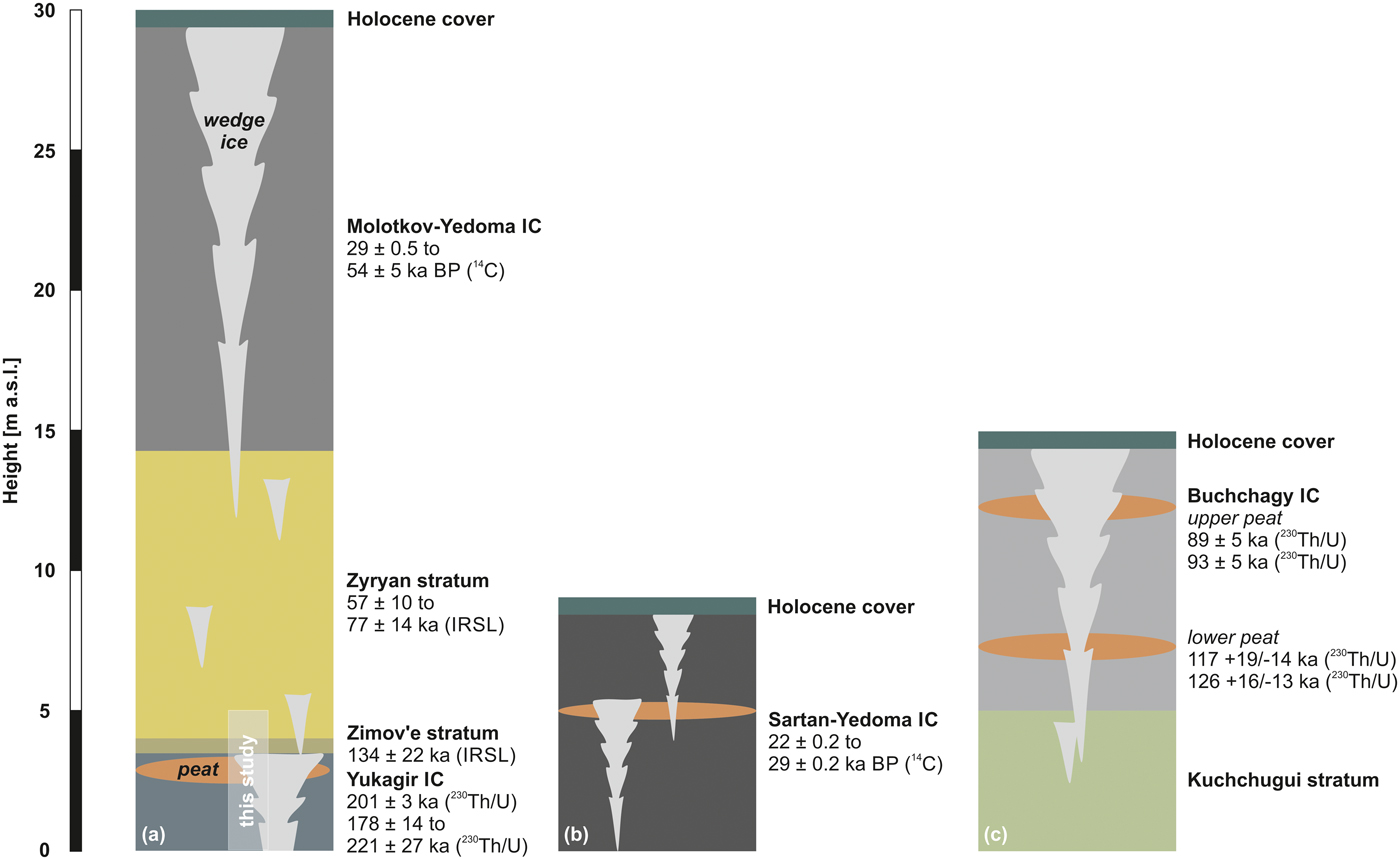
Figure 2. Simplified stratigraphic schemes at the southern coast of Bol'shoy Lyakhovsky Island: (a) Profiles L7-01, L7-02, L7-03, and L7-05 of the Yukagir Ice Complex (IC) and overlying strata (this study) below the Molotkov-Yedoma IC (profile L7-18; Wetterich et al., Reference Wetterich, Tumskoy, Rudaya, Andreev, Opel, Meyer and Schirrmeister2014). (b) Profile L7-07 of the Sartan-Yedoma IC (Wetterich et al., Reference Wetterich, Rudaya, Tumskoy, Andreev, Opel, Schirrmeister and Meyer2011). (c) Profile L7-15 of the Buchchagy IC (Wetterich et al., Reference Wetterich, Tumskoy, Rudaya, Kuznetsov, Maksimov, Opel, Meyer, Andreev and Schirrmeister2016). More profile details of this study are given in Figure 3. Dating results and references are given in Table 1. IRSL, infrared-stimulated luminescence; m asl, meters above sea level.
Table 1. Summary of available chronostratigraphic information for strata predating the Marine Oxygen Isotope Stage (MIS) 3 Molotkov-Yedoma Ice Complex at the coasts of the Dmitry Laptev Strait. IRSL, infrared-stimulated luminescence; L/L, acidic extraction of the sampled material in leachate alone; TSD, total sample dissolution.

The Yukagir IC is underlain by bedrock at beach level and reaches a thickness of up to 4 m above sea level (m asl) (Fig. 2). It is characterized by syngenetic IWs up to 3 m wide and with 12–15 m distance between former polygon centers. Silt and sandy silt enclose gravel in the lowermost minerogenic horizon of the Yukagir IC and show lenticular and reticulate cryostructures (Andreev et al., Reference Andreev, Grosse, Schirrmeister, Kuzmina, Novenko and Bobrov2004; Blinov et al., Reference Blinov, Alfimov, Beer, Gilichinsky, Schirrmeister, Kholodov, Nikolskiy, Opel, Tikhomirov and Wetterich2009). The Yukagir IC minerogenic horizon revealed reversed magnetized material and has therefore been ascribed to the Biwa I reversal event (ca. 189–179 ka; Andreev et al., Reference Andreev, Grosse, Schirrmeister, Kuzmina, Novenko and Bobrov2004) by paleomagnetic analysis. The Yukagir IC peat of Bol'shoy Lyakhovsky Island was 230Th/U-dated to 200.9 ± 3.4 ka (Schirrmeister et al., Reference Schirrmeister, Oezen and Geyh2002). Silty deposits of the Zimov'e stratum (0.4–0.6 m thick) discordantly cover the Yukagir IC (Fig. 2). Deposits of the Zimov'e stratum are strongly cryoturbated and therefore interpreted as a paleoactive layer. Pebbles of 5–10 mm in size are common. No cryostructures are obvious. The Zimov'e stratum is infrared-stimulated luminescence (IRSL)-dated to 134 ± 22 ka (Andreev et al., Reference Andreev, Grosse, Schirrmeister, Kuzmina, Novenko and Bobrov2004; Table 1). Cover deposits of the Zimov'e stratum are attributed to the Zyryan stratum (Fig. 2), IRSL-dated from 77 ± 14 to 57 ± 10 ka (unit IV in Andreev et al., Reference Andreev, Grosse, Schirrmeister, Kuzmina, Novenko and Bobrov2004; Schennen et al., Reference Schennen, Tronicke, Wetterich, Allroggen, Schwamborn and Schirrmeister2016; Table 1). Ice-poor partly laminated silts and sandy silts enclosing numerous in situ grass roots and without visible cryostructures reach thicknesses between 3–4 and 14–15 m. These deposits are interpreted as floodplain sediments (Andreev et al., Reference Andreev, Grosse, Schirrmeister, Kuzmina, Novenko and Bobrov2004). Small truncated epigenetic IWs (up to 0.2 m wide) occur. Syngenetic ice and composite wedges (up to 1.5 m wide) are found in the lower and middle parts, whereas in the upper part syngenetic IWs of the overlying Molotkov-Yedoma IC penetrate 3–5 m deep into the Zyryan deposits (Fig. 2).
MATERIAL AND METHODS
Sediment and ground ice analyses
To obtain material for cryolithologic analyses and dating, the site was sampled in 2007 in profiles L7-01, L7-03, and L7-05 (Fig. 3; Schirrmeister et al., Reference Schirrmeister, Wetterich, Tumskoy and Dobrynin2008). Cryostructures of intrasedimental ice were described following French and Shur (Reference French and Shur2010). Further material from Yukagir IWs was retrieved from profiles L7-01 and L7-02 (Fig. 3). Sample material for 230Th/U-dating of the Yukagir IC was obtained during fieldwork in 2014 in profiles L14-10 and L14-11 at the location of profile L7-01 (Fig. 1; Fuchs et al., Reference Fuchs, Schwamborn, Walz and Wetterich2015). Profile coordinates are given in Supplementary Table 1. The gravimetric ice content was measured as the weight difference between fresh and oven-dried bulk samples, given as a weight percentage (wt%). The grain-size distribution in sediment samples was measured with a laser particle-size analyzer (Coulter LS 200) according to EN ISO 14688 after removal of organic matter (OM) with 30% H2O2. Grain-size data were computed with GRADISTAT 4.0 software (Blott and Pye, Reference Blott and Pye2001). Bartington MS2 instruments equipped with the MS2B sensor type were employed for mass-specific magnetic susceptibility (MS) measurements, given in SI units as 10−8 m3/kg SI units (Le Système International d'Unités). Total nitrogen (TN), total carbon (TC), and total organic carbon (TOC) contents were measured on freeze-dried and powdered bulk samples with elemental analyzers (ElementarVario EL III for TC and TN, and ElementarVario MAX C for TOC; analytical accuracy ± 0.1 wt%). Prior to measurements of TOC, samples were decalcified for 3 h at 95°C by adding a surplus of 1.3 N HCl. TN, TC, and TOC values are given as weight percentage (wt%). The ratio of TOC and TN is referred to as C/N. The carbon stable isotope (δ13C) composition of TOC was analyzed with a Finnigan MAT Delta-S mass spectrometer equipped with a FLASH elemental analyzer and a CONFLO III gas mixing analyzer; 1σ ± 0.15‰. The δ13C is given in per mil (‰) difference to the Vienna Pee Dee belemnite standard. The oxygen (δ18O) and hydrogen (δD) stable-isotope composition of ground ice (intrasedimental ice and wedge ice) was analyzed with a Finnigan MAT Delta-S mass spectrometer; 1σ is better than 0.1‰ for δ18O and 0.8‰ for δD (Meyer et al., Reference Meyer, Schönicke, Wand, Hubberten and Friedrichsen2000). Prior to analysis, the samples were cool stored in 30 ml narrow-neck plastic bottles without air in the headspace. No evidence of evaporative loss was observed in the data. The δ18O and δD values are given as per mil (‰) difference to the Vienna Standard Mean Ocean Water standard. The deuterium excess (d) is calculated as d = δD – 8δ18O (Dansgaard, Reference Dansgaard1964).

Figure 3. Photographs of exposures sampled in 2007 at the southern coast of Bol'shoy Lyakhovsky Island showing reticulate cryostructures of the Yukagir Ice Complex sediment in profile L7-03 (a) and overview and sampling positions of profile L7-03 (b), of profile L7-01 (c, d), of profile L7-05 (e), and of profile L7-02 (f). m asl, meters above sea level.
Radioisotope dating
Radiochemical analyses of 230Th/U disequilibria were performed on two samples from Yukagir IC peat (sample codes L14-10 and L14-11) using Alpha Spectrometry at the Laboratory of Geomorphology and Palaeogeography of Polar Regions and the World Ocean (KÖPPEN-Lab, St. Petersburg State University, Russia). Details of laboratory procedures and sample processing are given in Maksimov and Kuznetsov (Reference Maksimov and Kuznetsov2010), Maksimov et al. (Reference Maksimov, Kuznetsov, Zaretskaya, Subetto, Shebotinov and Zherebtsov2011), and Kuznetsov and Maksimov (Reference Kuznetsov and Maksimov2012). Specific activities of 238U, 234U, 232Th, and 230Th isotopes, and their activity ratios (ARs), were determined by α-spectrometric measurements of the U and Th isotopes (Supplementary Table 2). Analytical data of 10 subsamples from L14-10 and 12 subsamples from L14-11 were combined for the applied isochron approach. To enhance the precision and reliability of the radioisotope dating, the same coeval subsamples were analyzed by two analytical techniques based (1) on acidic extraction of the sampled material in leachate alone (L/L) and (2) on total sample dissolution (TSD) following Maksimov and Kuznetsov (Reference Maksimov and Kuznetsov2010). The isochron approximation relies on agreement with isochron-corrected ages produced by the two-technique approach. The best-fit data of eight subsamples per technique from combined L14-10 and L14-11 material were used to deduce the age information. The 230Th/U ages of the samples were calculated with standard deviation error±1σ according to the isochron approximation (Geyh, Reference Geyh2001; Geyh and Müller, Reference Geyh and Müller2005), applying the equation proposed by Kaufman and Broecker (Reference Kaufman and Broecker1965).
Paleoecological analyses
A total of 9 samples from profile L7-01, 7 samples from L7-03, and 14 samples from profile L7-05, each consisting of 1–4 g of dry sediment, were treated for pollen analysis using standard procedures (cf. Faegri and Iversen, Reference Fægri and Iversen1989). One Lycopodium spore tablet was added to each sample in order to calculate total pollen and spore concentrations (cf. Stockmarr, Reference Stockmarr1971). Pollen and spore residues mounted in glycerin were analyzed under a light microscope (Zeiss AxioImager D2) at 400× magnification. Identification of pollen and spores was performed using a reference pollen collection and pollen atlases (Kuprianova and Alyoshina, Reference Kuprianova and Alyoshina1972; Beug, Reference Beug2004). Nonpollen palynomorphs were identified following van Geel (Reference van Geel, Smol, Birks and Last2001). Percentages of all taxa were calculated based on setting the total of all pollen and spore taxa equal to 100% (excluding redeposited pollen and spores). Results of pollen analysis are displayed in the pollen diagrams produced with the Tilia/TiliaGraph software (Grimm, Reference Grimm2004). Detailed information is given in Supplementary Table 3, which displays the results of pollen analysis in counts and concentrations including redeposited taxa.
For testate amoebae analysis, samples were suspended in purified water and wet-sieved (500 µm screen) to remove organic and mineral particles. Testate amoebae were identified and counted in glycerin on glass slides under a light microscope at 100× to 400× magnifications (Zeiss Axioskop 2). The taxonomic and ecological characterization of the testacean species is based on Chardez (Reference Chardez1965) and on publications on testate amoebae ecology in arctic and subarctic environments (Supplementary Table 4; Beyens and Bobrov, Reference Beyens and Bobrov2016; Bobrov et al., Reference Bobrov, Wetterich, Beermann, Schneider, Kokhanova, Schirrmeister, Pestryakova and Herzschuh2013).
RESULTS
Cryolithology
The Yukagir IC, the Zimov'e stratum, and the Zyryan stratum were studied in profiles L7-01, L7-03, and L7-05 (Fig. 3). Additionally, IWs of the Yukagir IC were probed in profiles L7-01 and L7-02 (Fig. 3).
The Yukagir IC is differentiated into a lowermost minerogenic horizon reaching up to 3.5 m thickness (up to 4 m asl) and in places an overlying peat horizon reaching up to 1 m thickness (Fig. 3). The latter is exposed at several similar outcrops within a distance of about 550 m along the beach between the Zimov'e River mouth and Cape Kamenniy Mys' (Fig. 1b). Wedge ice of the Yukagir IC is exposed in both horizons. Profile L7-03 (and partly in L7-01 and L7-05 lowermost samples) comprises ice-rich greenish-gray silts and sandy silts. Pebbles and peat lenses (50 × 50 to 100 × 100 mm) occur at the cryoturbated contact of the grayish sediments with the overlying Yukagir IC peat at about 2.6 m asl in profile L7-01. The peat itself is represented by fresh (sometimes green) Drepanocladus moss in the inner frozen parts and by degraded dark-brown material in the thawed outer parts. Medium-sized silts characterize the grain-size distributions of the Yukagir IC sediment similar to those of the Yukagir IC peat (Fig. 4). The MS shows about twofold lower values in the minerogenic horizon if compared with those of the peat horizon. The OM characteristics diverge clearly with higher values in TOC and C/N in the peat horizon than in the minerogenic horizon, whereas the δ13C of TOC is similar in both horizons (Fig. 4). The minerogenic horizon shows reticulate cryostructure (ice lenses 2 mm thick and 20–50 mm long) between horizontal lenticular cryostructures (ice layers up to 20 mm thick) resulting in an ice content between 33 and 67 wt%. The peat horizon contains lenticular cryostructures (<1 mm thick) and vertical and subvertical ice veins (up to 20 mm thick and 200–300 mm long) resulting in an ice content between 66 and 90 wt% (samples L14-10 and L14-11). The stable water isotope composition of the intrasedimental ice is rather similar in δ18O and δD in both horizons, but the mean d is positive in the minerogenic horizon (3.4 ± 8.3‰) and negative in the peat horizon (–8.6 ± 9.1‰), although both at high variation.

Figure 4. Sediment, organic matter, and intrasedimental ice properties of the Yukagir Ice Complex (sediment and peat), the Zimov'e and the Zyryan strata of profile L7-01 (a), profile L7-05 (b), and profile L7-03 (c). White diamond symbols refer to the upper x-axis. m asl, meters above sea level; MS, magnetic susceptibility; TOC, total organic carbon.
Within the minerogenic horizon of the Yukagir IC, the IWs are up to 3 m wide (IW L7-02; Fig. 3) and contain only few sediment veins (up to 1 mm thick) and unregularly distributed numerous air bubbles (1–2 mm in diameter). The peat horizon comprises gray transparent composite wedges (IW L7-01; Fig. 3) up to 1.2 m wide with single sediment and ice veins up to 5–10 mm thick and rich in unregularly distributed air bubbles (1–2 mm in diameter). The wedge ice data of the Yukagir IC obtained from 2007 samples complement previous data from Meyer et al. (Reference Meyer, Dereviagin, Siegert, Schirrmeister and Hubberten2002b)—namely, IWs LYA-R17-1 and LYA-R17-2—and are described and interpreted here together (Fig. 5). The four considered Yukagir IWs show low variation in mean δ18O between –32.8 ± 1.2‰ and –31.5 ± 0.6‰, and in mean δD between –260.2 ± 9.1‰ and –247.4 ± 3.9‰ (Table 2). The d is positive and varies between mean values of 2.0 ± 0.9‰ and 5.9 ± 1.6‰ (Table 2). The δ18O-δD regression shows a slope of 8.65, an intercept of 25.78, and a correlation of r 2 = 0.98 (Fig. 5).

Figure 5. Coisotopic relation of δ18O and δD in ice and composite wedges of the Yukagir Ice Complex (blue dots: L7-01, L7-02, LYA-R17-1, and LYA-R17-2) and of the Zyryan stratum (orange dots: LYA-R6-1 and LYA-R6-2). The data from ice wedges (IWs) LYA-R17-1, LYA-R17-2, LYA-R6-1, and LYA-R6-2 are from Meyer et al. (Reference Meyer, Dereviagin, Siegert, Schirrmeister and Hubberten2002b). The dashed line shows the global meteoric water line (GMWL; Craig, Reference Craig1961). VSMOW, Vienna standard mean ocean water. (For interpretation of the references to color in this figure legend, the reader is referred to the web version of this article).
Table 2. Stable isotope (δ18O, δD, and d) minimum (min), mean, and maximum (max) values and standard deviations (std); and slopes, intercept, and correlation coefficient (r 2) from wedge ice of the Yukagir Ice Complex and the Zyryan stratum shown in Figure 4. Asterisk (*) indicates data from Meyer et al. (Reference Meyer, Dereviagin, Siegert, Schirrmeister and Hubberten2002b).

The vertical contact of the Yukagir IC with overlying deposits of the Zimov'e (paleoactive layer) and the Zyryan strata is captured in profiles L7-01 and L7-05 (Figs. 3 and 4). The Zimov'e stratum is about 0.5 m thick and comprises yellowish-brown silts. Less rounded yellowish and reddish pebbles are numerous and vary in size (>2 mm up to 20 mm in diameter). The pebbles cluster in yellowish-orange sandy cryoturbation pockets. The MS is slightly higher than in the underlying minerogenic horizon of the Yukagir IC. OM is present in the Zimov'e stratum in rare black organic spots and in situ grass roots creating very low TOC and TN contents and low C/N ratio (Fig. 4). The δ13C of TOC is within the range of the underlying Yukagir IC and the overlying Zyryan stratum. The sediment shows lenticular cryostructures less than 1 mm thick or lacks any visible cryostructures resulting in a low ice content. The intrasedimental ice isotope data show more depleted values in δ18O and δD if compared with the underlying Yukagir IC, and a much higher d (Fig. 4). The Zimov'e stratum lacks syngenetic wedge ice, but epigenetic composite wedges of the overlying Zyryan stratum (up to 0.5 m wide) penetrate into the Zimov'e stratum and reach even into wedge ice of the Yukagir IC.
The Zyryan stratum is predominantly composed of yellowish-brown medium and coarse silts and is present in the upper parts of profiles L7-01 and L7-05 (Figs. 3 and 4). Horizontal and waved layering occurs in places. The MS differs from the underlying deposits of the Zimov'e stratum by higher values, and the transition is well seen in profile L7-05 (Fig. 4). OM is present in in situ grass roots, peaty lenses (20 × 50 mm), and single black spots (2 × 2 mm). The TOC and TN contents are very low, whereas the δ13C of TOC shows the highest values of all studied strata (Fig. 4). The cryostructures of the Zyryan stratum are lenticular (less than 1 mm thick) or structureless. Consequently, the ice content is low, and only two sediment samples yielded enough supernatant meltwater for stable water isotope analysis. The composition varies little and is comparable to those of the underlying Zimov'e stratum (Fig. 4). Meyer at al. (Reference Meyer, Dereviagin, Siegert, Schirrmeister and Hubberten2002b) described and studied IWs of the Zyryan stratum (IWs LYA-R6-1 and LYA-R7-1) as up to 2.5-m-wide composite wedges with alternating sediment veins (1–2 mm wide) and ice veins (1–10 mm wide). The isotopic signature of those IWs is shown in Figure 5 and Table 2. The mean values of Zyryan IWs LYA-R6-1 and LYA-R7-1 are very close in δ18O (–36.0 ± 0.9‰ and –36.2 ± 0.4‰), δD (–281.0 ± 5.0‰ and –278.9 ± 3.4‰), and d (6.7 ± 2.1‰ and 5.8 ± 0.6‰). The coisotopic δ18O-δD regression shows a slope of 6.24 and an intercept of –56.57 (r 2 = 0.96; Fig. 5).
Radioisotope dating
The Yukagir IC peat was newly dated by radioisotope disequilibria to validate the previous age estimate by Schirrmeister et al. (Reference Schirrmeister, Oezen and Geyh2002), which yielded an age of 201 ± 3.4 ka (Table 1). Eight out of 11 subsamples in combined L14-10 and L14-11 material show for both the L/L and the TSD technique a best-fit dependence of r2 = 0.99 in the isochron coordinates (230Th/232Th vs. 234U/232Th) (Fig. 6; Supplementary Table 2). Those best-fit ages are further considered. The L/L technique produces an associated isochron-corrected age of 178 ± 14 ka, and the TSD technique an isochron-corrected age of 221 ± 27 ka of the Yukagir peat. The almost overlapping age interval of both dates and their similarity to previous dating indicate the formation of the Yukagir IC peat during MIS 7.

Figure 6. Radioisotope ratios (230Th/232Th vs. 234U/232Th) of 11 subsamples from the Yukagir peat determined by applying the L/L model (a) and the TSD model (b). Eight (black dots) subsamples from samples L14-10 and L14-11 produce for each technique a best-fit dependence of r 2 = 0.99 and are taken for age calculation. White dots indicate data not included in the radioisotope disequilibria age determination. L/L, acidic extraction of the sampled material in leachate alone; TSD, total sample dissolution.
Paleoecology
Both the minerogenic and peat horizons of the Yukagir IC have relatively high pollen and spore concentrations with clear dominance of Poaceae over Cyperaceae (Fig. 7). Caryophyllaceae, Asteraceae, and Ranunculaceae are common, whereas arboreal pollen is rare and represented by Betula, Salix, and Alnus sensu lato (s.l.). Further redeposited pollen is at a low concentration. Relatively high productivity of local habitats and grass-shrub-moss tundra vegetation are interpreted for the Yukagir IC.

Figure 7. Pollen and nonpollen palynomorphs (NPPs) of the Yukagir Ice Complex (sediment and peat), the Zimov'e, and the Zyryan strata sampled in 2007 of profile L7-01 (a), profile L7-05 (b), and profile L7-03 (c).
Only three samples of Yukagir IC peat in profile L7-01 contain findings of testacean shells. In total, 20 taxa of seven genera mainly Centropyxis (10 species) and Difflugia (4 species) were found (Supplementary Table 4). The testacean species composition reflects varying degrees of wetness, while the presence of distinct hydrophilic species of the genus Difflugia represents open water of low polygon centers in the lower part of the peat horizon and prevailing eurybiontic species in the uppermost sample point at least to wetland conditions.
The pollen spectra of the Zimov'e stratum are characterized by prevalent Poaceae pollen. The overall pollen composition is very similar to those of the Yukagir IC pointing to grass-shrub-moss tundra vegetation (Fig. 7).
The floodplain deposits of the Zyryan stratum have very low pollen concentrations and high amounts of redeposited pollen and spores, especially conifers. The floodplain character of the Zyryan stratum makes it likely that short-distance eroded pollen, as well as long-distance transported pollen, largely contributed to the spectra. Excluding redeposited conifers from the pollen sum, Cyperaceae and Poaceae dominate the pollen spectra. Among other herbs, the percentages of Asteraceae, Caryophyllaceae, and Artemisia are notable. Arboreal taxa are present as Betula, Salix, and Alnus s.l. However, redeposition of Betula and Alnus pollen cannot be excluded. Spores are more or less abundant and represented by ferns and lycopods (such as Selaginella rupestris). Botryococcus algae remains show the highest abundances of all studied samples. Sparse grass-sedge tundra-steppe vegetation is interpreted for the Zyryan stratum. However, Zimmermann et al. (Reference Zimmermann, Raschke., Epp, Stoof-Leichsenring, Schirrmeister, Schwamborn and Herzschuh2017) infer the presence of trees and shrubs based on similar pollen spectra and ancient DNA data of the Zyryan stratum.
DISCUSSION
IC formation and properties
The exposed stratigraphy at the southern coast of Bol'shoy Lyakhovsky Island allows comparison of four generations of IC formations of which the Yukagir IC represents the oldest one (Figs. 2 and 8). The accelerator mass spectrometry radiocarbon method applied to Holocene deposits and MIS 3–2 ICs covers roughly 60 ka and provides reasonable chronologies of the single sections. The Molotkov-Yedoma IC and the Sartan-Yedoma IC are well constrained by radiocarbon dates to interstadial MIS 3 and stadial MIS 2 ages, respectively (Fig. 8; Wetterich et al. Reference Wetterich, Rudaya, Tumskoy, Andreev, Opel, Schirrmeister and Meyer2011, Reference Wetterich, Tumskoy, Rudaya, Andreev, Opel, Meyer and Schirrmeister2014). Older deposits are more difficult to date because of limited availability of appropriate sample material and method restrictions. The age determinations of the Buchchagy and the Yukagir ICs at given uncertainties of radioisotope 230Th/U dating point to their formation during MIS 5 and MIS 7, respectively (Fig. 8). The 230Th/U ages of two distinctive peaty horizons encompassing the Buchchagy IC do not resolve short-term variations in climate during MIS 5 and span a large period from MIS 5e to MIS 5b between about 126 + 16/−13 ka and 89 ± 5 ka (Fig. 8; Wetterich et al., Reference Wetterich, Tumskoy, Rudaya, Kuznetsov, Maksimov, Opel, Meyer, Andreev and Schirrmeister2016). The Yukagir IC most likely formed during the MIS 7 interglacial period (MIS 7a–c). In the lithostratigraphic record of Bol'shoy Lyakhovsky Island, IC formation could be expected during MIS 5–4, but the sedimentary records are partly replaced by floodplain deposition of the Kuchchugui and Zyryan strata (Andreev et al., Reference Andreev, Grosse, Schirrmeister, Kuzmina, Novenko and Bobrov2004, Reference Andreev, Grosse, Schirrmeister, Kuznetsova, Kuzmina, Bobrov and Tarasov2009). It is largely speculative whether the paleotopography, the hydroclimatic setting (i.e., low winter precipitation attributable to higher continentality), or high floodplain deposition rates during both periods prevented syngenetic IW growth.

Figure 8. Chronostratigraphic data of the southern coast of Bol'shoy Lyakhovsky Island compiling numerical dates from sequences of late glacial and Holocene deposits (Andreev et al., Reference Andreev, Grosse, Schirrmeister, Kuznetsova, Kuzmina, Bobrov and Tarasov2009; Wetterich et al., Reference Wetterich, Schirrmeister, Andreev, Pudenz, Plessen, Meyer and Kunitsky2009; Zimmermann et al., Reference Zimmermann, Raschke., Epp, Stoof-Leichsenring, Schirrmeister, Schwamborn and Herzschuh2017), the Sartan-Yedoma Ice Complex (IC) (Wetterich et al., Reference Wetterich, Rudaya, Tumskoy, Andreev, Opel, Schirrmeister and Meyer2011), the Molotkov-Yedoma IC (Andreev et al., Reference Andreev, Grosse, Schirrmeister, Kuznetsova, Kuzmina, Bobrov and Tarasov2009; Wetterich et al., Reference Wetterich, Tumskoy, Rudaya, Andreev, Opel, Meyer and Schirrmeister2014; Zimmermann et al., Reference Zimmermann, Raschke., Epp, Stoof-Leichsenring, Schirrmeister, Schwamborn and Herzschuh2017), the Zyryan stratum (Andreev et al., Reference Andreev, Grosse, Schirrmeister, Kuzmina, Novenko and Bobrov2004), the Buchchagy IC (Wetterich et al., Reference Wetterich, Tumskoy, Rudaya, Kuznetsov, Maksimov, Opel, Meyer, Andreev and Schirrmeister2016), the Zimov'e stratum (Andreev et al., Reference Andreev, Grosse, Schirrmeister, Kuzmina, Novenko and Bobrov2004), and the Yukagir IC (Schirrmeister et al., Reference Schirrmeister, Oezen and Geyh2002; this study). Additionally, one infrared-stimulated luminescence (IRSL) date of the Krest Yuryakh stratum and one IRSL date from the Kuchchugui stratum from the Oyogos mainland coast are shown as white symbols (Opel et al., Reference Opel, Wetterich, Meyer, Dereviagin, Fuchs and Schirrmeister2017). Interglacial (orange) and glacial (gray: stadial stages, dark gray; interstadial stages, light gray) periods refer to the Marine Oxygen Isotope Stages (MISs) of the LR04 stack of benthic δ18O (Lisiecki and Raymo, Reference Lisiecki and Raymo2005) and a current review of past interglacial periods (Past Interglacials Working Group of PAGES, 2016). Modeled mean summer (June, July, August [JJA]) and winter (December, January, February [DJF]) temperatures for the Laptev Sea region (Ganopolski and Calov, Reference Ganopolski and Calov2011) are shown for comparison. (For interpretation of the references to color in this figure legend, the reader is referred to the web version of this article).
Ice-bearing Quaternary deposits in permafrost environments comprise valuable archives of environmental and landscape dynamics over several glacial-interglacial cycles. Information on past conditions is reflected in the mineralogical, organic, and ice inventories. The minerogenic component as represented by silts in all four ICs is similar and controlled by source material, transportation, and on-site cryogenic weathering. The median of grain-size values varies little between 22 and 31 µm (medium silt), although extreme values reach fine and coarse silt (Fig. 9a). The intrasedimentary ice content is high with median values between 42 and 49 wt% (Fig. 9b), reaching maximum values of almost 100 wt% in samples of the MIS 3 Molotkov-Yedoma IC close to wedge-ice bodies (Zimmermann et al., Reference Zimmermann, Raschke., Epp, Stoof-Leichsenring, Schirrmeister, Schwamborn and Herzschuh2017). Excess ice is characteristic for IC strata.

Figure 9. Mean grain-size (a), ice content (b), total organic carbon (TOC) content (c), δ13C of TOC (d), and C/N (e) of Ice Complex (IC) generations exposed at the southern coast of Bol'shoy Lyakhovsky Island. The compiled data are based on fieldwork in 1999, 2007, and 2014: Marine Oxygen Isotope Stage (MIS) 7 Yukagir IC (Andreev et al., Reference Andreev, Grosse, Schirrmeister, Kuzmina, Novenko and Bobrov2004; Schirrmeister et al., Reference Schirrmeister, Grosse, Kunitsky and Siegert2017a, Reference Schirrmeister, Grosse, Kunitsky and Siegert2017b, Reference Schirrmeister, Grosse, Kunitsky and Siegert2017c, Reference Schirrmeister, Grosse, Kunitsky and Siegert2017d; this study), MIS 5 Buchchagy IC (Wetterich et al., Reference Wetterich, Tumskoy, Rudaya, Kuznetsov, Maksimov, Opel, Meyer, Andreev and Schirrmeister2016), MIS 3 Molotkov-Yedoma IC (Schirrmeister et al., Reference Schirrmeister, Grosse, Kunitsky and Siegert2017e, Reference Schirrmeister, Grosse, Kunitsky and Siegert2017f, Reference Schirrmeister, Grosse, Kunitsky and Siegert2017g; Schwamborn and Wetterich, Reference Schwamborn and Wetterich2016a, Reference Schwamborn and Wetterich2016b; Wetterich et al., Reference Wetterich, Tumskoy, Rudaya, Andreev, Opel, Meyer and Schirrmeister2014; Zimmermann et al., Reference Zimmermann, Raschke., Epp, Stoof-Leichsenring, Schirrmeister, Schwamborn and Herzschuh2017), and MIS 2 Sartan-Yedoma IC (Wetterich et al., Reference Wetterich, Rudaya, Tumskoy, Andreev, Opel, Schirrmeister and Meyer2011). The Cyperaceae/Poaceae ratio (f) is calculated from pollen concentrations. The box-whisker plot graph displays the minimum, maximum, median, lower quartile, and upper quartile. The caps at the end of each box indicate the minimum and maximum values, the box is defined by the lower and upper quartiles, and the line in the center of the box is the median. VPDB, Vienna Pee Dee belemnite.
The organic component characterizes the MIS 7 Yukagir IC by substantial amounts of Drepanocladus moss peat with high TOC (median of 13.8 wt%) and the most depleted δ13C of TOC (median of –28.2‰) (Fig. 9c and d). Such distinct peat accumulation is rather untypical for stadial and interstadial IC formations, where peaty deposits commonly exhibit single lenses or small layers (Wetterich et al., Reference Wetterich, Rudaya, Tumskoy, Andreev, Opel, Schirrmeister and Meyer2011, Reference Wetterich, Tumskoy, Rudaya, Andreev, Opel, Meyer and Schirrmeister2014), and points further to Yukagir IC formation under interglacial conditions. Assuming a comparable OM input mainly from surface vegetation, the C/N in all four ICs exhibits similar median values between 9 and 11 (Fig. 9e) resulting in a comparable degree of OM decomposition.
The Cyperaceae/Poaceae (Cy/Po) ratio of pollen concentrations reflects varying prevalence of the main elements of past tundra-steppe vegetation (Fig. 9f). We assume that the prevalence of Cyperaceae over Poaceae in arctic pollen spectra is a result of more humid summer climate conditions. Arctic Carex and Eriophorum spread mostly in different wet types of moss and moss-herbaceous arctic tundra and sedge-moss swamps (Tolmachev and Yurtsev, Reference Tolmachev and Yurtsev1966). Coldest and driest summer climate conditions during the last glacial maximum are represented by the lowest median Cy/Po of 0.3 of the stadial MIS 2 Sartan-Yedoma IC, while the interglacial MIS 7 Yukagir and the interstadial MIS 3 Molotkov-Yedoma ICs show Cy/Po of 0.6, and the MIS 5 Buchchagy IC even reaches Cy/Po of 1 (Fig. 9f). Dominating Poaceae, abundant Artemisia, and low percentages of Ericales in the MIS 2 Sartan-Yedoma IC pollen spectra indicate cold and dry climatic conditions. Evidence of an extremely cold climate is given by the dominance of Poaceae over Cyperaceae pollen (Wetterich et al., Reference Wetterich, Rudaya, Tumskoy, Andreev, Opel, Schirrmeister and Meyer2011). The large amount of Caryophyllaceae, Brassicaceae, and Papaveraceae, which are arctic pioneer taxa and typical for northernmost vascular plant communities (Kienast et al., Reference Kienast, Schirrmeister, Siegert and Tarasov2005, Reference Kienast, Tarasov, Schirrmeister, Grosse and Andreev2008, Reference Kienast, Wetterich, Kuzmina, Schirrmeister, Andreev, Tarasov, Nazarova, Kossler, Frolova and Kunitsky2011), supports this interpretation. Wetterich et al. (Reference Wetterich, Tumskoy, Rudaya, Kuznetsov, Maksimov, Opel, Meyer, Andreev and Schirrmeister2016) suggested that the pollen records of the MIS 5 Buchchagy IC are comparable to previously studied pollen records from MIS 3–2 Yedoma IC on Bol'shoy Lyakhovsky Island (Andreev et al., Reference Andreev, Grosse, Schirrmeister, Kuznetsova, Kuzmina, Bobrov and Tarasov2009; Wetterich et al., Reference Wetterich, Rudaya, Tumskoy, Andreev, Opel, Schirrmeister and Meyer2011, Reference Wetterich, Tumskoy, Rudaya, Andreev, Opel, Meyer and Schirrmeister2014). Based on the pollen composition, it was concluded that the MIS 5 Buchchagy IC pollen record documents harsher environmental conditions than during the MIS3 interstadial stage and rather similar conditions as during MIS 2. However, the lower abundance of Artemisia pollen, the indicator of dry conditions, is the argument in favor of assuming a more humid summer climate during MIS 5 than during MIS 2. The Cy/Po ratio of about 1 supports this conclusion.
The stable water isotope composition of IC ground-ice components as intrasedimentary ice and wedge ice are shown in Figure 10. The δ18O and d data of intrasedimentary ice show considerable variations (Fig. 10a and b). The intrasedimentary ice of the MIS 7 Yukagir IC differs from those of other ICs by less depleted δ18O (median of –21.9‰; Fig. 10a) and low d (median of 4.4‰; Fig. 10b). Higher evaporation of soil moisture from polygonal ponds during warmer summers might further explain the less depleted δ18O in conjunction with their low d in intrasedimentary ice of the Yukagir IC if compared with the other ICs (Fig. 10a and b). Data from the MIS 2 Sartan-Yedoma IC show similar low d values, although the δ18O shows low values similar to those of the MIS 5 Buchchagy and MIS 3 Molotkov-Yedoma ICs. The effect of freeze-out isotopic fractionation also seems realistic and would produce similar slopes in coisotopic plots of intrasedimentary ice as evaporation processes (Throckmorton et al., Reference Throckmorton, Newman, Heikoop, Perkins, Feng, Graham and O'Malley2016), although the freezing process and its velocity are unknown. Hence, we interpret the pattern of isotopic data in intrasedimentary ice to be influenced by more effective evaporation based on depleted δ18O and low d in the Yukagir IC.

Figure 10. Stable-water isotope composition (δ18O and d) of intrasedimental ice (a, b) and wedge ice (c, d) of Ice Complex (IC) generations exposed at the southern coast of Bol'shoy Lyakhovsky Island. The complied data are based on fieldwork in 1999, 2007, and 2014: Marine Oxygen Isotope Stage (MIS) 7 Yukagir IC (Meyer et al., Reference Meyer, Dereviagin, Siegert, Schirrmeister and Hubberten2002b; this study), MIS 5 Buchchagy IC (Wetterich et al., Reference Wetterich, Tumskoy, Rudaya, Kuznetsov, Maksimov, Opel, Meyer, Andreev and Schirrmeister2016), MIS 3 Molotkov-Yedoma IC (Meyer et al., Reference Meyer, Dereviagin, Siegert, Schirrmeister and Hubberten2002b; Wetterich et al., Reference Wetterich, Tumskoy, Rudaya, Andreev, Opel, Meyer and Schirrmeister2014), and MIS 2 Sartan-Yedoma IC (Wetterich et al., Reference Wetterich, Rudaya, Tumskoy, Andreev, Opel, Schirrmeister and Meyer2011).
For Bol'shoy Lyakhovsky Island, the IW isotopic signature of the four IC generations provides the most depleted δ18O median value of –37.3‰ (i.e., coldest winter conditions for the MIS 2 Sartan-Yedoma IC), while data of the MIS 7 Yukagir IC, the MIS 5 Buchchagy IC, and the MIS 3 Molotkov- Yedoma IC are by about 4‰ to 6‰ less depleted with median values between –33.0‰ and –31.0‰ in δ18O (Fig. 10c). The d of wedge ice of all ICs varies little between 5.4‰ and 7.1‰ (Fig. 10d) pointing to similar atmospheric moisture generation and transport patterns in winter.
The δ18O-δD slope of 8.65 in the combined IW data of the Yukagir IC (Fig. 5) is slightly higher than the global meteoric water line (slope 8; Craig, Reference Craig1961). A slope of >8 might indicate changing moisture sources and transport pathways (Meyer et al., Reference Meyer, Dereviagin, Siegert and Hubberten2002a) during MIS 7, which is different compared with the other ICs. A similar hydrologic change during Yukagir wedge-ice growth between interglacial MIS 7 to glacial MIS 6 conditions is observed in wedge-ice data from Bykovsky Peninsula, which show the transition from glacial MIS 2 to interglacial MIS 1 conditions (Meyer et al., Reference Meyer, Dereviagin, Siegert and Hubberten2002a).
IC preservation during interglacial periods
The preservation of IC strata depends on its former extent and thickness, and on the intensity of interglacial thermokarst that might rapidly degrade preexisting ice-rich deposits. It is unknown if the preserved sequences of the Yukagir IC are complete or represent only the lowermost part of the formation. The hiatus between the Yukagir IC and the overlying Zimov'e stratum amounts to several thousands of years (Table 1, Fig. 8), which makes complete preservation unlikely. The preservation of the Yukagir IC was further controlled by the spatial pattern of thermokarst, which shaped the Beringian topography during the last interglacial period and the Holocene. Summer climate reconstructions from last interglacial thermokarst lake deposits on Bol'shoy Lyakhovsky Island revealed mean temperatures of the warmest month (MTWA) from 9°C to 14°C (pollen based) and 12.5°C (plant macrofossil based; Kienast et al., Reference Kienast, Tarasov, Schirrmeister, Grosse and Andreev2008), which is about 10°C warmer than today's MTWA of 2.8°C (station Mys Shalaurova, 1984–1994; http://www.globalbioclimatics.org [accessed 7 January 2019]). Data from the Earth system model of intermediate complexity, CLIMBER-2 (Petoukhov et al., Reference Petoukhov, Ganopolski, Brovkin, Claussen, Eliseev, Kubatzki and Rahmstorf2000), driven by orbital forcing and greenhouse gas concentrations (Ganopolski and Calov, Reference Ganopolski and Calov2011), reveal comparable mean summer temperatures (June, July, August; Fig. 8) of up to 15°C in the Laptev Sea region during the last interglacial period. Thus, not even the criterion for a subpolar climate was met, where absolute MTWA is below 10°C. Further quantitative micropaleontological proxy data from last interglacial thermokarst lake deposits exposed on the nearby Oyogos Yar mainland coast (Fig. 1) confirm warmer-than-today summer climate reflecting higher continentality attributable to its inland position (Kienast et al., Reference Kienast, Wetterich, Kuzmina, Schirrmeister, Andreev, Tarasov, Nazarova, Kossler, Frolova and Kunitsky2011). Such intense warming and promotion of permafrost thaw challenged the persistence of ice-rich deposits such as the Yukagir IC and might explain its rare preservation in only a few places.
Studies of the distribution of MIS 3–2 Yedoma IC remnants, which persisted during the late glacial–Holocene warming estimated that about 70% of the Yedoma area is thermokarst affected (Strauss et al., Reference Strauss, Schirrmeister, Grosse, Wetterich, Ulrich and Hubberten2013). The IC preservation shows highly variable extents along the mainland coast of the Laptev and East Siberian Seas from west to east (Fig. 1). Although in the western Laptev Sea Yedoma IC remnants make up 78% of the coastline, this value decreases to 31% on the Buor Khaya Peninsula in the Central Laptev Sea, and to 17% along the Oyogos Yar mainland coast (opposite to the southern coast of Bol'shoy Lyakhovsky Island) at the Dmitry Laptev Strait (Günther et al., Reference Günther, Overduin, Sandakov, Grosse and Grigoriev2013). However, the past extent of the Yukagir IC is unknown, but a similar or even higher impact of degradation during the last interglacial warming on its distribution compared with the effects of Holocene warming on MIS 3–2 Yedoma IC is likely.
Climate seasonality, which is not only characterized by peak temperatures but also considers the respective length of the summer and winter periods, might have promoted IC preservation when shorter summers and longer winters occurred. Konishchev (Reference Konishchev2013) emphasizes the cyclic character of IC formation depending on climate fluctuations, which result in rapid variations in active layer thickness. The latter defines the perennial freezing of the lowermost parts of the active layer, hence the formation and preservation of a permafrost IC. Favorable conditions for IC preservation further include drained relief position and insulating (protective) cover of peat and vegetation (Morgenstern et al., Reference Morgenstern, Grosse, Günther, Fedorova and Schirrmeister2011). The peat of the Yukagir IC, reaching up to 1 m thickness on top of the sequence, most likely enabled the preservation of the underlying ice-rich minerogenic part (Fig. 3), although it is unknown how much of the Yukagir IC peat remains from its original thickness because the contact to the overlying strata is discordant.
Finally, the formation of the MIS 7 Yukagir IC, its persistence since then, and the presence of the overlying MIS 6 Zimov'e stratum on Bol'shoy Lyakhovsky Island provide evidence that this part of Beringia did not belong to the proposed glaciation of the East Siberian Shelf during the MIS 6 (Brigham-Grette, Reference Brigham-Grette2013; Niessen et al., Reference Niessen, Hong, Hegewald, Matthiessen, Stein, Kim, Kim, Jensen, Jokat, Nam and Kang2013). Glaciogenic features such as striated boulders and/or massive ground ice with traces of glacial origin are lacking on Bol'shoy Lyakhovsky Island but have been described on Novaya Sibir’ Island and Fadeevsky Island north of the Bol'shoy Lyakhovsky Island (Nikolskiy et al., Reference Nikolskiy, Basilyan and Zazhigin2017; Tumskoy, Reference Tumskoy2012). Consequently, the maximum extent of such still suggested and yet undated glaciation reached only areas north of Bol'shoy Lyakhovsky Island.
CONCLUSIONS
The studied Yukagir IC represents a syngenetic ice-rich permafrost sequence, which formed during the penultimate interglacial period (MIS 7) in polygon tundra environments and persisted during the last interglacial period and the Holocene warming at least in places where thermokarst and thermo-erosion were less pronounced. The position of the Yukagir IC remnants in the paleotopography and the formation of a protective peat layer on top of ice-rich deposits likely enabled its preservation, which was furthermore maintained by the overlying, rapidly deposited, and ice-poor Zimov'e and Zyryan strata. The rarity of ice-rich permafrost remnants predating the last interglacial period, however, is most likely explained by the last interglacial summer temperatures of 10°C warmer than today in the region and the according high intensity of thermokarst processes.
If compared with consecutive IC formations during MIS 5, MIS 3, and MIS 2, the Yukagir IC differs in its high TOC content of about 14 wt% (other ICs below 5 wt%), most depleted δ13C of TOC, and C/N ratios above 10 indicating high OM accumulation, low decomposition rates, and likely fast burial of the ice-rich Yukagir sediment. The pollen record of the Yukagir IC resembles grass-shrub-moss tundra similar to modern vegetation. Granulometric data of all four considered ICs and ice contents (although with large variations) confirm comparable sedimentation and freezing conditions. Less depleted δ18O and low d values of intrasedimental ice of the Yukagir IC might, however, reflect higher evaporation of soil moisture during warmer summers. Syngenetic IW polygon growth and the preservation of according IC strata highlight the resilience of ice-rich permafrost under changing climate conditions of the terrestrial Arctic.
ACKNOWLEDGMENTS
The German Federal Ministry of Education and Research (BMBF) supported the study that contributes to the BMBF projects CARBOPERM (grant no. 03G0836) and Arc-EcoNet (grant no. 01DJ14003 to SW). Further support was provided by the Deutsche Forschungsgemeinschaft (grant nos. OP217/3-1 to TO and WE4390/7-1 to SW), by the Russian Foundation for Basic Research (grant no. 15-29-02518 to AB), by the St. Petersburg State University (grant no. 18.40.68.2017 to VK and FM), by the President of the Russian Federation (grant no. MK-1428.2017.5 to AS), and by the Alexander von Humboldt Foundation (grant no. Ref 3.3-RUS-1151158-HFST-E to NR). We acknowledge support by the German Academic Exchange Service (DAAD) with funds from the BMBF and the European Union's Seventh Framework Programme (FP7, grant agreement #605728). The pollen study was performed according to the Russian Government Program of Competitive Growth of the Kazan Federal University. We acknowledge the support by the European Research Council (Starting Grant #338335) and the Initiative and Networking Fund of the Helmholtz Association (#ERC-0013). We thank our colleagues during fieldwork in 2007 and 2014, especially Vladimir Tumskoy and Dmitry Dobrynin (Moscow State University), Dmitry Mel'nichenko (Hydrobase Tiksi), and Georg Schwamborn and Waldemar Schneider (AWI Potsdam). Ute Kuschel, Dyke Scheidemann, Antje Eulenburg, and Lutz Schönicke (all AWI Potsdam) expertly conducted the analytical work. We acknowledge two anonymous reviewers and Quaternary Research senior editor Nicholas Lancaster and associate editor Thomas Lowell for critical and helpful suggestions, which improved the final version of the paper.
SUPPLEMENTARY MATERIAL
The supplementary material for this article can be found at https://doi.org/10.1017/qua.2019.6


