


Introduction
An organism's ability to shift its developmental trajectory when subjected to environmental change, also known as developmental plasticity, has long been proposed to facilitate the emergence of novel traits (West-Eberhard Reference West-Eberhard2005; Moczek et al. Reference Moczek, Sultan, Foster, Ledón-Rettig, Dworkin, Nijhout, Abouheif and Pfennig2011). According to the hypothesis of plasticity-led evolution, plasticity promotes the buildup and subsequent release of cryptic variation in a population in response to environmental stressors (Levis and Pfennig Reference Levis and Pfennig2016). If the external influence persists, these novel phenotypes can become genetically fixed in a process called genetic accommodation. In this manner, within-species plasticity in developmental trajectories can lead to a rapid divergence between two populations and contribute to later speciation events (Pfennig et al. Reference Pfennig, Wund, Snell-Rood, Cruickshank, Schlichting and Moczek2010).
Developmental plasticity is a microevolutionary process that has the potential to influence macroevolutionary patterns preserved in the fossil record. The prevalence of heterochronies or shifts in the rate or timing of developmental events in the fossil record indicates that ontogeny can drive evolutionary change (McNamara Reference McNamara1988; Klingenberg Reference Klingenberg1998). Such studies, however, are often limited to modifications in size or shape late in the development of a descendant species relative to its ancestor, while the importance of within-species plasticity—especially in early ontogeny—is rarely explored due to the poor preservation potential of developmental stages (Rundle and Spicer Reference Rundle and Spicer2016). Jackson (Reference Jackson2020) suggests that plasticity-led evolution could be identified in the fossil record when morphological change is accompanied by a burst in variability that exceeds the ancestral range due to a release of cryptic genetic variation previously “hidden” from selection. This pattern is distinct from a gradual shift to a new trait optimum with no corresponding increase in its variability, as predicted by phyletic gradualism or evolution by accumulation of small changes. So far, the role of developmental plasticity in the origin of novel traits has mainly been investigated in lineages with extant ancestral and derived populations, such as the emergence of a carnivorous morph from an omnivorous ancestor in spadefoot toads. Experimental studies have shown that the morphological traits associated with the carnivorous morph can be induced in species with an ancestral feeding strategy if they are raised exclusively on live prey (Ledón-Rettig et al. Reference Ledón-Rettig, Pfennig and Crespi2010; Levis et al. Reference Levis, Isdaner and Pfennig2018)—which is indicative of preexisting plasticity in this system.
Planktic foraminifera—a group of calcite-secreting marine microorganisms—hold significant potential for investigating the role of developmental plasticity during speciation events within a well-constrained ecological framework (Schmidt et al. Reference Schmidt, Rayfield, Cocking and Marone2013). The excellent preservation potential and abundance of foraminifera in the marine fossil record allow for frequent sampling throughout the transition from an ancestral species to its descendant. The environmental conditions during this interval can be deduced from the chemical composition of their calcite tests, that is, shells, which reflects shifts in environmental parameters such as temperature and the chemistry of the surface ocean (Kucera Reference Kucera, Hillaire-Marcel and de Vernal2007). Based on species with known developmental trajectories (e.g., Brummer et al. Reference Brummer, Hemleben and Spindler1987; Huber Reference Huber1994; Caromel et al. Reference Caromel, Schmidt, Fletcher and Rayfield2016), the adult specimens of planktic foraminifera retain information about every ontogenetic stage they have undergone due to their unique mode of growth by the addition of chambers in a logarithmic spire (Berger Reference Berger1969; Signes et al. Reference Signes, Bijma, Hemleben and Ott1993). Latest advances in high-resolution imaging, including synchrotron X-ray microtomography (SXRTM), have enabled the isolation and accurate quantification of all the stages in foraminiferal development (Schmidt et al. Reference Schmidt, Rayfield, Cocking and Marone2013; Caromel et al. Reference Caromel, Schmidt, Fletcher and Rayfield2016, Reference Caromel, Schmidt and Rayfield2017).
All major groups of planktic foraminifera exhibit similar chamber addition patterns, which points to a limited potential for generating new, morphologically disparate forms (Caromel et al. Reference Caromel, Schmidt and Rayfield2017). A release of growth trajectories that were previously hidden from selection but are still subject to such ontogenetic constraints could provide an effective mechanism for yielding evolutionary novel phenotypes in this clade. A recent study in seven planktic species showed that intraspecific variation in internal volume throughout ontogeny can be equal to or even exceed between-species differences, meaning that at least some parameters of foraminiferal growth are plastic (Burke et al. Reference Burke, Renema, Schiebel and Hull2019). The internal volume is an important life-history trait in foraminifera, because it determines the total amount of gametes released during reproduction (Bé and Anderson Reference Bé and Anderson1976). The level of intraspecific plasticity remains poorly quantified in studies of ontogeny, because tomographic scanning of microfossils is routinely performed for a small number of specimens per sample due to the time-consuming nature of ontogenetic reconstructions. So far, chamber-by-chamber growth trajectories have been reconstructed to compare extant species of foraminifera (Caromel et al. Reference Caromel, Schmidt, Fletcher and Rayfield2016, Reference Caromel, Schmidt and Rayfield2017; Burke et al. Reference Burke, Renema, Schiebel and Hull2019; Morard et al. Reference Morard, Füllberg, Brummer, Greco, Jonkers, Weiner and Darling2019), but the ontogenetic change throughout the history of a single lineage has yet to be investigated.
Here we reconstruct developmental trajectories alongside overall change in the morphology of the Globorotalia plesiotumida–tumida lineage of deep-dwelling planktic foraminifera. The descendant G. tumida can be distinguished from the ancestral G. plesiotumida by an increase in the size and thickness of its calcite shell and an elongated final chamber (illustrated in Fig. 1A). However, it is unclear how this novel phenotype arose. The morphological change in this lineage has been explored in numerous studies of marine speciation (Malmgren et al. Reference Malmgren, Berggren and Lohmann1983; Bookstein Reference Bookstein1987; Hull and Norris Reference Hull and Norris2009). An influential early analysis postulated that the transition from the ancestral G. plesiotumida to its living descendant G. tumida at the Miocene/Pliocene boundary was gradual, or anagenetic, and lasted 500 kyr (Malmgren et al. Reference Malmgren, Berggren and Lohmann1983). This was challenged by Hull and Norris (Reference Hull and Norris2009), who used the latest morphometric techniques to show that G. tumida originated from a cryptic intermediate species in a rapid speciation event, or cladogenesis, lasting only 44 kyr. Their finding is supported by recent advances in genetic sequencing that have revealed an abundance of cryptic genotypes nested in taxonomically defined morphospecies of extant planktic foraminifera (Darling and Wade Reference Darling and Wade2008; Weiner et al. Reference Weiner, Morard, Weinkauf, Darling, André, Quillévéré and Ujiie2016).
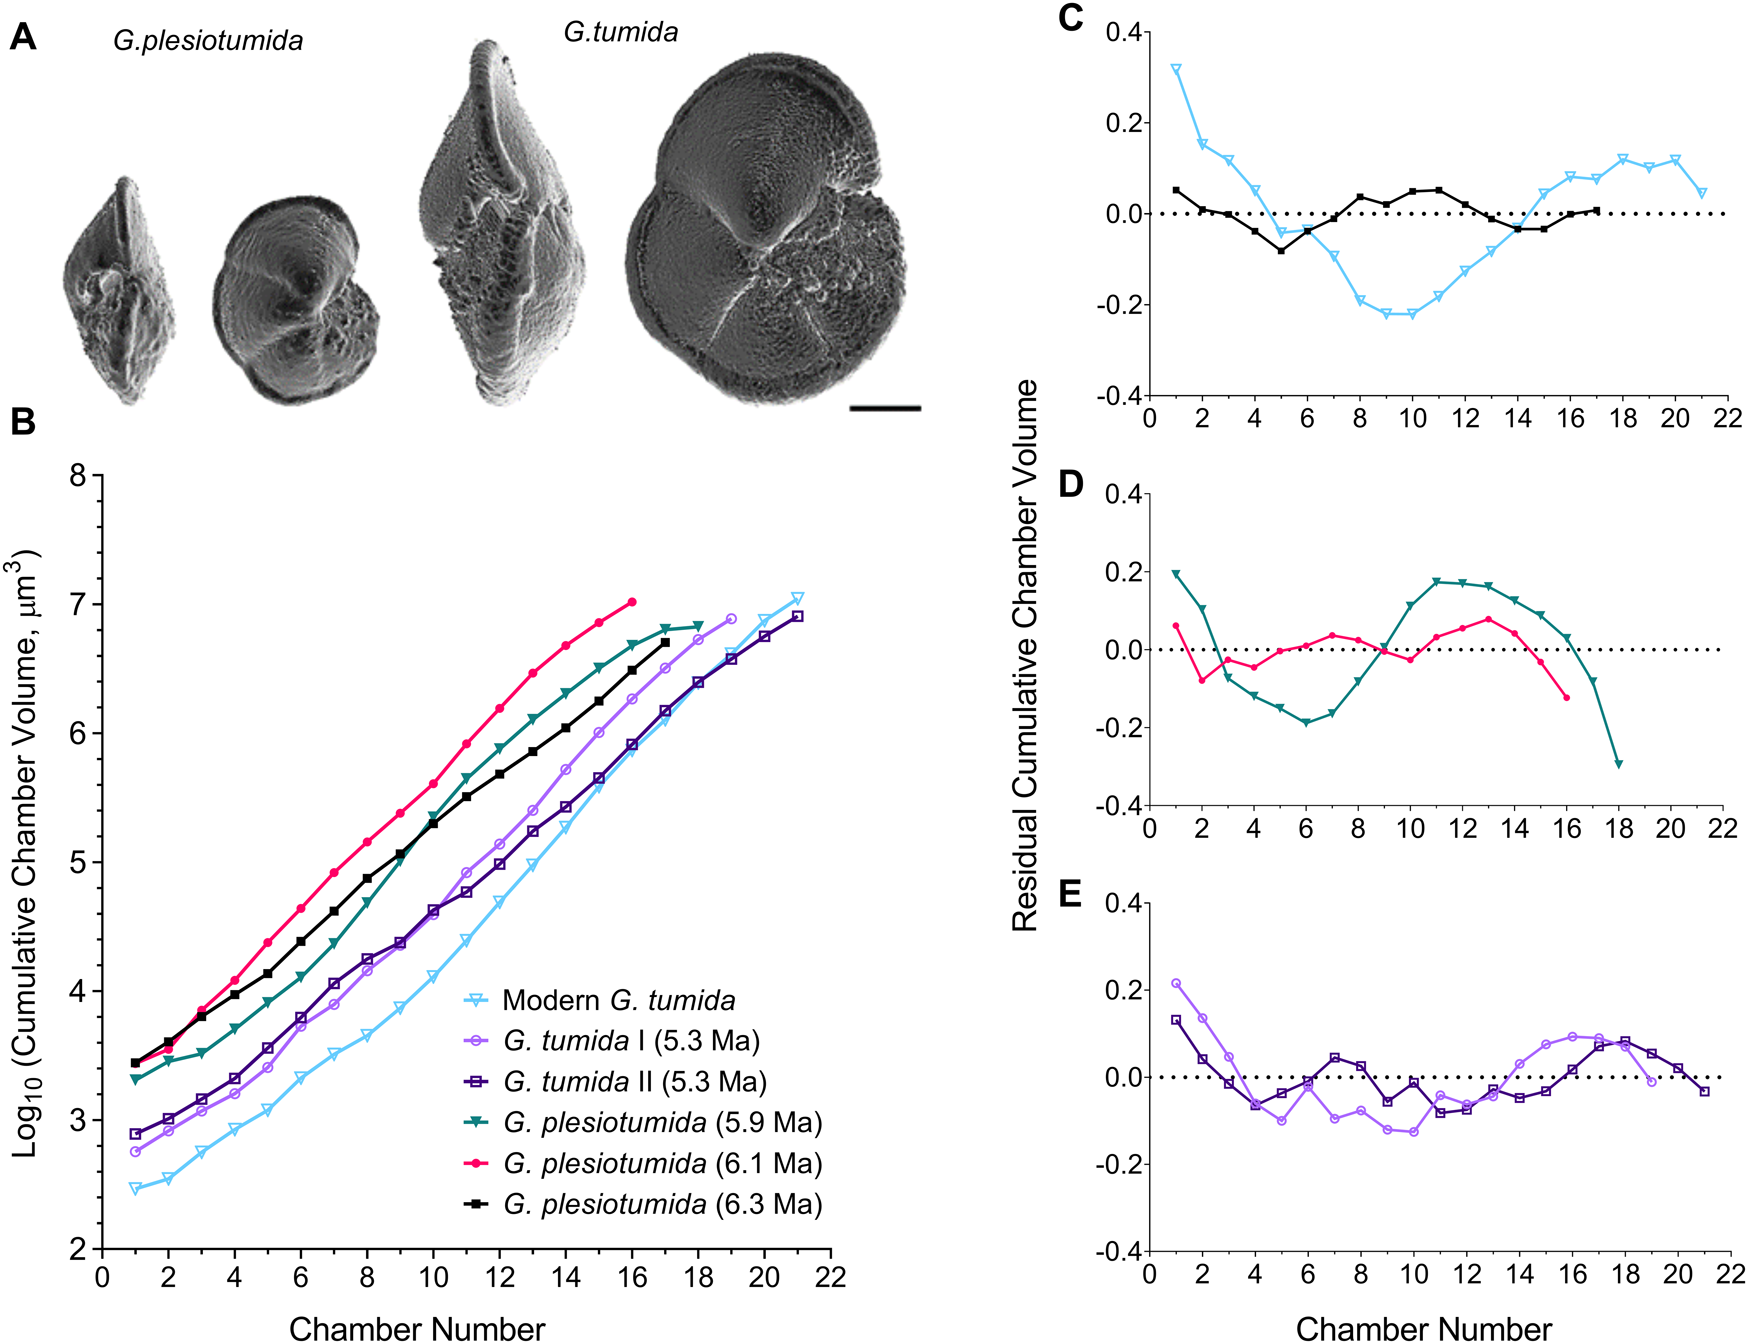
Figure 1. A, Three-dimensional surface visualizations of typical ancestral Globorotalia plesiotumida and descendant Globorotalia tumida morphologies. Each specimen is shown in side view with the aperture visible (left) and in umbilical view (right). Scale bar, 100 μm. B, Change in cumulative chamber volume throughout ontogeny in five specimens during the G. plesiotumida–tumida transition interval (PTT; 6.3–5.3 Ma) and one modern specimen from Caromel et al. (Reference Caromel, Schmidt, Fletcher and Rayfield2016); all trajectories have been obtained from synchrotron X-ray microtomography scans. C–E, Change in growth rate, expressed as linear regression residuals of log10-transformed cumulative chamber volume against chamber number for (C) a G. plesiotumida specimen at the start of the PTT and a modern G. tumida specimen; four specimens identified as (D) G. plesiotumida and (E) G. tumida throughout the PTT. The dotted line in C–E represents log-linear regression line.
The morphological evolution of planktic foraminifera is influenced by global changes in temperature and productivity (reviewed in Schmidt et al. [Reference Schmidt, Renaud, Bollmann, Schiebel and Thierstein2004]), though local environmental conditions can modulate this response (Schmidt et al. Reference Schmidt, Caromel, Seki, Rae and Renaud2016). These organisms are passive feeders, meaning that their capacity to encounter and metabolize a food source is directly related to their external surface area (Anderson et al. Reference Anderson, Spindler, Bé and Hemleben1979). The transition within the G. plesiotumida–tumida lineage is set against a late Miocene cooling trend, which is characterized by an increase in surface-water stratification and a subsequent drop in primary productivity (Vincent and Berger Reference Vincent, Berger, Broecker and Sundquist1985; Behrenfeld et al. Reference Behrenfeld, O'Malley, Siegel, McClain, Sarmiento, Feldman and Milligan2006). Larger temperature gradients lead to a proliferation of available niches and thus reduce competition for resources among foraminiferal species (Schmidt et al. Reference Schmidt, Renaud, Bollmann, Schiebel and Thierstein2004; Seears et al. Reference Seears, Darling and Wade2012). The modern G. tumida is a deep-dwelling herbivore that reaches its adulthood below 100 m after a period of growth in the surface layers (Schweitzer and Lohmann Reference Schweitzer and Lohmann1991). It is likely that the ancestral G. plesiotumida underwent development in the same part of the water column but was subject to a more productive environment with sharper thermoclines in comparison to the descendant, G. tumida.
Here we employ a combination of high-resolution SXRTM and X-ray microtomography (microCT) to investigate whether speciation is associated with (1) a shift in developmental trajectories and (2) an increase in developmental plasticity, as per Jackson (Reference Jackson2020), using the transition from G. plesiotumida to its descendant, G. tumida, at the Miocene/Pliocene boundary as a case study. Specifically, we focus on change in the internal volume due to its importance in reproduction. In line with earlier studies (Malmgren et al. Reference Malmgren, Berggren and Lohmann1983; Hull and Norris Reference Hull and Norris2009), we would expect to find evidence for either anagenetic or cladogenetic speciation within this lineage. We use the largest sample of specimens reconstructed within a single lineage to date to estimate the overall variation in growth trajectories per population at five time points from the late Miocene to the Recent. We first obtain chamber volume measurements from high-resolution reconstructions of five specimens throughout the transition interval using SXRTM. As the extent of within-species plasticity is rarely assessed in studies of ontogeny, we complement these reconstructions with microCT data from 63 specimens. In addition, we record the surface area, test size, and direction of coiling in our specimens to estimate change in metabolic demands and morphology within the lineage.
Materials
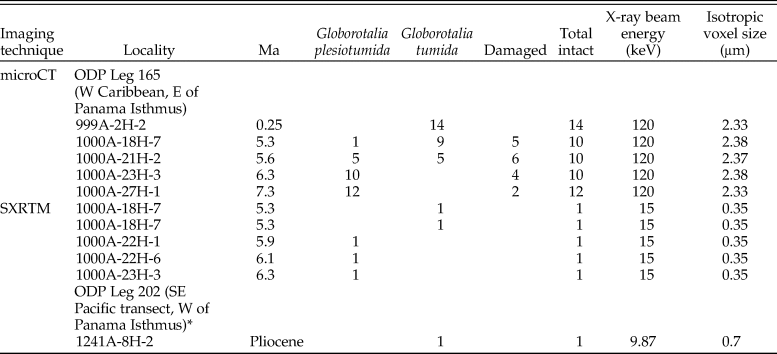
The transition from Globorotalia plesiotumida to Globorotalia tumida close to the Miocene/Pliocene boundary is diachronous in character across the Atlantic and Indo-Pacific populations. For the purpose of this study, the interval was defined as 6.3–5.3 Ma, in accordance with Hull and Norris (Reference Hull and Norris2009) and Schmidt et al. (Reference Schmidt, Caromel, Seki, Rae and Renaud2016); the transition is abbreviated to “PTT” throughout the article. All specimens were obtained from Leg 165 of the Ocean Drilling Project (ODP) in the western Caribbean. Samples from Site 1000 (16°33.223′N, 79°52.044′W; Shipboard Scientific Party 1997b) were older than 4.80 Ma, while the nearby Site 999 (12°44.639′N, 78°44.360′W; Shipboard Scientific Party 1997a) supplied younger specimens (<4.80 Ma); see Table 1 for further details. Both sites have been used extensively in paleoclimatology studies over the last decade, resulting in an excellent characterization of the environment (Seki et al. Reference Seki, Foster, Schmidt, Mackensen, Kawamura and Pancost2010, Reference Seki, Schmidt, Schouten, Hopmans, Sinninghe Damsté and Pancost2012; Schmidt et al. Reference Schmidt, Caromel, Seki, Rae and Renaud2016). The specimens were identified as belonging to the Globorotalia plesiotumida–tumida lineage due to the shape of their calcite tests, with chambers arranged in a low spire and a maximum of six chambers in the final whorl (Kennett and Srinivasan Reference Kennett and Srinivasan1983). A previously reconstructed specimen of modern G. tumida from the Pacific side of the Isthmus of Panama (Caromel et al. Reference Caromel, Schmidt, Fletcher and Rayfield2016) was also included in the analysis to illustrate how loss of habitat connectivity has affected development within the lineage. The exchange between eastern equatorial Pacific and Caribbean waters gradually decreased from 8 Ma to 5 Ma due to the closure of the Central American Seaway (O'Dea et al. Reference O'Dea, Lessios, Coates, Eytan, Restrepo-Moreno, Cione and Collins2016), which led to shape divergence in G. tumida populations (Schmidt et al. Reference Schmidt, Caromel, Seki, Rae and Renaud2016).
Table 1. Locality (presented as site, then hole-core-section), age, and specimen numbers of Globorotalia plesiotumida–tumida samples used for population-level analysis. X-ray microtomography (microCT) and synchrotron X-ray microtomography (SXRTM) specifications included. The specimen marked with an asterisk (*) was reconstructed as part of Caromel et al. (Reference Caromel, Schmidt, Fletcher and Rayfield2016). All specimens have been putatively assigned to either G. plesiotumida or G. tumida.
Methods
We used a combination of SXRTM and microCT to characterize developmental change throughout the history of Globorotalia plesiotumida–tumida lineage.
Reconstructions of Ontogenies Using High-Resolution SXRTM
A sequence of five specimens of G. tumida and G. plesiotumida during the transition were selected for SXRTM at the TOMCAT beamline tomography station (Stampanoni et al. Reference Stampanoni, Groso, Isenegger, Mikuljan, Chen, Bertrand and Henein2006) at the Swiss Light Source, Paul Scherrer Institute, Villigen, Switzerland. The tomographic volume of each specimen, scanned at a resolution of 0.35 μm per voxel, was reconstructed on-site and stored as TIFF files following the methodology established in Schmidt et al. (Reference Schmidt, Rayfield, Cocking and Marone2013); see Table 1 for SXRTM specifications. The stacks of TIFF files were imported into the analytic software, Avizo v. 8.1 (FEI Visualization Sciences Group, Hillsboro, OR, USA, www.vsg3d.com) and visualized as isosurfaces for preliminary characterization of morphology. The G. tumida specimens could be distinguished from the ancestral G. plesiotumida by an increase in size and the characteristic teardrop shape they acquire due to a pronounced thickening in the final whorl (Chaisson and Leckie Reference Chaisson, Leckie, Sigurdsson, Leckie and Acton1993); see Figure 1A for illustration of morphological differences. Chamber-by-chamber reconstructions of ontogeny in three specimens identified as G. plesiotumida (at 6.3, 6.1, and 5.9 Ma) and two as G. tumida (at 5.3 Ma) were performed in Avizo. The internal cavity of each chamber was manually isolated as a separate unit, and any residual sediment within the chamber was assigned to the cavity using a thresholding function in Avizo. The cumulative chamber volume, that is, the individual chamber volume combined with that of all chambers preceding it, was calculated starting with the first chamber, or proloculus. The cumulative volume obtained after the addition of the final chamber represented the total cumulative volume of each specimen. To better illustrate the change in growth rate throughout ontogeny, we mapped the residuals of linear regression between log10-transformed cumulative chamber volume and chamber number for each specimen following Brummer et al. (Reference Brummer, Hemleben and Spindler1987) and Burke et al. (Reference Burke, Renema, Schiebel and Hull2019). The modern G. tumida is characterized by an S-shaped trajectory whereby the growth rate decreases at the beginning of development, then starts to increase in the middle of the trajectory, until it drops again for the last few chambers (Burke et al. Reference Burke, Renema, Schiebel and Hull2019). We also recorded the cumulative surface area of volume reconstructions at each chamber addition and the corresponding change in surface area to volume ratios (SA:Vs) throughout ontogeny. The internal volume of an organism increases at a faster rate than its surface area, which means that the expansion in volume might come at the cost of metabolic efficiency. Finally, we measured the total length of the test in the side view of each reconstruction and noted whether the specimen was sinistral or dextral, that is, left-coiling or right-coiling.
Population-Level Analysis Using a Combination of MicroCT and SXRTM
The high resolution of an SXRTM scan enables visualization of chamber morphology in great detail (Schmidt et al. Reference Schmidt, Rayfield, Cocking and Marone2013); however, a single reconstruction might not be representative of the mean growth trajectory within a population. To estimate the extent of plasticity in each sample, we required a high-throughput approach of lower resolution that still permitted quantitative analysis of all the chambers in the ontogenetic trajectory. We therefore selected a set of five samples at 7.3 (in advance of the PTT), 6.3, 5.6 and 5.3 (during the PTT), and 0.25 Ma (representing the modern G. tumida morphology) for microCT scans at resolutions of 2.33–2.38 μm per voxel (see Table 1 for microCT specifications). Dried sample residues were split into aliquots to obtain at least 16 specimens per sample. A sample at 5.6 Ma was selected to represent the middle of the PTT, because it contained higher numbers of specimens belonging to the lineage compared with earlier samples at 6.1 and 5.9 Ma from which the two SXRTM specimens were sourced. Both SXRTM reconstructions were included in this sample in further analyses. To exclude specimens that had not reached maturity, only specimens from the size fraction >150 μm were used (Sverdlove and Bé Reference Sverdlove and Bé1985). Each sample was mounted upon a layer of double-sided sticky tape covering a pipette tip cut at a 45° angle to minimize overlap among specimens in the resulting scans. Specimens were scanned for 20 minutes using a Nikon XT H 225ST CT Scanner (Nikon Metrology, Brighton, MI, USA, www.nikonmetrology.com) with a 225 kV reflection target. The tomographic volume of each sample was reconstructed on-site from X-ray projections over a range of angular views and stored in TIFF format. The stacks of TIFF files were imported into Avizo, and all samples were reviewed to exclude damaged specimens. The chamber number counts, cumulative chamber volume, and surface area were obtained in Avizo following the methodology established for the SXRTM specimens. To estimate the mean growth trajectory in each population, we calculated the geometric mean of cumulative chamber volumes for all specimens per sample at a given chamber addition, where more than three specimens were available for calculation. Specimens with missing or significantly damaged chamber walls due to internal dissolution (n = 10) were not reconstructed, while specimens with external damage to the test (n = 7) were reconstructed up to the last intact chamber. We also recorded the total length of the test and the coiling direction of all specimens. Overall, we obtained chamber-by-chamber reconstructions for 68 specimens, including 5 specimens from the SXRTM analysis (all measurements available as part of the Supplementary Material).
Results
First Look at Developmental Change within the Lineage Using SXRTM
We first reconstructed developmental trajectories and assessed change in growth rate in five specimens throughout the PTT using high-resolution SXRTM scans. The trajectories of change in cumulative chamber volume indicate a shift to a smaller first chamber in the descendant G. tumida compared with the ancestral G. plesiotumida (Fig. 1B). The reduction in volume of the early growth stages in specimens at 5.3 Ma is accompanied by an increase in chamber number and no drop in the final cumulative volume compared with earlier specimens. The modern specimen from the Pacific side of the Isthmus of Panama exhibits the smallest proloculus and the longest developmental trajectory within the lineage. The analysis of the residual cumulative chamber volumes shows that the pattern of growth is markedly different in the ancestral species compared with its modern descendant (Fig. 1C). In contrast to the S-shaped trajectory observed in modern G. tumida, the growth in the oldest specimen of G. plesiotumida is characterized by low residual variance in volume with no clear trend. As illustrated in Figure 1D,E, this flat growth pattern also characterizes G. plesiotumida at 6.1 Ma and G. tumida specimens at the end of the PTT. The specimen at 5.9 Ma is the only one that exhibits a distinctive S-shaped trajectory.
Population-Level Analysis
We then performed analysis of a sample of 68 specimens to determine whether the developmental change described earlier is representative of each population. We find that developmental trajectories and their corresponding SA:Vs exhibit plasticity throughout the history of the lineage (Figs. 2, 3). The distribution of data from all specimens indicates that populations during the PTT encompass a wide variety of trajectories with no clear trend—which contrasts with the populations outside this interval. The trajectories at 0.25 Ma exhibit low residual variance throughout growth (Fig. 2F), whereas most specimens at 7.3 Ma are characterized by an S-shaped change in growth rate (Fig. 2J). The small sample of SXRTM specimens does not reflect the mean trajectories we obtain from the population-level analysis. This highlights the need for sufficient sample sizes in studies of ontogeny in the fossil record. Our summary of growth trajectories indicates that samples at 5.6 and 5.3 Ma exhibit larger—rather than smaller—cumulative volumes earlier in their development compared with the other study populations (Fig. 4A). The mean trajectory of the most recent G. tumida population maps more closely to the ancestral trajectory at 6.3 Ma and not to the population of G. tumida at the end of the PTT. The similarity persists until chamber 13, when growth in the ancestral population slows down in comparison to the descendant. The residuals of the mean cumulative volumes indicate that all populations within the lineage exhibit S-shaped shifts in growth rate rather than the flat trajectories observed in the SXRTM sample (Fig. 4B). The population at 5.6 Ma has a distinct trajectory, with rapid growth at the start of development, followed by a sharp decline after reaching chamber 12. While a similar, but less steep growth curve also characterizes the population at 5.3 Ma, such extreme shifts in growth rate are not observed in the other samples. In addition, populations at 5.6 and 5.3 Ma exhibit lower SA:Vs in early ontogeny compared with the other samples, indicating that a sustained increase in volume is metabolically demanding (Fig. 4C).
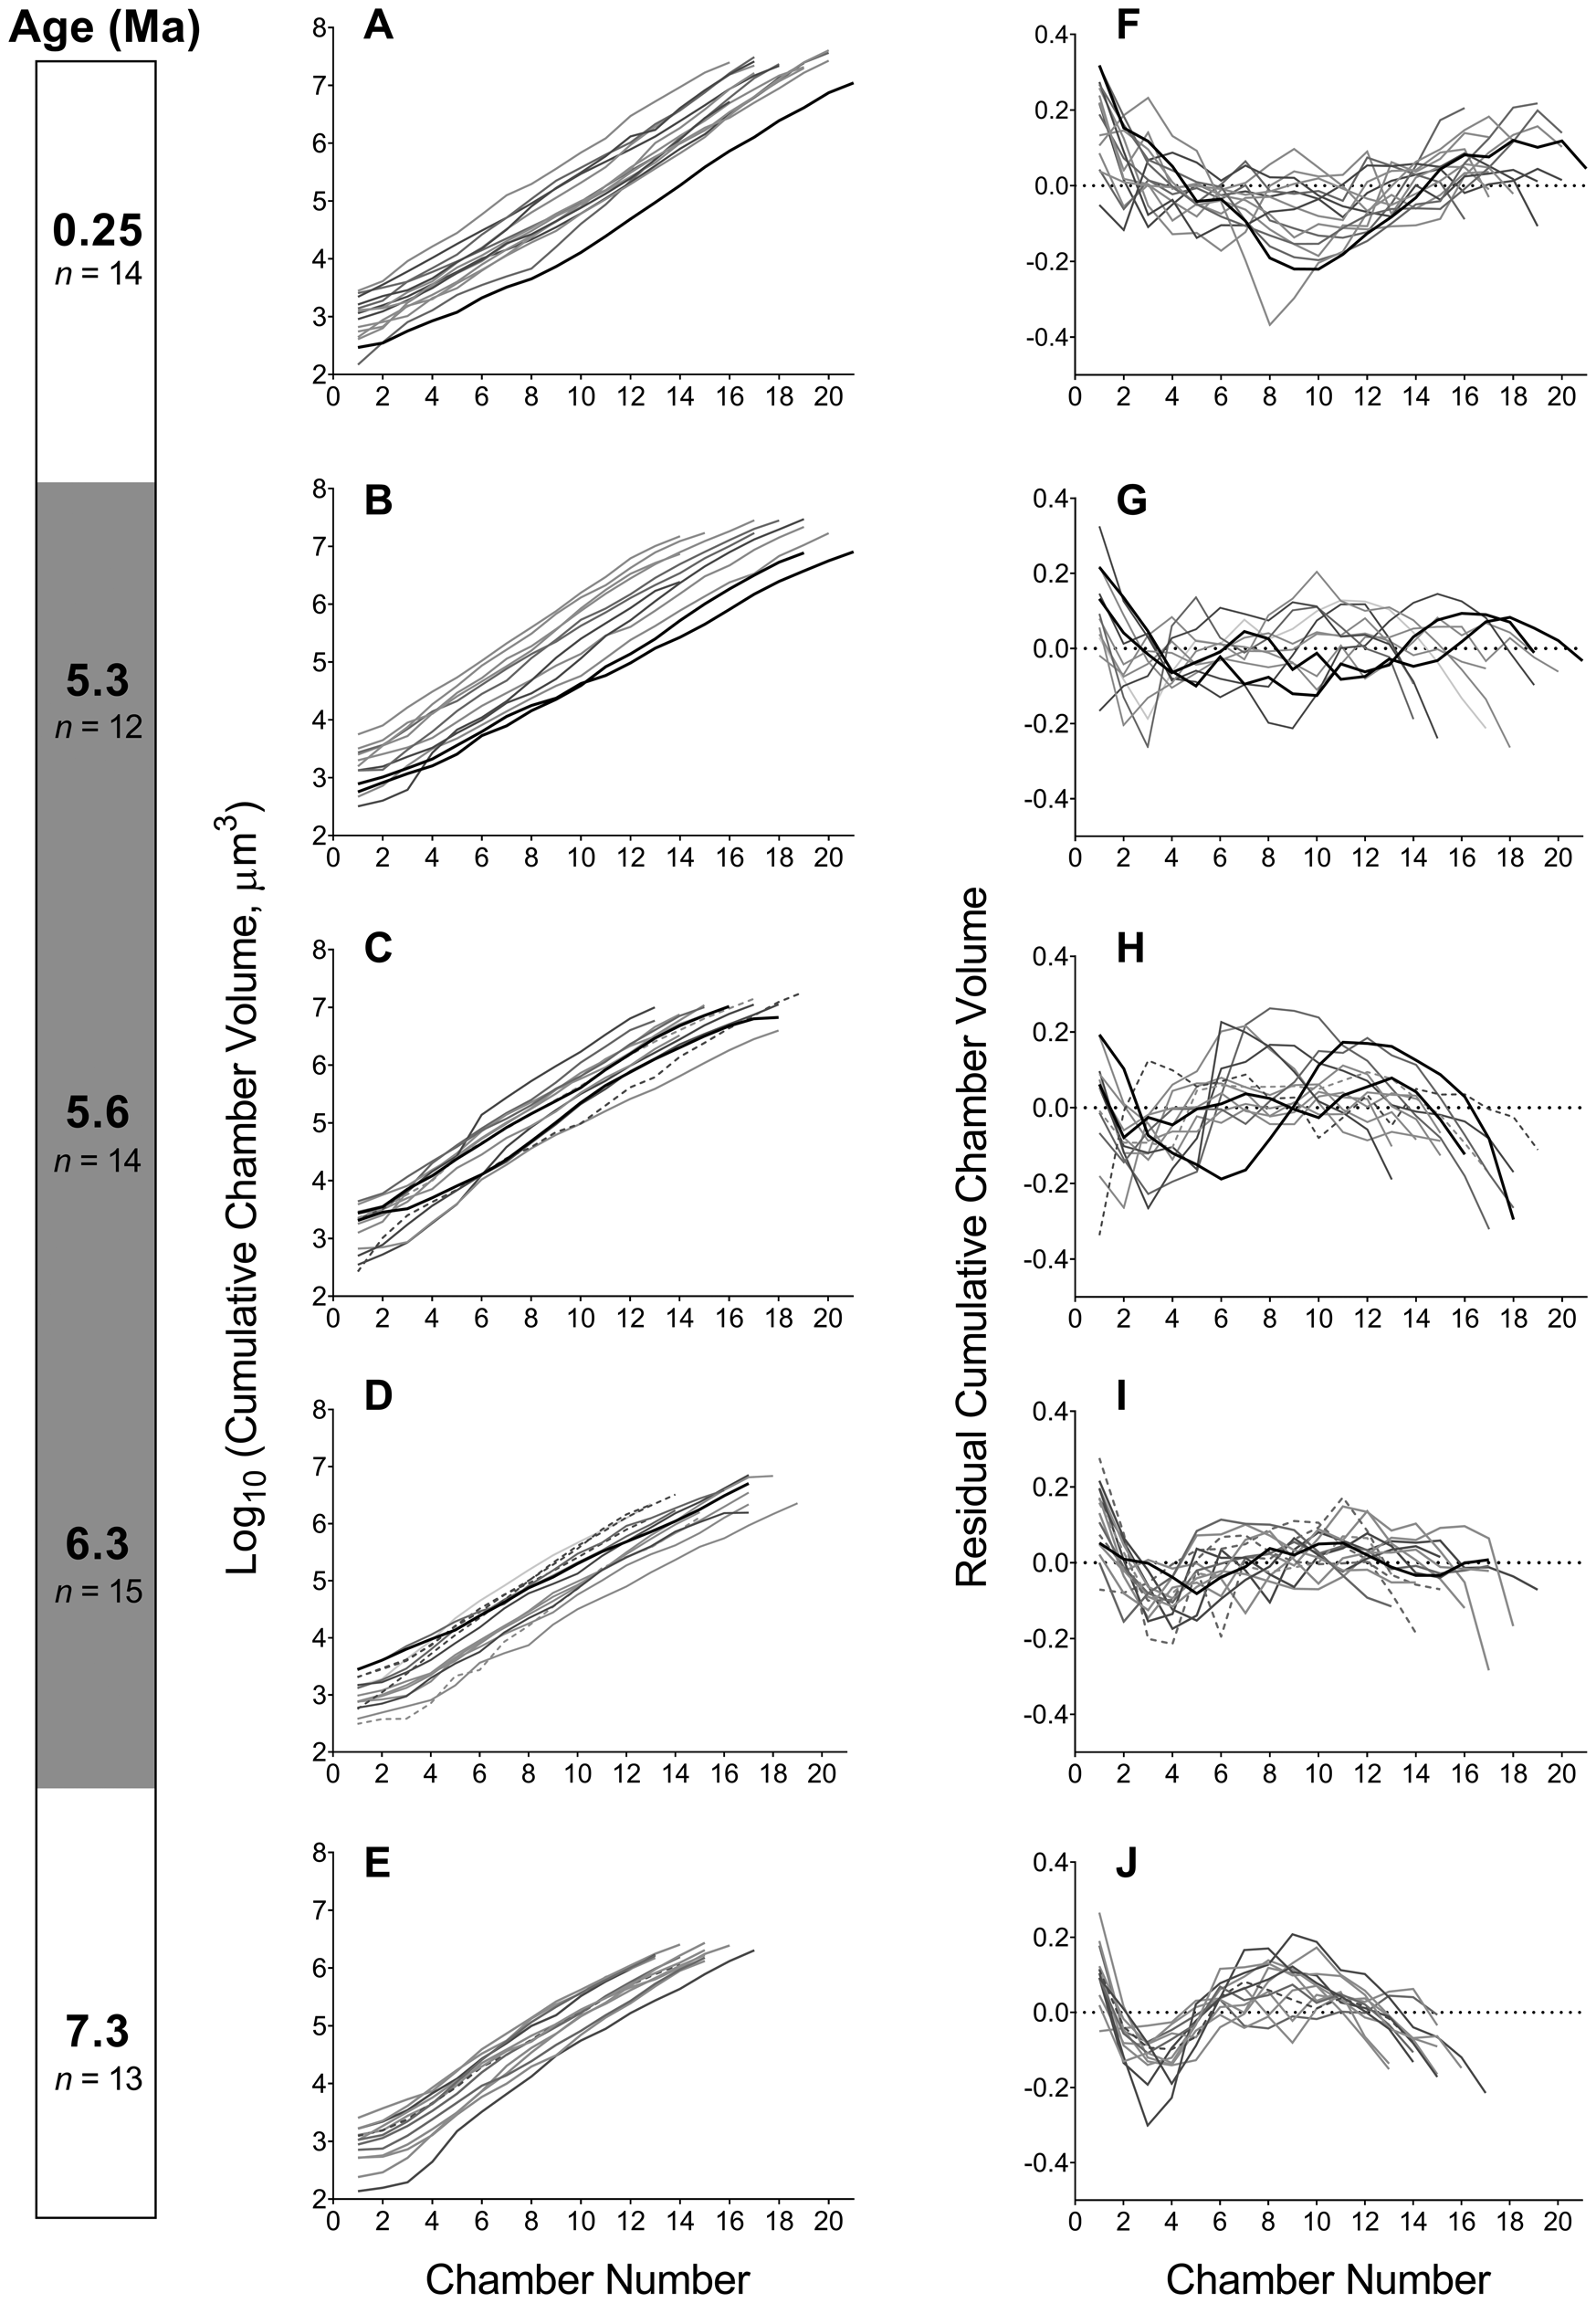
Figure 2. A–E, Trajectories of change in the cumulative chamber volume at each chamber addition in five samples throughout the history of the Globorotalia plesiotumida–tumida lineage. Both intact (n = 61) and externally damaged (n = 7) specimens included. F–J, Trajectories of change in growth rate expressed as linear regression residuals of log10-transformed cumulative chamber volume against chamber number. The trajectories of damaged specimens are marked with dashed lines; specimens reconstructed using synchrotron X-ray microtomography are marked with black lines. A previously reconstructed specimen of G. tumida from Caromel et al. (Reference Caromel, Schmidt, Fletcher and Rayfield2016) was included in the most recent sample (0.25 Ma) for illustrative purposes but was not used in further analyses. The dotted line in F–J represents the log-linear regression line. The gray shading of the age bar represents the G. plesiotumida–tumida transition interval (PTT).
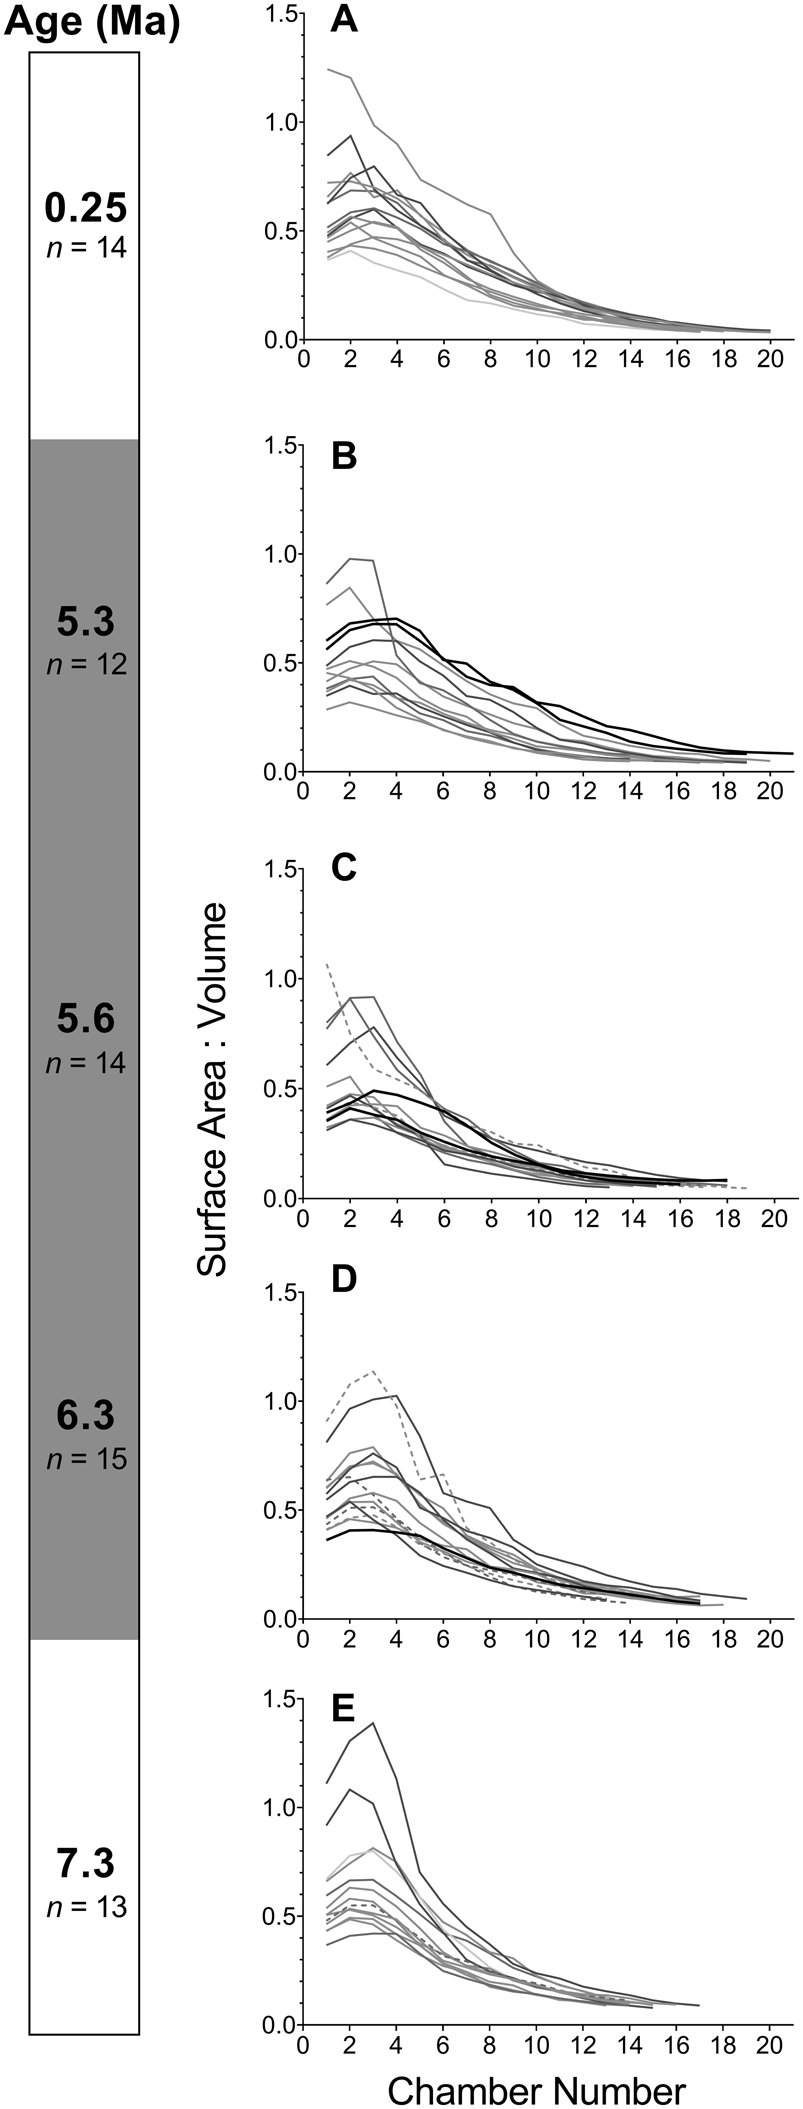
Figure 3. A–E, Trajectories of change in the surface area to volume ratio (SA:V) at each chamber addition in five samples throughout the history of the Globorotalia plesiotumida–tumida lineage; both SA and V represent cumulative values. Both intact (n = 61) and externally damaged (n = 7) specimens included. The trajectories of damaged specimens are marked with dashed lines; specimens reconstructed using synchrotron X-ray microtomography are marked with black lines. The gray shading of the age bar represents the G. plesiotumida–tumida transition interval (PTT).
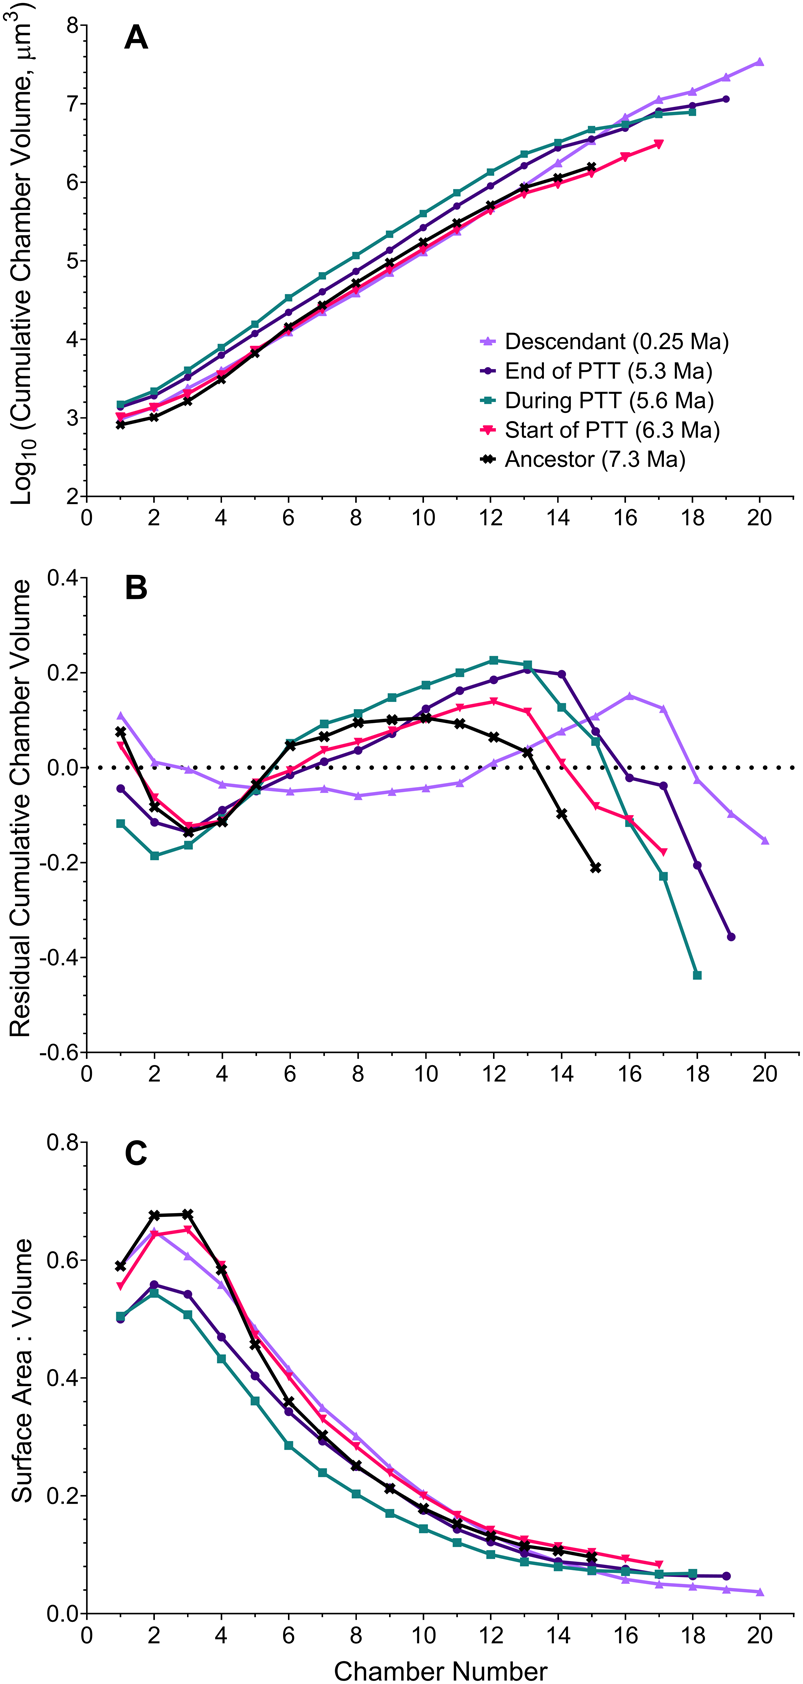
Figure 4. A, Mean change in cumulative chamber volume throughout ontogeny in five populations throughout the history of the Globorotalia plesiotumida–tumida lineage. Each value represents the geometric mean of cumulative chamber volumes of all specimens per sample at a given chamber addition (depicted in full in Fig. 2A–E) with more than three specimens available. B, Mean change in growth rate, expressed as log-linear regression residuals of mean cumulative chamber volume against chamber number (residuals of individual growth trajectories depicted in Fig. 2F–J). The dotted line represents log-linear regression line. C, Mean trajectories of change in the surface area to volume ratio (SA:V) at each chamber addition. Each value represents the mean SA:V of all specimens per sample at a given chamber addition with more than three specimens available (depicted in full in Fig. 3). PTT, G. plesiotumida–tumida transition.
The mid-PTT sample at 5.6 Ma also exhibits a distinct profile with regard to the chamber number and coiling direction (Fig. 5). While the mean chamber number in the lineage does increase from 14.6 at 7.3 Ma to 18 in the most recent population, the mid-PTT sample is characterized by a more uniform distribution of chamber number and a lower mean compared with the sample preceding it. In addition, the specimens in the mid-PTT sample exhibit a switch to a dextral-coiling direction, even though the sample is preceded and followed by populations in which sinistrally coiled specimens dominate.
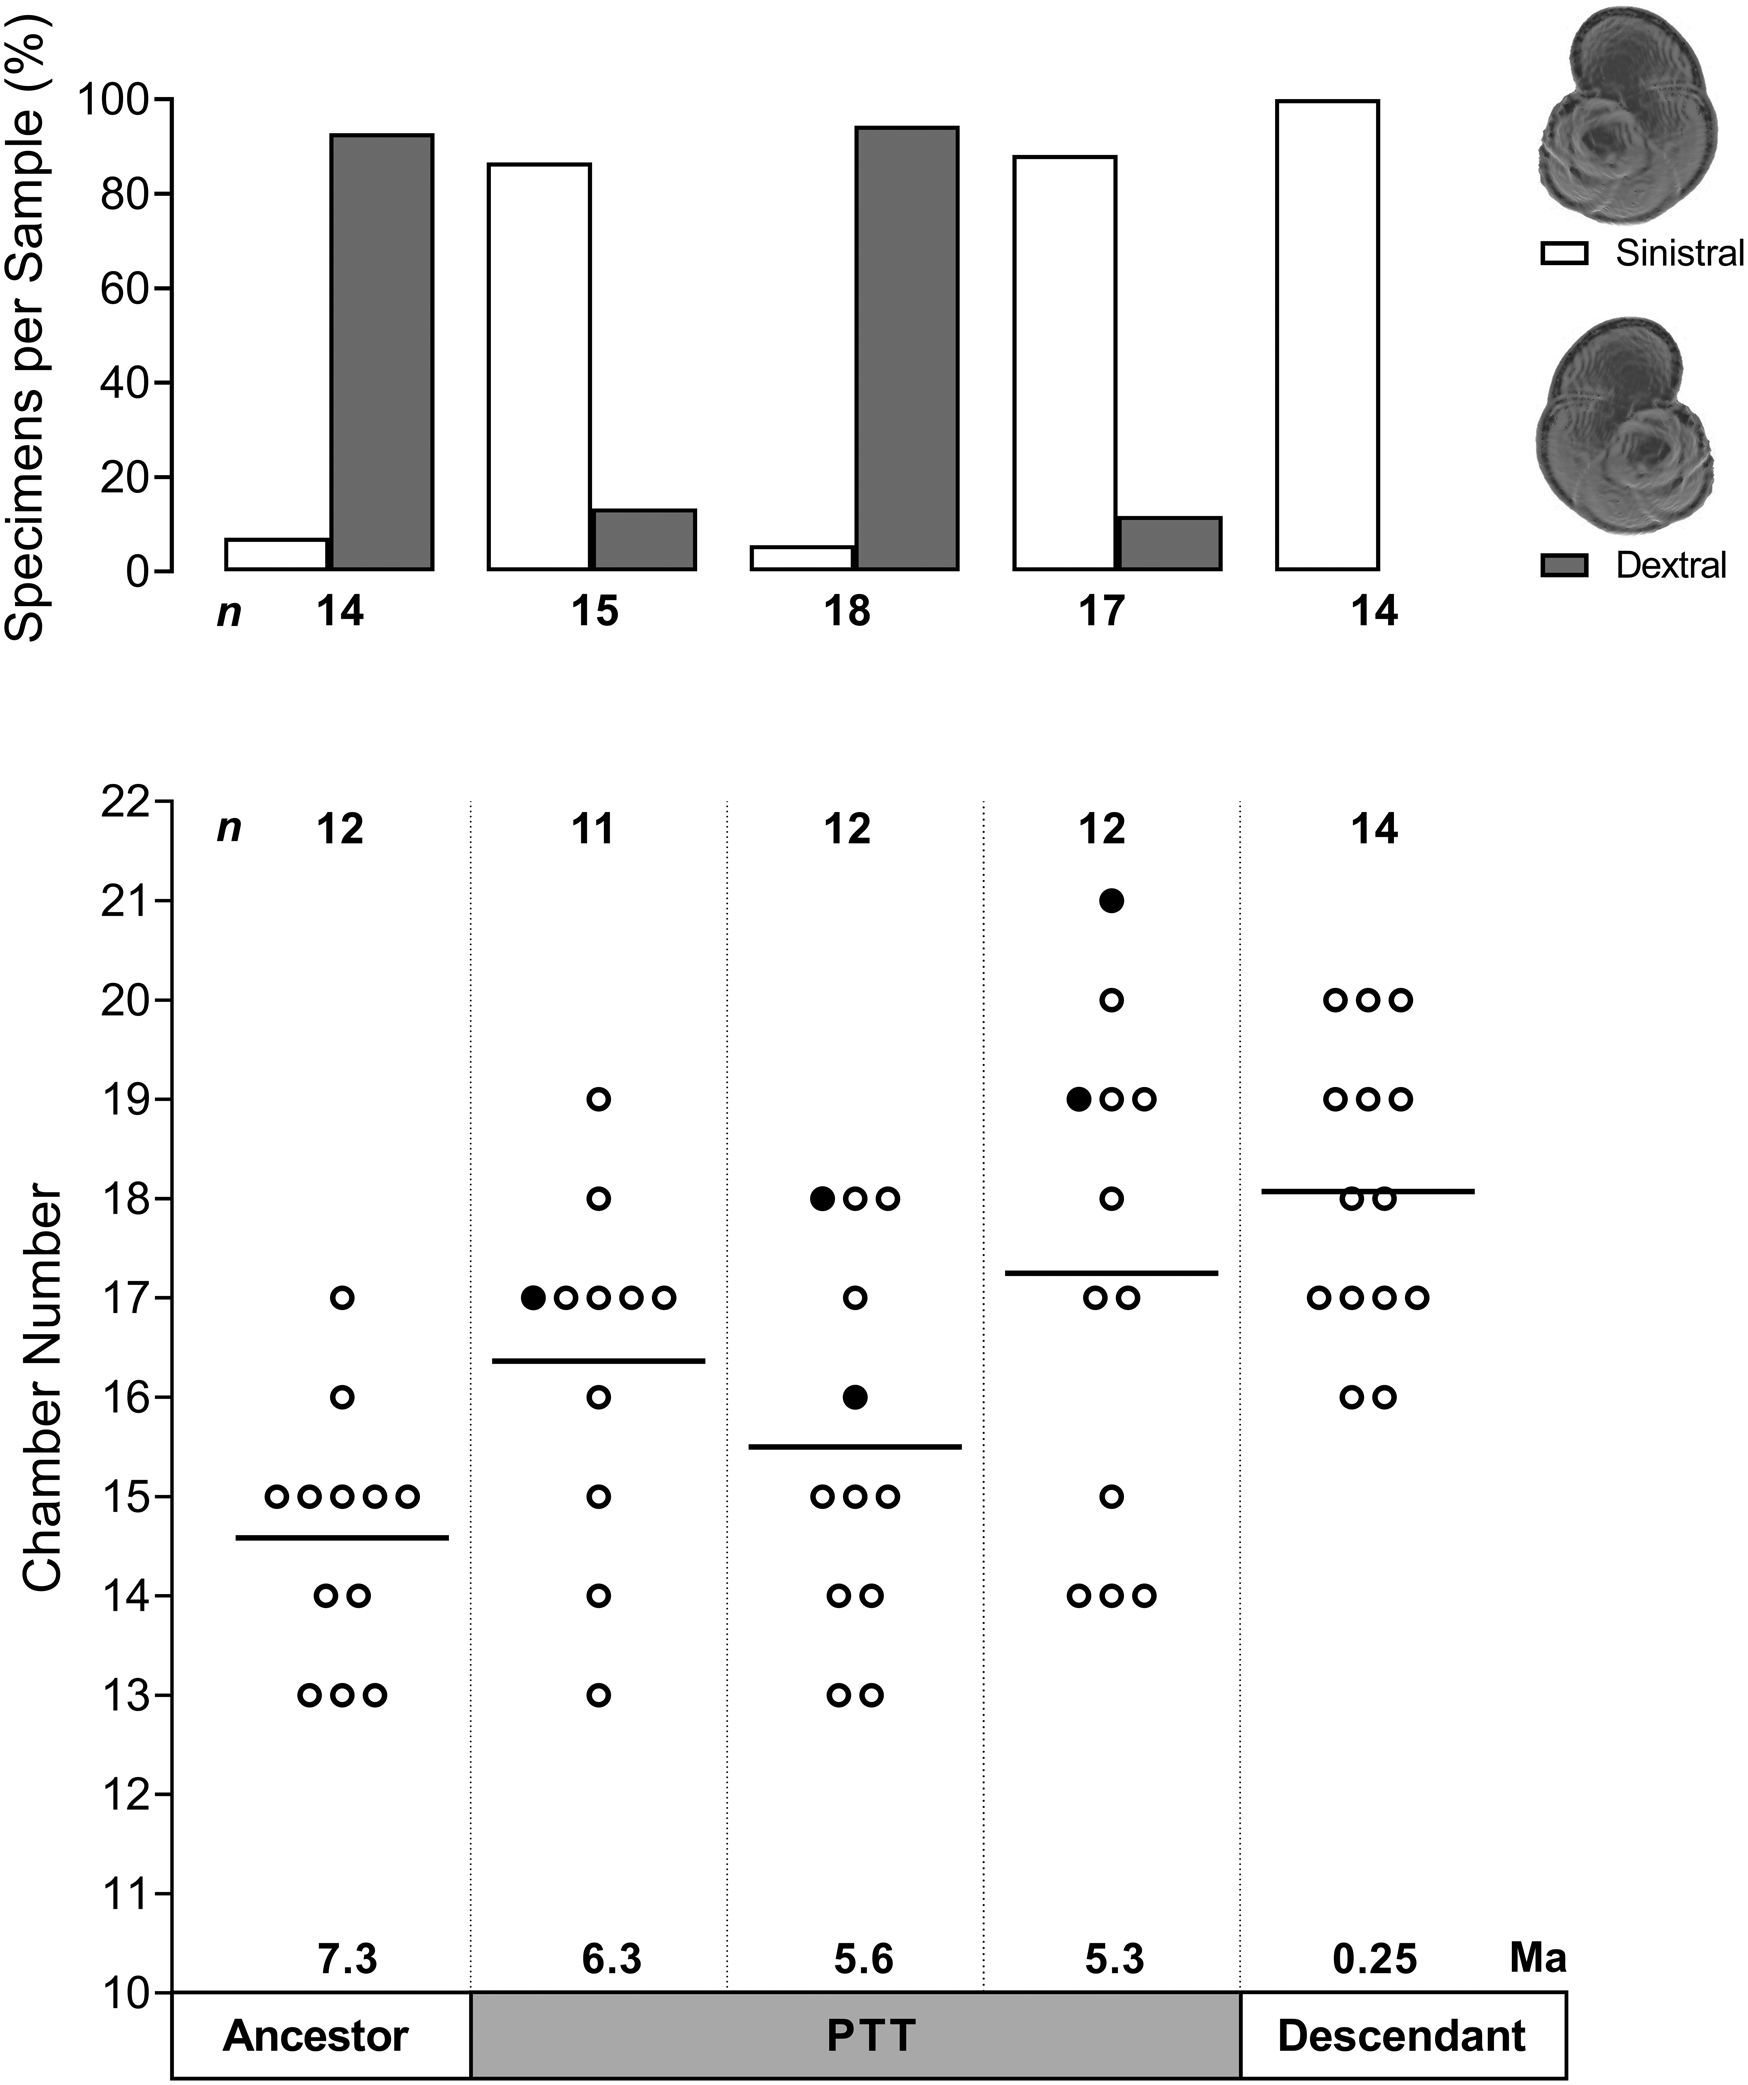
Figure 5. Coiling direction and chamber number in five populations throughout the history of the Globorotalia plesiotumida–tumida lineage. Top panel shows frequency distribution of specimens exhibiting sinistral or dextral coiling per sample; all specimens included (n = 78). Bottom panel shows chamber number counts per sample; solid black line represents the mean value, filled circles indicate specimens reconstructed using synchrotron X-ray microtomography; only intact specimens included (n = 61). PTT, G. plesiotumida–tumida transition.
The observed change in developmental trajectories across all study populations is reflected in other aspects of foraminiferal morphology. There is a strong positive association between test length and total cumulative volume, that is, the cumulative chamber volume after the addition of the last chamber (r 2 = 0.98, p < 0.001). The final volume increases throughout the history of the lineage in proportion to the cube of the test length (Fig. 6A; inset shows the length measurement taken). In addition, the sample at the end of the PTT includes one specimen that clusters with the ancestral population at 7.3 Ma (identified by a filled circle in Fig. 6), which might signify a divergence between the ancestral G. plesiotumida and its descendant G. tumida. Chamber number is a weak but significant predictor of volume (r 2 = 0.34, p < 0.001), with longer developmental trajectories generally associated with higher final volumes (Fig. 6B). Sinistrally coiled specimens have a significantly higher mean total volume compared with the dextral group (7.02 vs. 6.59, log10-transformed values; F 1,59 = 16.09, p < 0.001) because the two most recent populations exhibiting the highest volumes in the lineage are dominated by sinistral specimens (Fig. 5).
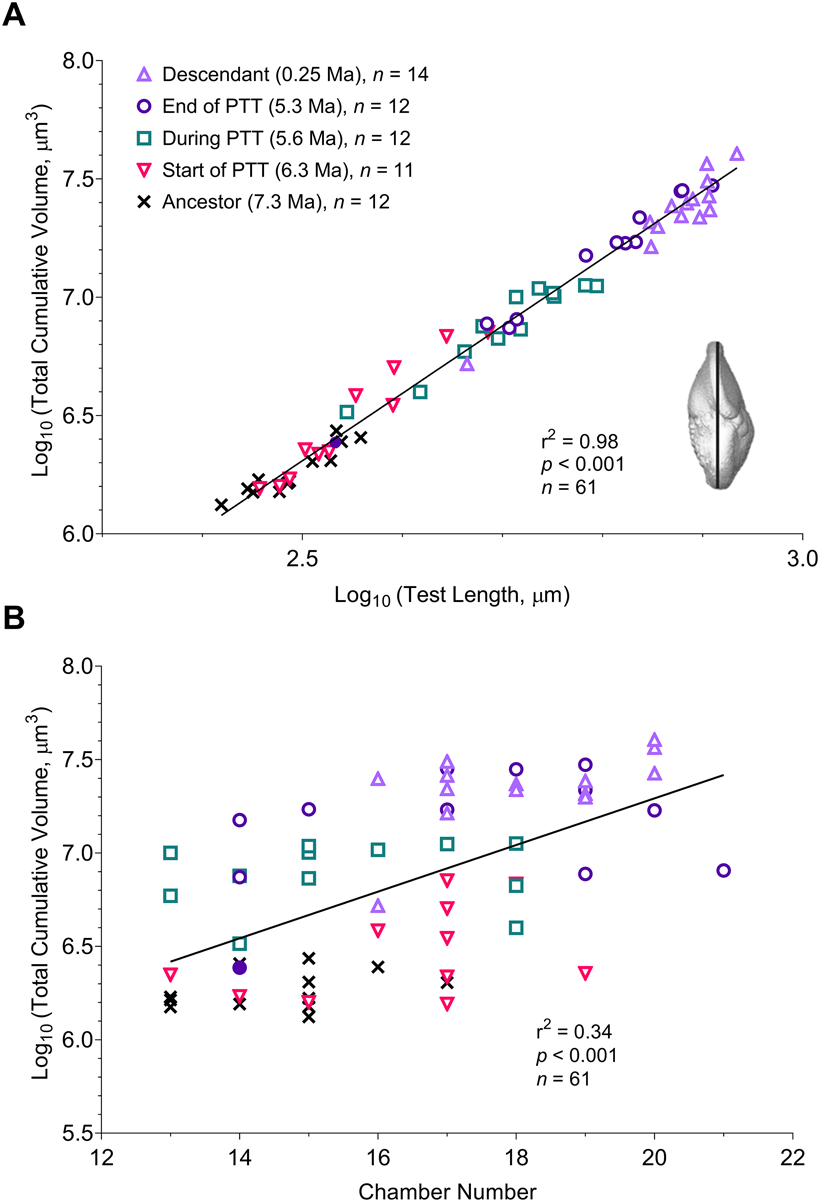
Figure 6. A, Change in total cumulative volume vs. test length in five populations throughout the history of the Globorotalia plesiotumida–tumida lineage. B, Change in total cumulative volume vs. chamber number across five study populations. Filled circle represents a single specimen from the 5.3 Ma sample that could be identified as an ancestral G. plesiotumida; only intact specimens included (n = 61). PTT, G. plesiotumida–tumida transition.
The box plots of variation in total cumulative volume show that the PTT is characterized by wider interquartile ranges, that is, higher variability, compared with the ancestral and descendant populations (Fig. 7A). The cumulative volume in all five populations is more variable early in development, that is, at prolocular and six-chamber stages, compared with the final stage of growth. The sample at the end of the PTT exhibits the largest range in values among all populations, which gives further support to a marked separation between the ancestral G. plesiotumida and its descendant. The removal of the specimen identified as G. plesiotumida from this sample (see Fig. 6) results in a normal distribution of the analysis of variance model residuals. We obtain significant differences in the log10-transformed total cumulative volume among five study populations (F 4,55 = 67.29, p < 0.001). A Tukey-Kramer post hoc test pinpoints the PTT as a period of significant developmental change marked by a shift to larger cumulative volumes. While the sample at the start of the PTT has a higher chamber number compared with the ancestral population of G. plesiotumida (Fig. 5), this increase does not translate into significantly higher cumulative volumes (p = 0.11). The mean volume of the mid-PTT population is significantly higher compared with the samples at 7.3 and 6.3 Ma (p < 0.001 in both cases) and lower compared with the samples at 5.3 (p < 0.01) and 0.25 Ma (p < 0.001). In contrast, the mean of the most recent population at 0.25 Ma is not significantly different from the sample at 5.3 Ma, even though they are separated by more than 5 Myr of evolutionary history (p = 0.38). There are no significant differences in prolocular volumes among all study populations (F 4,62 = 1.61, p = 0.18 all specimens; F 4,55 = 2.02, p = 0.11 only intact specimens), and we only start observing differences at the six-chamber mark (F 4,62 = 3.61, p < 0.05 all; F 4,55 = 3.7, p < 0.01 only intact). The rapid growth early in development in the mid-PTT sample (Fig. 4B) results in significantly larger volumes at the six-chamber mark compared with populations at 6.3 and 0.25 Ma (Tukey-Kramer test yields p < 0.05 with or without damaged specimens).
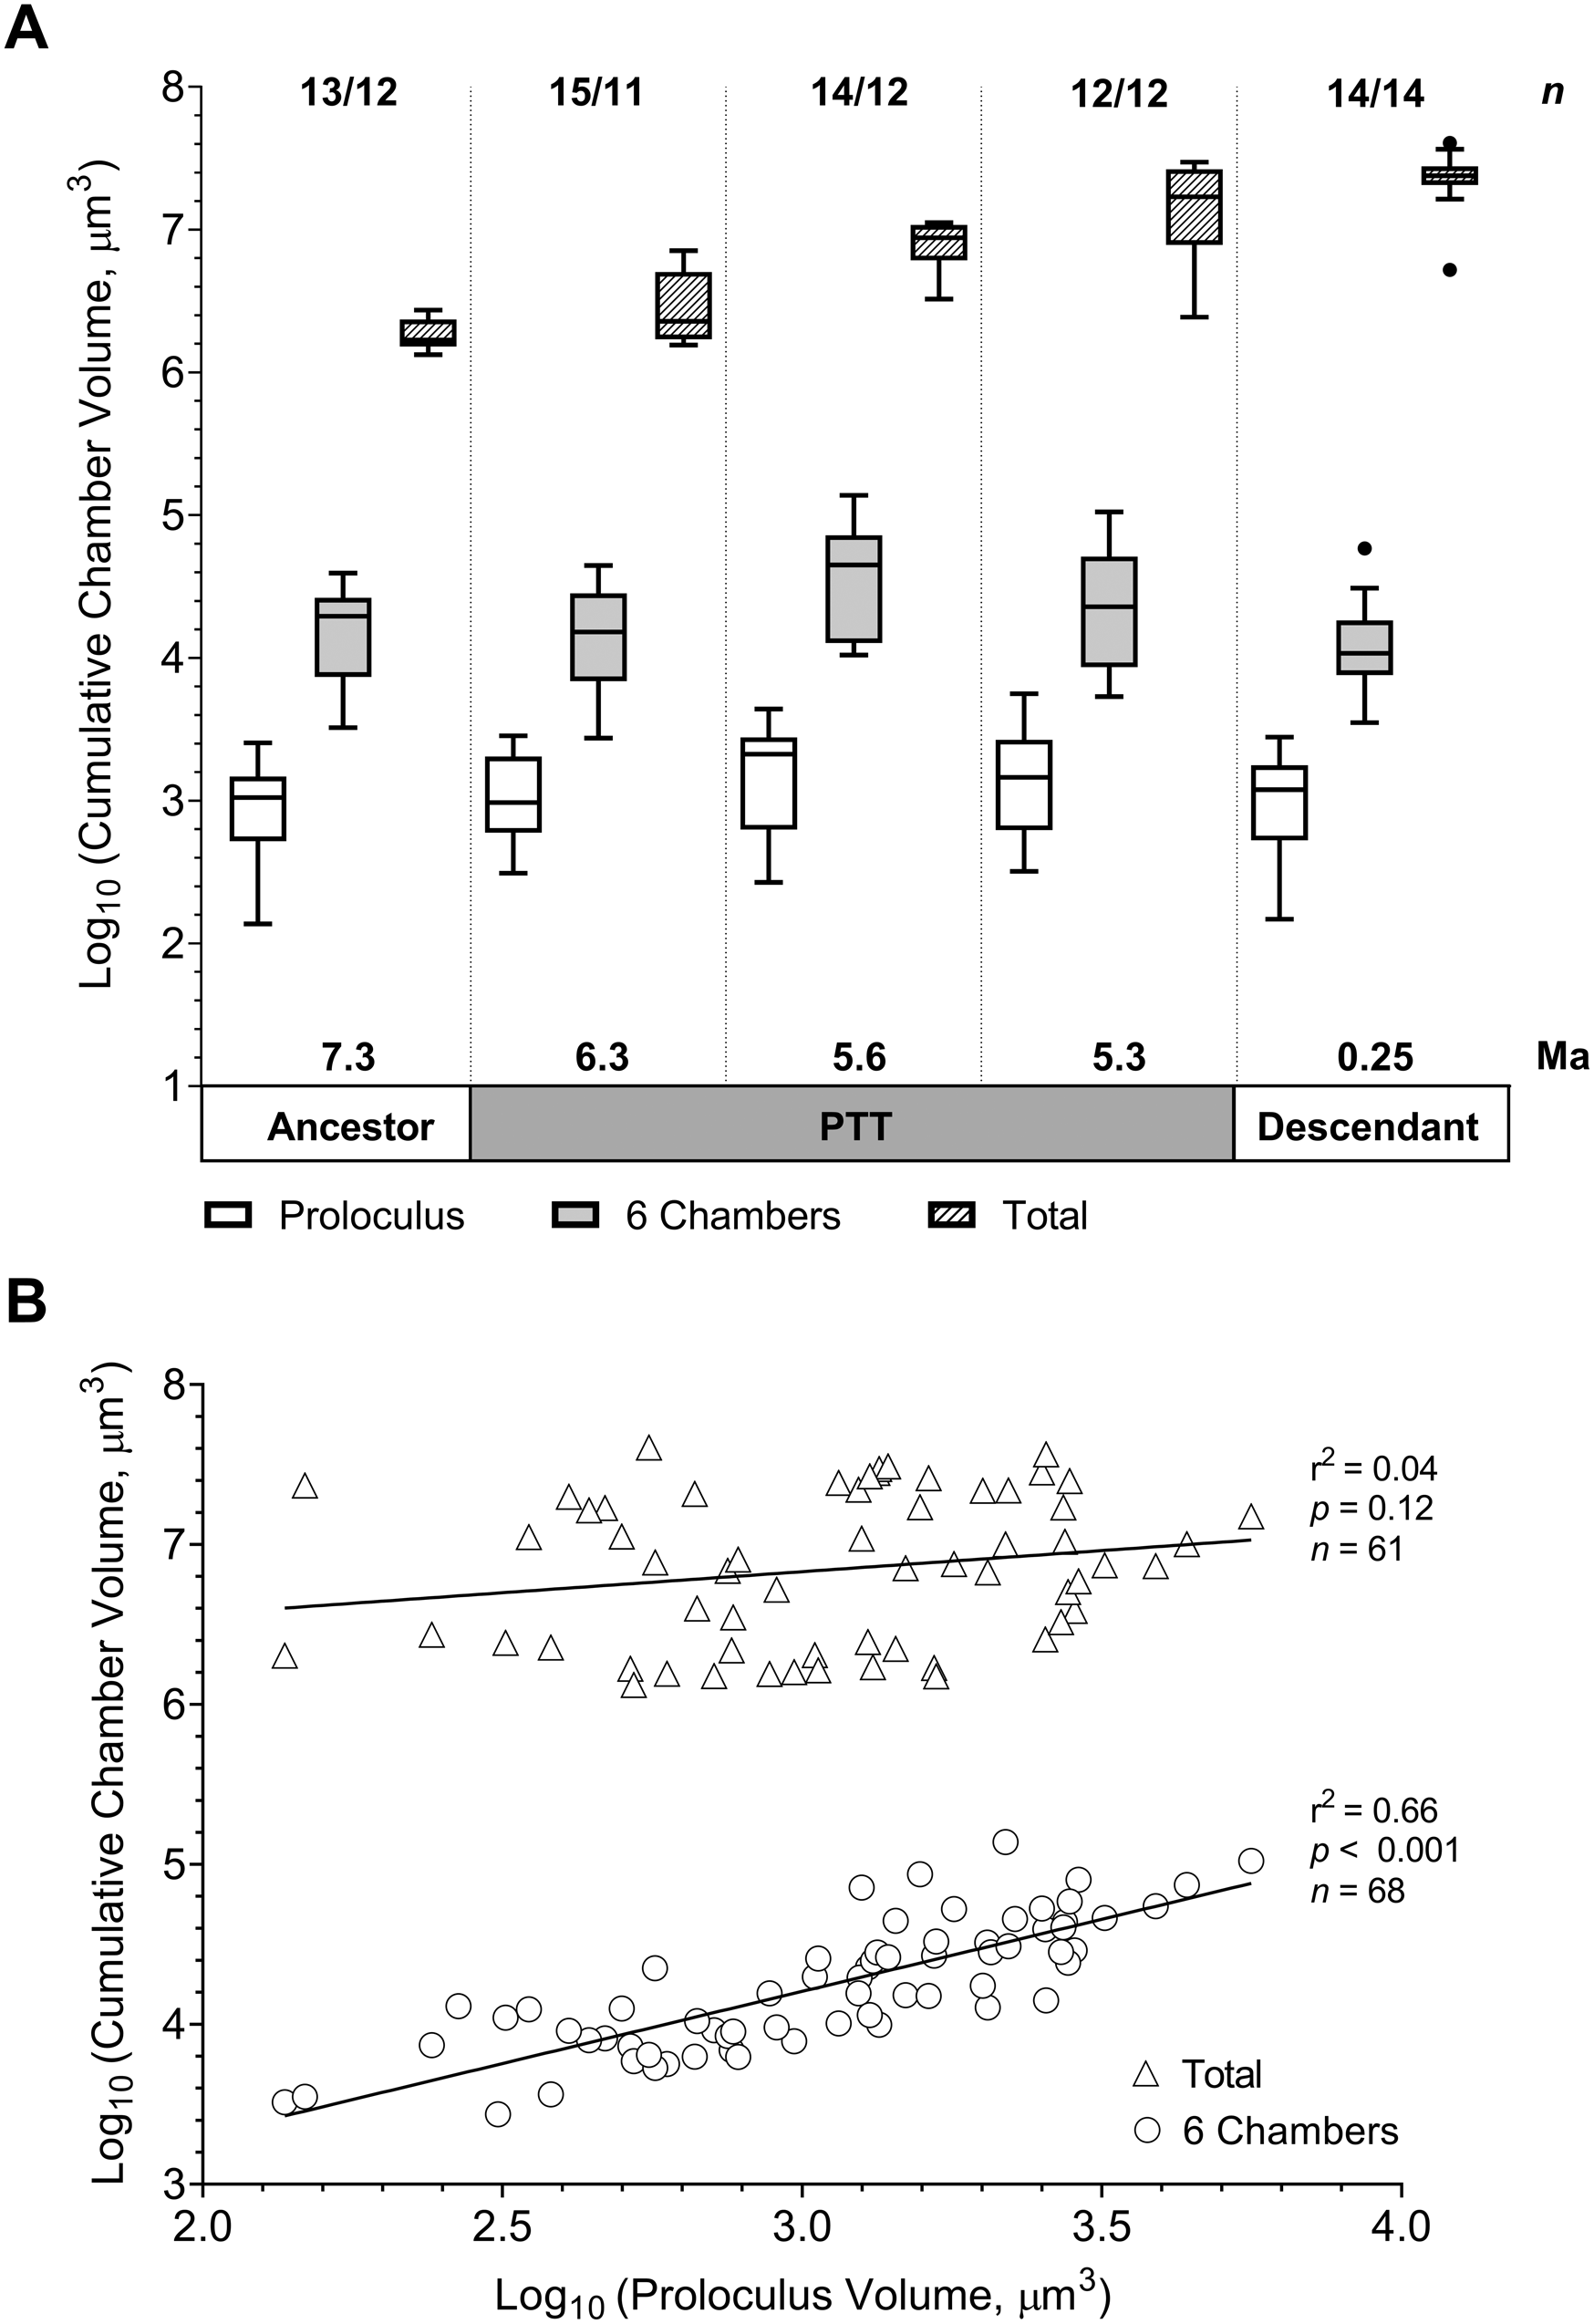
Figure 7. A, Tukey box-and-whisker plots of variation in cumulative chamber volume at prolocular stage and at the six-chamber mark (n = 68; sample sizes listed before slash) and in total (only intact specimens included, n = 61; sample sizes listed after slash). B, Change in cumulative chamber volume in total or at the six-chamber mark vs. the prolocular volume. PTT, Globorotalia plesiotumida–tumida transition.
Intuitively, we would expect that specimens with large first chambers would exhibit larger final volumes compared with specimens with small proloculi. Our dataset indicates that the link between prolocular volume and the cumulative chamber volume decreases throughout ontogeny. While the cumulative volume at the six-chamber mark correlates with the prolocular volume (r 2 = 0.66, p < 0.001), the volume of the first chamber does not determine the total volume of the specimen (r 2 = 0.04, p = 0.12) or the length of its test (r 2 = 0.03, p = 0.2). There is also no significant difference between the prolocular volumes of the sinistral and dextral populations (F 1,66 = 0.03, p = 0.86). The size of the first chamber does have a weak negative effect on the number of chambers (r 2 = 0.1, p < 0.05), meaning that smaller proloculi are generally associated with longer growth trajectories.
Discussion
We used high-resolution imaging techniques to assess change in developmental trajectories and morphology in the Globorotalia plesiotumida–tumida lineage from the late Miocene until the Recent. We find that the PTT is characterized by an increase in variability in total cumulative volume compared with the ancestral and modern populations. The transition is also marked by the emergence of a distinct growth trajectory in support of a cryptic speciation event within the lineage. We suggest that plasticity in the earliest stages of growth, in combination with an ontogenetic constraint on total cumulative volume expansion, has contributed to the emergence and retention of these novel phenotypes. While we interpret our results as evidence for plasticity-led evolution within the lineage, we acknowledge that our interpretation rests on several assumptions that we cannot test in the fossil record. First, we assume that the global cooling trend that characterizes the Miocene/Pliocene boundary acts as a trigger for the release of variation in our study system. While we would expect foraminiferal morphology to closely track shifts in environmental conditions (based on numerous examples of morphological response to the climatic fluctuations during glacial–interglacial cycles; e.g., Schmidt et al. Reference Schmidt, Renaud and Bollmann2003), our fossil data can only provide an associative—rather than a causal—link between environmental change and morphological variability. Second, given that we have no access to genetic material, we assume that the G. plesiotumida–tumida lineage exhibits preexisting capacity (i.e., cryptic genetic variation) for generating novel phenotypes. The extent of within-species plasticity that we uncovered in the relatively small number of specimens per sample emphasizes the need for high-throughput techniques in future studies of ontogeny, because developmental trajectories obtained from a small sample might not reflect the evolution within a study population.
Population-Level Analysis Supports a Rapid Speciation Event within the Lineage
The latest morphometric study in adult specimens from this lineage by Hull and Norris (Reference Hull and Norris2009) showed that the PTT was marked by the presence of a previously unidentified cryptic morphotype with a global peak of abundance at 5.5 Ma. Globorotalia tumida is thought to have evolved from this morphologically distinct intermediary over a short period of 44 kyr. In support of their interpretation, we find that the mean trajectory in the mid-PTT (5.6 Ma) sample is markedly different from the ancestral G. plesiotumida and the Recent G. tumida. This new trajectory of rapid growth early in development followed by an equally sharp decline is retained—albeit with a reduction in growth rate—in the sample at the end of the PTT (5.3 Ma), which indicates that a change in growth rate might underlie the origin of the G. tumida morphotype. The sample at 5.3 Ma also contains a smaller specimen that fits within the ancestral range of total cumulative volumes, which points to speciation by cladogenesis when the ancestor continues to coexist with the descendant after the speciation event (Benton and Pearson Reference Benton and Pearson2001). The switch to a predominantly dextral-coiling direction during the PTT, also observed by Hull and Norris (Reference Hull and Norris2009), gives further support for the presence of a cryptic morphotype.
Additionally, our population-level analysis shows that all increases in total cumulative volume in this lineage are confined to the PTT, which suggests an upper constraint on volume expansion. Laboratory studies in live foraminifera indicate that larger organisms are associated with higher reproductive success due to an increase in the number of gametes they can produce (Hemleben et al. Reference Hemleben, Spindler and Anderson1989). This might have contributed to the global dominance of the cryptic morphotype over the ancestral G. plesiotumida, as identified by Hull and Norris (Reference Hull and Norris2009). The cumulative volume in the most recent population does not significantly differ from the sample at 5.3 Ma, which implies that further expansion in volume within the lineage cannot be sustained due to the energetic costs associated with gametogenesis. Such upper constraint on volume might have contributed to the lack of morphological evolution or “stasis” documented within the lineage after the PTT (Malmgren et al. Reference Malmgren, Berggren and Lohmann1983; Hull and Norris Reference Hull and Norris2009).
Developmental Plasticity as a Potential Mechanism for Generating Novel Phenotypes
Our analysis reveals greater variation in total cumulative volume in the population at the start of the PTT compared with the ancestral sample at 7.3 Ma. This result fits within the model of plasticity-led evolution, which posits that the formation of novel phenotypes is preceded by an increase of variation around a phenotypic mean, as per Jackson (Reference Jackson2020). We also find that variability in volume remains consistently higher in early developmental stages compared with the last stage of growth in all study populations. In addition, our results complement a recent study of 12 extant species of foraminifera that showed that the positive correlation between the prolocular volume and the total volume of the test decreased in later stages of ontogeny (Burke et al. Reference Burke, Renema, Schiebel and Hull2019). This indicates that a compensatory mechanism might be at play to ensure that adults achieve a certain reproductive size irrespective of variation in growth conditions early in development. The mean developmental change within the lineage is best described as peramorphosis or recapitulation of an ancestral ontogeny at an earlier stage in the descendant organism (McNamara Reference McNamara1982). If we only had access to developmental trajectories in the ancestral G. plesiotumida and Recent G. tumida populations, we would conclude that the increase in size within the lineage has been achieved via the addition of extra chambers. Our analysis of developmental change during the PTT shows that it is the accelerated growth early in development—and a subsequent addition of chambers at the end of the mid-PTT growth trajectory—that underlies the emergence of G. tumida phenotype within the lineage. While plasticity in the early stages of ontogeny does not have much impact on the adult phenotype in stable populations, our results indicate that it might become an important source of variation in times of environmental change.
The transition interval is characterized by greater stratification of surface waters and a major reorganization of the tropical ecosystems due to the final emergence of the Isthmus of Panama (Schmidt et al. Reference Schmidt, Caromel, Seki, Rae and Renaud2016), which—in our interpretation—hints at the release of cryptic variation within the ancestral G. plesiotumida in response to changing environmental conditions. The highest diversity of foraminiferal populations in the modern oceans can be found in the middle latitudes due to their extensive temperature gradient, which increases the number of available ecological niches (Rutherford et al. Reference Rutherford, D'Hondt and Prell1999). The Miocene/Pliocene boundary is marked by high rates of speciation in tropical foraminifera (Wei and Kennett Reference Wei and Kennett1986), which suggests that a number of lineages were affected by the same external factor. We argue that the sharp rise in growth rates exhibited by the cryptic morphotype and the descendant G. tumida in early development was a response to the reduced competition for food in an increasingly stratified ocean. Our interpretation is supported by experimental and modeling studies that pinpoint the availability of food as the key limiting factor of growth throughout ontogeny (Bé et al. Reference Bé, Caron and Anderson1981; Faber et al. Reference Faber, Anderson, Lindsey and Caron1988; Grigoratou et al. Reference Grigoratou, Monteiro, Schmidt, Wilson, Ward and Ridgwell2019). The differences in growth trajectories between our Recent population and the modern specimen of G. tumida from the Pacific (Caromel et al. Reference Caromel, Schmidt, Fletcher and Rayfield2016) might also reflect local adaption to increasingly oligotrophic conditions in the western Caribbean due to the closure of the Central American Seaway (Jain and Collins Reference Jain and Collins2007). The large extent of within-species plasticity we uncovered indicates that more specimens from the Pacific population need to be reconstructed before we can draw a meaningful comparison.
According to one recent guide for identifying plasticity-led evolution in the fossil record, an increase in variation around the phenotypic mean should be a reliable indicator of cryptic genetic variation being released in response to an environmental stressor (Jackson Reference Jackson2020). Studies in extant populations of planktic foraminifera suggest that genetic diversity often has no morphological expression in adult organisms, that is, it remains cryptic, which implies that genetic divergence is not necessarily correlated with phenotypic divergence in this taxon (Renaud and Schmidt Reference Renaud and Schmidt2003; Darling and Wade Reference Darling and Wade2008). In the majority of cases, the number of genotypes exceeds the number of morphospecies, but Trilobatus sacculifer provides an important exception to the rule, as four previously identified morphospecies of T. sacculifer exhibit no genetic separation (André et al. Reference André, Weiner, Quillévéré, Aurahs, Morard, Douady and de Garidel-Thoron2012). As we do not have access to the genetic material, we also cannot exclude the possibility that the distinct developmental trajectory that we identify during the PTT arose via a novel mutation that was selected for in the new environment and was not linked to the increase in variation in the ancestral population at the start of the PTT. We suggest that a plasticity-led mechanism offers a better fit with the succession of two speciation events over a relatively short time span of 500 kyr within the lineage, as proposed by Hull and Norris (Reference Hull and Norris2009). While evolution by mutation starts with a single individual and its descendants, the expression of cryptic genetic variation can be induced by the same external factor in many individuals at once, which can lead to a rapid emergence and spread of new phenotypes (Levis and Pfennig Reference Levis and Pfennig2016).
It is also unclear how the switches in coiling direction that we observed are connected to the genetic mechanism that underlies plasticity in foraminiferal developmental trajectories. Although coiling direction is considered to be a heritable trait (Norris and Nishi Reference Norris and Nishi2001; Darling et al. Reference Darling, Kucera, Kroon and Wade2006), genetically distinct coiling types can exhibit ecological preferences (de Vargas et al. Reference de Vargas, Renaud, Hilbrecht and Pawlowski2001). Additionally, an alternation between sexual and asexual reproduction offers a way to generate variation in foraminiferal populations in the absence of environmental or genetic change (Schmidt et al. Reference Schmidt, Thomas, Authier, Saunders and Ridgwell2018). A recent study of asexual reproduction in planktic foraminifera—previously assumed to be absent from this clade—revealed remarkable morphological variation among genetic clones that were exposed to the same environmental stimuli (Davis et al. Reference Davis, Livsey, Palmer, Hull, Thomas, Hill and Benitez-Nelson2020). Future studies in modern foraminiferal populations could provide further insights into how heritable and nonheritable factors interact to generate phenotypic diversity in this taxon.
Conclusions
Using high-resolution imaging techniques, we find that speciation within the Globorotalia plesiotumida–tumida lineage of planktic foraminifera close to the Miocene/Pliocene boundary is accompanied by an increase in developmental plasticity in a trait that is important for reproduction. Our study also shows that the PTT is marked by the emergence of a novel morphotype with a distinct developmental pattern that subsequently gives rise to the descendant G. tumida. The results from our analysis suggest that intraspecific variation early in development—in combination with a reproductive constraint on later stages of growth—could be an important mechanism for generating and maintaining novel phenotypes in response to environmental change. While we acknowledge that identifying plasticity-led evolution in the fossil record remains a challenge, our fossil-based approach complements and can potentially inform investigations in extant organisms. We also emphasize the need for high-throughput approaches in studies of developmental change in the fossil record to reflect the true level of variability in each population. Further assessment of variability in other organisms with well-preserved developmental stages will help establish whether a rise in plasticity before the emergence of novel phenotypes is a widespread phenomenon in marine invertebrates. Reconstructions of the developmental trajectories of an ancestral “stem” lineage in comparison to several of its descendants throughout periods of environmental change could provide another powerful test for the presence of preexisting plasticity within marine systems.
Acknowledgments
We would like to thank two anonymous reviewers and L. Collins and W. Kiessling for their helpful comments. We thank T. Davies for technical support and T. Ezard for useful discussions. K.V. would like to thank A. Caromel and M. Knappertsbusch for their help with SXRTM methodology and species identification, respectively. A further thank you to R. Barrett for proofreading the article. D.N.S. would like to thank the Royal Society for the Wolfson Research Merit Award and acknowledge funding from the Natural Environment Research Council grant NE/P019439/1.
Data Availability Statement
Supplementary Material containing measurements from all specimens analyzed as part of the study can be obtained from PANGAEA (https://doi.pangaea.de/10.1594/PANGAEA.930798), and the CT scans are available from the University of Bristol data repository, data.bris (https://data.bris.ac.uk/data; https://doi.org/10.5523/bris.15x92y3meronr2pe7tkaks7341).


