


Introduction
A valid and reliable measure of the severity of depression is required to judge the need for care, assess treatment effects, and inform aetiological explorations. Although a number of scales are available, the agreement between them is less than optimal and no instrument can be considered as a gold standard. In this article, we identify the factors affecting the measurement of depression severity and address these in the comparison and integration of three instruments: the clinician-rated 17-item Hamilton Depression Rating Scale (HAMD-17; Hamilton, Reference Hamilton1960, Reference Hamilton1967), the Montgomery–Asberg Depression Rating Scale (MADRS; Montgomery & Asberg, Reference Montgomery and Asberg1979) and the self-report 21-item Beck Depression Inventory (BDI; Beck et al. Reference Beck, Ward, Mendelson, Mock and Erbaugh1961).
The first issue concerns the distinction between self-report and clinician-rated scales. Traditionally, clinician-rated instruments were assumed to be more objective and valid than self-report (Prusoff et al. Reference Prusoff, Klerman and Paykel1972). However, it has been suggested that the larger effect size of clinician-rated scales compared to self-report in clinical trials might be due to a clinician's bias in favour of active medication rather than to true sensitivity to change (Edwards et al. Reference Edwards, Lambert, Moran, McCully, Smith and Ellingson1984; Greenberg et al. Reference Greenberg, Bernstein, Greenberg and Fisher1992). Other studies have found that self-report inventories have a validity and sensitivity to change comparable to the clinician-rated HAMD (Feinberg et al. Reference Feinberg, Carroll, Smouse and Rawson1981; Rush et al. Reference Rush, Trivedi, Carmody, Ibrahim, Markowitz, Keitner, Kornstein, Arnow, Klein, Manber, Dunner, Gelenberg, Kocsis, Nemeroff, Fawcett, Thase, Russell, Jody, Borian and Keller2005). It is our view that, as the depressive syndrome comprises subjective symptoms and observable signs, it is natural to combine clinician observation with self-report when measuring its severity. While some symptoms require clinical observation (e.g. psychomotor retardation), others hinge on self-report even in clinician-led assessment (e.g. guilt), and yet other symptoms may be more easily rated by self-report because of their intimate nature (e.g. libido). Somewhat surprisingly, the two methods of assessment have often been contrasted but rarely integrated (Gullion & Rush, Reference Gullion and Rush1998). In the present investigation, we combined two clinician-rated scales and one self-report questionnaire to derive an estimate of depression severity.
The second issue is the dimensional complexity of depression. Although depressed mood and anhedonia form the core of the depressive syndrome, other signs and symptoms contribute to the distress and impairment associated with the disorder, and should be taken into account when assessing its severity. Consequently, the intensity and frequency of symptoms have to be weighted, as well as their level of relatedness to the concept of depression. The existing scales differ in their emphasis on various groups of symptoms and in the range of symptoms included. For example, the HAMD-17 includes one item for mood but three items assessing sleep. The MADRS includes two mood items but only one sleep item. Pessimism and guilt are assessed by six of the 21 items of the BDI compared to one item of the MADRS or the HAMD-17. Anxiety is rated in four HAMD-17 items, one item of the MADRS and one of the BDI. As the scales are scored by summing their items, each instrument is biased towards symptoms covered by more items (Moller, Reference Moller2001; Bagby et al. Reference Bagby, Ryder, Schuller and Marshall2004). A method of rectifying this bias by selecting only items assessing the core depressive symptomatology has been proposed (Bech et al. Reference Bech, Gram, Dein, Jacobsen, Vitger and Bolwig1975, Reference Bech, Cialdella, Haugh, Birkett, Hours, Boissel and Tollefson2000). In the present study, we explored an alternative solution of applying the item response theory (IRT; Embretson & Reise, Reference Embretson and Reise2000), which is a method of looking at how informative each item is in a particular sample. IRT methods are based on probabilities of individual response options and estimate depression severity independently of the selection of test items.
If depression is a multi-dimensional construct, it would be best assessed by several related scales measuring the underlying dimensions (Gibbons et al. Reference Gibbons, Clark and Kupfer1993). Indeed, there is evidence for several dimensions of depressive symptoms that differ in their aetiology (Korszun et al. Reference Korszun, Moskvina, Brewster, Craddock, Ferrero, Gill, Jones, Jones, Maier, Mors, Owen, Preisig, Reich, Rietschel, Farmer and McGuffin2004). A number of studies have addressed the dimensionality of depression scales by means of factor analysis, and found that most scales are better described as comprising 3–6 dimensions (Shafer, Reference Shafer2006). While the factor analytic studies have reliably indicated a subset of core items that can be scored as an internally consistent scale (Bech et al. Reference Bech, Gram, Dein, Jacobsen, Vitger and Bolwig1975; Faries et al. Reference Faries, Herrera, Rayamajhi, DeBrota, Demitrac and Potter2000; Shafer, Reference Shafer2006), they have failed to provide useful subscales for other aspects of depressive symptomatology (Gibbons et al. Reference Gibbons, Clark and Kupfer1993; Browne et al. Reference Browne, Schulberg and Madonia1995). The failure to find practical multi-dimensional descriptors has two possible explanations. First, with a notable exception (Gullion & Rush, Reference Gullion and Rush1998), previous studies have analysed items belonging to a single scale, and there have been insufficient additional items to cover dimensions other than the one reflecting core depressive symptomatology. Second, in aiming for the most accurate description of the covariance structure, authors have tended to extract a large number of factors that were insufficiently defined by a relatively small number of items. In the present investigation, we aimed to achieve a pragmatic balance between model fit and applicability.
Method
Sample and design
The interviews (HAMD-17 and MADRS) and questionnaire (BDI) were administered to 236 male and 424 female adult patients with major depressive disorder as part of their participation in GENDEP (genome-based therapeutic drugs for depression), a multi-centre randomized pharmacogenetic study (http://gendep.iop.kcl.ac.uk). The participants were between 18 and 72 years old (mean 41.8, s.d.=11.8) and of white European ethnicity. They were predominantly out-patients, recruited through referrals and advertisements in eight European countries including Belgium (n=37), Croatia (n=39), Denmark (n=72), Germany (n=194), Italy (n=35), Poland (n=97), Slovenia (n=108) and the UK (n=78). The inclusion criterion was a diagnosis of major depressive episode of at least moderate severity, as defined by the DSM-IV and ICD-10 and established in the Schedules for Clinical Assessment in Neuropsychiatry (SCAN Version 2.1; WHO, 1999) with the computerized classification system CATEGO5 (Grayson et al. Reference Grayson, Bridges, Cook and Goldberg1990). The exclusion criteria were: a first-degree relative with bipolar affective disorder or schizophrenia, a history of hypomanic or manic episode, mood incongruent psychotic symptoms, primary substance misuse or primary organic disease, current treatment with an antipsychotic or a mood stabilizer, pregnancy or lactation. Participants were also excluded if they had medical contra-indications or a history of lack of efficacy or adverse reactions to both study medications. After explanation of study procedures and providing informed consent as approved by local ethical committees, the participants were randomized to receive escitalopram or nortriptyline for 12 weeks. Eighty-nine participants had a history of non-response, adverse effects or contra-indications to one study medication and were non-randomly allocated to the other medication. All assessment scales were administered at week 0 (at randomization) and then weekly for 12 weeks. Assessments at weeks 0, 8 and 12 were face-to-face interviews with a psychiatrist and a research assistant, both trained in the administration of the instruments. The remaining assessments were conducted either face-to-face or by telephone interview with a trained psychologist or psychiatrist. To establish inter-rater reliability for HAMD-17 and MADRS, 10 interviews were audio-recorded and rated by raters in each centre.
Measures
The HAMD-17 was used in its 1967 revision (Hamilton, Reference Hamilton1967) with standardized prompts and anchors that have been shown to improve the reliability of ratings (Williams, Reference Williams1988). The 17 items and their range of response options are: (1) depressed mood 0–4; (2) feelings of guilt 0–4; (3) suicide 0–4; (4) early insomnia 0–2; (5) middle insomnia 0–2; (6) late insomnia 0–2; (7) work and activities 0–4; (8) retardation 0–4; (9) agitation 0–4; (10) psychic anxiety 0–4; (11) somatic anxiety 0–4; (12) gastrointestinal somatic symptoms/appetite 0–2; (13) general somatic symptoms 0–2; (14) genital symptoms 0–2; (15) hypochondriasis 0–4; (16) loss of weight 0–2; and (17) insight 0–2. They were rated to cover the 1-week period prior to the interview. In addition to the full-scale version, we evaluated the six-item version (HAMD-6), comprising items 1, 2, 7, 8, 10 and 13, which has better internal consistency (Bech et al. Reference Bech, Gram, Dein, Jacobsen, Vitger and Bolwig1975).
The MADRS was administered in its original form (Montgomery & Asberg, Reference Montgomery and Asberg1979). It comprises 10 items with six ordered response categories (0–5) each: (1) apparent sadness; (2) reported sadness; (3) inner tension; (4) reduced sleep; (5) reduced appetite; (6) concentration difficulties; (7) lassitude; (8) inability to feel; (9) pessimistic thoughts; and (10) suicidal thoughts.
The original 21-item version of the BDI (Beck et al. Reference Beck, Ward, Mendelson, Mock and Erbaugh1961) was completed as a paper-and-pencil self-report questionnaire, or it was read out to the participants, giving them all response options and asking them to select the one that best corresponded to how they had been feeling over the preceding week. The BDI comprises 21 items, each scored 0–3: (1) sadness, (2) future pessimism; (3) feeling like a failure; (4) lack of enjoyment; (5) guilt; (6) feelings of being punished; (7) disappointment with oneself; (8) self-blame; (9) suicidal thoughts; (10) crying; (11) irritability; (12) interest in people; (13) making decisions; (14) appearance; (15) work; (16) sleep; (17) tiredness; (18) appetite; (19) weight loss; (20) health anxiety; and (21) interest in sex.
Approach to analysis
Some investigators have used one measure as a ‘gold standard’ criterion for assessing the validity of other scales. However, several ‘gold standards’, including the HAMD, have proven unreliable (Bagby et al. Reference Bagby, Ryder, Schuller and Marshall2004; Ruhe et al. Reference Ruhe, Dekker, Peen, Holman and de Jonghe2005). Therefore, recognizing that no measure on its own is optimal, we used an IRT model to derive the best estimate of true depression severity from the composite pool of items of the three rating scales.
Repeated assessments of the same individual tend to be related, and inclusion of multiple assessments could bias the psychometric parameter estimates. Therefore, most investigators include only one time point per individual when psychometric properties of a scale are investigated. As variability in symptom ratings at study entry tends to be limited, most previous psychometric studies have focused on exit ratings. Exit ratings contain more variability but may be biased by having severe ratings only in treatment-resistant subjects, and may be influenced by the psychological factors related to ending a study. It is our opinion that if the purpose is to measure the effect of treatment, it is important to examine the psychometric properties across the treatment period. Therefore, we randomly selected 1 week from each individual to derive a ‘random week dataset’ for the item response calibration and factor analyses. If all ratings for the randomly selected week were missing, adjacent week data were used for that individual.
Dimensionality and factor structure
The factor analysis in the present report serves several related purposes. First, confirmatory factor analysis (CFA) was applied to test the assumption of unidimensionality, which is a prerequisite for scoring under classical test theory (CTT) and IRT. Unidimensionality is characterized by a single dominant factor that explains a large proportion of the variance (Embretson & Reise, Reference Embretson and Reise2000). After testing the dimensionality of each scale separately, we applied a one-factor CFA to the items of the three scales to test the presumption that they measured the same concept (depression severity). Although a degree of unidimensionality is necessary for summed scale scores to be valid, it was not expected that a one-factor model would provide the best fit to a scale with more than a few items (Floyd & Widaman, Reference Floyd and Widaman1995). Following the procedure used by the Patient-Reported Outcomes Measurement Information System (PROMIS) Consortium (www.nihpromis.org), we evaluated practical indices including the factor loadings, average absolute residual correlation, root mean square error of approximation (RMSEA), the incremental fit index of Tucker and Lewis (TLI) and the comparative fit index (CFI).
Second, if one-factor CFA did not provide a close fit to the data, an exploratory factor analysis (EFA) was performed to obtain a fine-grained description of the scale covariance structure. As appropriate for the ordered categorical response format of HAMD, MADRS and BDI, confirmatory and exploratory analyses were performed on a matrix of polychoric correlations using the robust weighted least square estimator (Flora & Curran, Reference Flora and Curran2004) in Mplus version 4.2 (Muthen & Muthen, Reference Muthen and Muthen2006). As dimensions of depression are expected to be related, we used oblique PROMAX rotation, allowing factors to be correlated.
The number of factors to be extracted in the EFA was determined by comparison of data-derived eigenvalues, with the distribution of eigenvalues in a parallel analysis of 25 simulated datasets with the same proportion of response categories and missing values as in the observed data. The same factor analytic procedure and estimator were used for the simulated as for the real data. Parallel analysis has been shown to be superior to the commonly used eigenvalue-greater-than-one rule and other methods of determining the number of factors (Humphreys & Montanelli, Reference Humphreys and Montanelli1975).
Finally, we performed a longitudinal CFA to test how the structure derived from the random week dataset generalized to specific time points and to test longitudinal measurement invariance (Brown, Reference Brown2006).
Classical test theory (CTT)
Depression severity is not directly observable and has to be derived from a set of questionnaire or interview items. The CTT provides a theoretical framework for such inference. We used the CTT correlation-based methods to assess the scale internal consistency (a measure of correlation between items reflected in item-total correlation and Cronbach's α), construct validity (factor analysis) and criterion validity (correlation between measures). CTT methods assume that all items measure the same construct (unidimensionality) with equal accuracy (parallelism) and independently of each other and of the true score (random errors) across individuals and occasions (measurement invariance). While some of these assumptions may be unrealistic, we included here the CTT methods for the sake of comparability with previous literature, while the IRT analysis provides a more generalizable model.
Item response theory (IRT)
IRT methods estimate a latent trait (depression severity) based on the pattern of responses to all available items. The probability of each response option is modelled across the severity spectrum. The IRT derives estimates independent of the selection of administered items and allows the error of measurement to vary along the spectrum of severity (Embretson & Reise, Reference Embretson and Reise2000). The IRT only retains the assumptions of unidimensionality (i.e. all test items relate to one underlying concept) and local independence (i.e. the errors are uncorrelated for a specified level of severity). Using marginal maximum likelihood and the MULTILOG 7 software (Thissen et al. Reference Thissen, Chen and Bock2003), we fitted the IRT graded response model for ordered polytomous items (Samejima, Reference Samejima1969). For each test item, we calculated its ability to discriminate between levels of severity (discrimination parameter α) and a series of response option thresholds (β1–6). A discrimination parameter α below 0.65 is considered low, 0.65−1.34 moderate and 1.35 or above high (Baker, Reference Baker2001). Threshold parameters reflect the standardized level of depression severity at which subsequent response options become more probable than the previous option. For example, a first threshold parameter β1 of −1.5 indicates that an individual with severity of less than 1.5 standard deviation (s.d.) below average is most likely to score 0 on this item. A second threshold β2 of 0.0 indicates that an individual with average severity will be equally likely to score 1 or 2. An optimal test has items with high discrimination and response thresholds spread across a range of severity.
We further calculated the test information function (TIF), which is defined as the inverse of measurement error and gives a detailed account of scale accuracy across the spectrum of severity. Finally, we used the technique of summed scores (Orlando et al. Reference Orlando, Sherbourne and Thissen2000) and the IRTscore software (Flora & Thissen, Reference Flora and Thissen2002) to estimate the test scores equivalent to each level of depression severity. The resulting equivalent score table facilitated the comparison of HAMD, MADRS and BDI scores across settings and individuals.
Results
Missing values
In the random week dataset, 2.6% of the values were missing and average inter-item covariance coverage was 96%. Most of the missing data were due to one of the three scales being omitted: 24 participants did not provide data on BDI (e.g. had not posted it back), two participants did not have HAMD-17 and two did not have MADRS rating. Furthermore, 52 participants did not answer the last three BDI items, which were on the last page. Twelve participants (1.8%) had missing values on HAMD item 14 (genital symptoms), compared to an average of 2–3 missing values (<0.5%) for other items. Both Mplus and MULTILOG allow the use of all available data and provide unbiased estimates in the presence of missing values.
Reliability and summed scores of rating scales
Internal consistency was high for MADRS and BDI (Cronbach's α⩾0.9) and acceptable for the HAMD-17 and HAMD-6 (Cronbach's α⩾0.8; Table 1). The corrected item-total correlations were low (<0.4) for the HAMD items 9 (agitation), 14 (libido), 15 (hypochondriasis), 16 (weight loss) and 17 (insight) and the BDI item 19 (weight loss). All MADRS items had adequate item-total correlations (>0.5).
Table 1. Descriptive statistics, internal consistency and mutual correlation of summed scores of the different scales

MADRS, Montgomery–Asberg Depression Rating Scale; HAMD-17, 17-item Hamilton Depression Rating Scale; HAMD-6, six-item Hamilton Depression Rating Scale; BDI, Beck Depression Inventory.
The summed scores for the random week data ranged from levels indicating severe depression to complete recovery and their means corresponded to moderate depression (Table 1). The correlations of summed scores ranged from 0.75 between BDI and HAMD to 0.92 between MADRS and HAMD (Table 1).
Inter-rater reliability assessed by intra-class correlation was 0.90 [95% confidence interval (CI) 0.79–0.96] for the HAMD-17 and 0.92 (95% CI 0.83–0.97) for the MADRS, and did not differ significantly between centres.
One-factor CFA
First, we tested the unidimensionality of each scale using a CFA with all items loading on a single common factor. A one-factor CFA of the 10 MADRS items showed a good fit, with a single common factor explaining 57% of the variance, all factor loadings above 0.6 (data not shown), and low mean residual correlation (Table 2). These results indicated that MADRS was effectively a unidimensional measure. For the HAMD-17, a one-factor CFA model explained 36% of the variance and four item loadings were less than 0.6 (items: 9 agitation, 14 genital symptoms, 15 hypochondriasis, 17 insight); low residual correlations indicated that the items with a poor fit were not strongly mutually related (Table 2). The HAMD-6 appeared unidimensional, with a model fit similar to the MADRS. For the BDI, a single-factor model explained 48% of variance and model fit was intermediate, suggesting that although an adequate level of unidimensionality was present, there was room for factorial exploration.
Table 2. Confirmatory factor analysis (CFA) as unidimensionality test of the original measures

TLI, Incremental fit index of Tucker and Lewis; CFI, comparative fit index; RMSEA, root mean square error of approximation; MADRS, Montgomery–Asberg Depression Rating Scale; HAMD-17, 17-item Hamilton Depression Rating Scale; HAMD-6, six-item Hamilton Depression Rating Scale; BDI, Beck Depression Inventory.
Second, to test the presumption that all three scales measured one underlying construct, a CFA was performed forcing all 48 items to load on one common factor. This common factor explained 45% of the variance and 43 items had loadings of 0.60 or more; HAMD items 9, 11, 15 and 17 and BDI items 19 and 20 had smaller loadings. Although the strong common factor supported unidimensionality, the model fit indices suggested that the one-factor model does not provide an exhaustive description (Table 2).
Exploratory factor analysis (EFA)
As the one-factor CFA did not provide a close fit, we performed an EFA. The HAMD item 17 (insight) had a limited distribution (92% of ratings=0) and weak correlations with other items (all less than 0.2), and tended to produce a singleton factor; we therefore excluded it and applied the EFA to the remaining 47 items. The high ratio (6.1) of first to second eigenvalues was consistent with unidimensionality. However, the first six eigenvalues exceeded the distribution of values derived from a parallel analysis of random data, indicating a more complex factorial structure (Fig. 1). The difference between observed and simulated data eigenvalues decreased progressively and was relatively smaller for the fourth, fifth and sixth factor. We have therefore examined solutions with up to six factors.

Fig. 1. Exploratory factor analysis (EFA) eigenvalues (–●–) compared with parallel analysis (· · ·◊· · ·). Parallel analysis shows the information contained in factors based on random data. The number of true factors present is estimated as the number of real data eigenvalues in the EFA that exceed the parallel analysis values.
The three-factor solution provided the most parsimonious and interpretable description with few cross-loadings. The PROMAX rotated solution is presented in Table 3. The first ‘observed mood and anxiety’ factor comprised clinician-rated anxiety, mood, and activity items. The second ‘cognitive’ factor was saturated by suicide, guilt, and most self-rated BDI items including pessimism and self-deprecation. The third ‘neurovegetative’ factor included appetite, weight loss, sleep and sexual drive.
Table 3. Exploratory factor analysis (EFA): three-factor solution with PROMAX rotated loadings

Bold values represent highest loading for each item.
MADRS, Montgomery–Asberg Depression Rating Scale; HAMD, Hamilton Depression Rating Scale; BDI, Beck Depression Inventory.
In the four-factor solution, the neurovegetative factor separated into sleep-sex and appetite-weight factors. In the five-factor solution, the cognitive factor separated into guilt and interest factors. Finally, if six factors were extracted, the anxiety items separated from the remaining items in factor 1, but clinician-rated mood items cross-loaded onto the anxiety factor.
Longitudinal three-factor confirmatory analysis
A longitudinal factor analysis confirmed that the EFA-derived three-factor structure was largely invariant over time. Factors 1 and 3 were invariant across all time points including baseline. Constraining factor 2 loadings at week 0 (baseline) to the same values as follow-up weeks led to a small deterioration but the model fit remained acceptable (RMSEA<0.05). Detailed results of the longitudinal CFA are available on request from R.U.
Item response analysis
A graded response model was fitted to all 48 items, excluding response categories for which there were no observations (category 6 of MADRS items 3, 7 and 9 and category 4 of HAMD items 8 and 15). The discrimination and threshold parameters for each item are given in Table 4. Although most items showed appropriate discrimination properties, HAMD items 9 and 17 contributed little to the measurement of depression severity. Overall, the MADRS items provided best discrimination (average α=1.9), BDI items were intermediate (average α=1.4) and HAMD items lowest (average α=1.2). The thresholds covered a broad spectrum of severity from −2 to +3 of the standardized θ scale. Mood and activity items discriminated at milder severity levels, whereas suicide, appetite and retardation discriminated at the severe end of the spectrum. The very high β6 thresholds for most MADRS and β4 thresholds for HAMD items reflected the fact that the highest options were rarely used in the clinician-rated scales.
Table 4. Item response characteristics. The discrimination parameter α is a measure of the item's ability to discriminate varied levels of depression severity. The threshold parameters β show the standardized level of severity at which subsequent response options become more likely than the previous response option. Categories with no observations are omitted
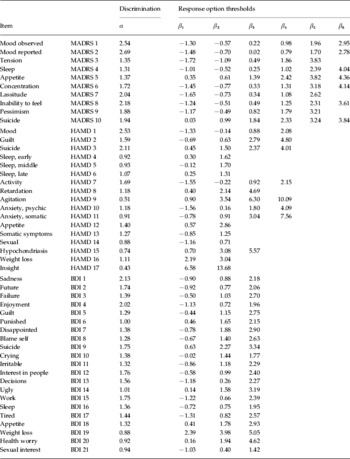
MADRS, Montgomery–Asberg Depression Rating Scale; HAMD, Hamilton Depression Rating Scale; BDI, Beck Depression Inventory.
The IRT-derived true score of depression severity (θ) correlated 0.95, 0.92, 0.90 and 0.90 with the MADRS, HAMD-17, HAMD-6 and BDI total scores respectively. The accuracy of measurement across the spectrum of depression severity was reflected in the total test information curves (Fig. 2). These showed an advantage for the MADRS and BDI over HAMD across the severity spectrum. The MADRS adequately covered a broad range of severity from −1.6 to 3.0 of the standardized θ scale. Table 5 provides the most likely summed scores for each instrument corresponding to different levels of the IRT true score of depression severity.

Fig. 2. Total test information: total test information is the inverse of measurement error and reflects the accuracy of depression severity estimation. It varies with the level of depression severity shown in standardized units. –●–, Montgomery–Asberg Depression Rating Scale; – –◊– –, Beck Depression Inventory; · · ·■· · ·, 17-item Hamilton Depression Rating Scale.
Table 5. Equivalent summed scores estimates. θ is the IRT estimate of depression severity in a standardized z score

IRT, Item response theory; BDI, Beck Depression Inventory; MADRS, Montgomery–Asberg Depression Rating Scale; HAMD-17, 17-item Hamilton Depression Rating Scale; HAMD-6, six-item Hamilton Depression Rating Scale.
Discussion
By including the three most commonly used instruments for measuring the severity of depression in a large sample, the GENDEP study has provided an opportunity for a comprehensive psychometric comparison of the three scales. The CTT and IRT results were in agreement, indicating that of the three instruments examined here, MADRS provided the most accurate reflection of depression severity in a predominantly out-patient sample. It was internally consistent and measured depression accurately over a broad range of severity. The most severe MADRS response category (6) was rarely applied, suggesting that there was a margin for measuring depression in severe cases not routinely included in out-patient trials. Our results replicated a previous study demonstrating an advantage of MADRS over HAMD in out-patient clinical trial samples (Carmody et al. Reference Carmody, Rush, Bernstein, Warden, Brannan, Burnham, Woo and Trivedi2006). For practical purposes MADRS can be considered to be unidimensional, although four of its items loaded on factors other than the core depression severity, and separation of these factors may help in a detailed examination of depressive symptomatology.
The self-report BDI was internally consistent and provided accurate measurement across a broad spectrum of depression severity. However, the BDI appeared to measure a distinct ‘cognitive’ dimension of depression, which was strongly correlated but not identical with the observer-rated depression. Even items measuring mood and activity were more highly correlated with other self-report items than with clinician-rated items of corresponding content. As the study has not been able to distinguish the relative validity of clinician rating and self-report, we propose that the two approaches should be regarded as distinct and complementary, and their relative and joint merits should be explored in their various applications.
In the present sample, the HAMD-17 proved to be internally less consistent and to have provided a less accurate measurement of depression. Several items had limited distribution of values and had little relationship to other items. These were insight, agitation, hypochondriasis and genital symptoms, which have been found to have poor psychometric properties in numerous previous investigations (Rehm & O'Hara, Reference Rehm and O'Hara1985; Santor & Coyne, Reference Santor and Coyne2001; Bagby et al. Reference Bagby, Ryder, Schuller and Marshall2004; Evans et al. Reference Evans, Sills, DeBrota, Gelwicks, Engelhardt and Santor2004; Carmody et al. Reference Carmody, Rush, Bernstein, Warden, Brannan, Burnham, Woo and Trivedi2006). The apparent poor results may have been due to a mismatch between the population under study and the sample on which the HAMD was developed and validated. The HAMD-17 was developed for use with psychiatric in-patients diagnosed with unipolar and bipolar affective disorder but went on to become the most common scale used in treatment trials on unipolar depressed out-patients (Elkin et al. Reference Elkin, Shea, Watkins, Imber, Sotsky, Collins, Glass, Pilkonis, Leber and Docherty1989; Bagby et al. Reference Bagby, Ryder, Schuller and Marshall2004). Although lack of insight is common among hospitalized patients, it would be ethically unacceptable to recruit insightless individuals (who would lack capacity to give informed consent) into a randomized treatment trial. It was therefore not surprising that, on 92% occasions, lack of insight was rated as 0 in the present study. Another item with poor distribution of values was agitation; observable agitation is meaningful among severely depressed in-patients whereas it is less consistent with daily functioning and participation in an out-patient trial. In the present sample, agitation was strongly associated with anxiety, and added little information beyond that obtained from the anxiety items.
In view of the large differences in psychometric properties between items, it is legitimate to seek short versions without problematic items. We therefore investigated the properties of the HAMD-6 (Bech et al. Reference Bech, Gram, Dein, Jacobsen, Vitger and Bolwig1975), which appeared to be unidimensional. Its items were more discriminatory and related more to the core concept of depression than other HAMD-17 items. However, it provided less information on depression severity (while not plotted separately in Fig. 2, the total test information of any item subset cannot surpass that of the full scale as it is a sum of information of individual items) and, compared to MADRS, showed marginally lower correlation, with the best estimate of true depression severity derived from all three scales. Therefore, the MADRS showed better psychometric properties compared to any reduced version of the HAMD.
A single score of depression severity is attractive for practical purposes and the IRT score provided its best available estimate. However, the syndrome of depression is complex and, especially in the context of aetiological research, may best be described by several related dimensions. We propose an interpretable three-factor solution as a descriptive system for future research. The observed mood and anxiety, cognitive and neurovegetative factors closely replicated those derived from symptom ratings in a diagnostic interview, which were shown to differ in their aetiology (Korszun et al. Reference Korszun, Moskvina, Brewster, Craddock, Ferrero, Gill, Jones, Jones, Maier, Mors, Owen, Preisig, Reich, Rietschel, Farmer and McGuffin2004). It was also consistent with dimensions derived from factorial analyses of individual scales (Shafer, Reference Shafer2006) and mapped well to the rather complex 10-factor solution derived in a study integrating self-report and clinician-rated instruments (Gullion & Rush, Reference Gullion and Rush1998). Extraction of up to six factors is supported by the parallel analysis, and in the six-factor solution, each of the three main factors separated into two facets. However, item cross-loading, floor effects in factor scores and small number of items in some of the six factors indicated that the three-factor solution was more viable. The usefulness of the three factors as opposed to individual scales and the total IRT score needs to be tested by external validation.
Several methodological issues bear on the comparability of the present study with previous investigations. First, on the assumption that depression has a subjective and objective component, we have integrated the items of self-rated and clinician-rated instruments in a single analysis. This led to a degree of redundancy: for example, there was an item for mood, activity or suicide on each scale. Such redundancy did not influence the IRT score estimation; in contrast to summed scores, addition of another item with the same threshold and same response did not change the score estimate under the IRT framework. However, the inclusion of a number of similar items may have influenced the results of the EFA by defining a strong factor. Thus it is likely that, for example, the failure of the hypochondriasis and health anxiety items to strongly load onto any factor was simply because too few related items were included. We contend that the item composition of the three commonly used scales is a good reflection of the concept of depression. Moreover, an apparent content overlap does not necessarily mean redundancy. For example, the finding that mood items of self-report and clinician-rated scales load on distinct factors was enlightening. Second, we have extracted one rating per individual randomly. The results of the longitudinal CFA indicated that the factor structure derived from the random sample generalized to different time points and was largely invariant over time. However, a replication in an independent sample is needed to establish the generalizability of the findings.
In conclusion, we have compared three commonly used instruments for measuring depression severity in a large sample of depressed out-patients. We conclude that the MADRS and BDI provide internally valid but slightly discordant estimates of depression severity. The HAMD-17 does not appear to be suitable for out-patient samples. We propose an overall score derived from the combined pool of clinician-rated and self-rated items as well as three specific factor scales for external validation in future research.
Acknowledgements
We thank all study participants, researchers and clinicians who have contributed to the study. GENDEP is funded by a European Commission Framework 6 grant; contract number LSHB-CT-2003-503428. We thank Lundbeck for supplying medication (escitalopram and nortriptyline) for this study. We also thank GlaxoSmithKline for contributing to the funding of the sample collection at the Institute of Psychiatry, London, through an add-on project. The funding bodies had no influence on the design, analysis or interpretation of the study results.
Declaration of Interest
N. Henigsberg participated in clinical trials sponsored by pharmaceutical companies including GlaxoSmithKline and Lundbeck. M. Bajs participated in clinical trials sponsored by pharmaceutical companies including GlaxoSmithKline. A. Farmer, P. McGuffin and K. J. Aitchison have received consultancy fees, honoraria for presentations and participating in expert panels from pharmaceutical companies including Lundbeck and GlaxoSmithKline.


