


1 Introduction
Many multiphase flow applications in porous media, e.g. drying or oil recovery processes, involve fluid transport within liquid films present due to capillary effects in the pore space. As the main application behind the work presented in this paper is drying (Van Brakel Reference Van Brakel and Mujumdar1980; Scherer Reference Scherer1990), we will detail the effect of liquid films on the drying kinetics of a porous medium.
Starting with a porous medium saturated with a volatile liquid, a first drying stage displaying a constant evaporation rate (constant-rate period, CRP) is usually observed. During this first period, the liquid is transported across a partially saturated region to the sample surface. In the partially saturated region, hydraulic connectivity is ensured by a network of liquid-filled pores and thick films in partially filled pores. In fact, as the liquid evaporates, ‘thick’ liquid films (by contrast with thin liquid films adsorbed by surface forces on the solid matrix) remain trapped by capillary forces within the pore space, in the crevices, cracks, contacts between constituting particles, etc., depending on the considered porous medium. As saturation in the partially saturated region decreases, liquid transport to the evaporative surface eventually takes place within a network of connected liquid films, under the action of the capillary pressure gradient induced by the variation in meniscus curvature along the films (capillary pumping). The evaporation rate in the CRP is controlled by external environmental conditions (relative humidity and temperature of the external air, the presence or absence of an external flow, etc.). The existence of such a partially saturated region has been demonstrated by the use of three-dimensional (3D) imaging techniques such as magnetic resonance imaging (MRI) (Shahidzadeh-Bonn, Azouni & Coussot Reference Shahidzadeh-Bonn, Azouni and Coussot2007) and X-ray tomography, the latter having a high enough spatial resolution to image the 3D liquid film network that ensures hydraulic connectivity from the liquid-saturated region to the evaporative surface (see e.g. Kohout, Grof & Štěpánek Reference Kohout, Grof and Štěpánek2006; Shokri, Lehmann & Or Reference Shokri, Lehmann and Or2010; Yang et al. Reference Yang, Griffa, Bonnin, Mokso, Bella, Münch, Kaufmann and Lura2015). Note that such a liquid film network is also a key element when considering the mechanical properties (e.g. cohesion energy) of wet granular media (Scheel et al. Reference Scheel, Seemann, Brinkmann, Di Michiel, Sheppard, Breidenbach and Herminghaus2008a ).
In a second drying period, the evaporation rate decreases rather sharply and this is attributed to the progressive formation of a dry region below the porous medium evaporative surface (falling-rate period, FRP). The transition from the CRP to this second period occurs when the partially saturated zone has reached a maximal extent, which results from a balance between capillary pumping, which drives the flow up to the evaporative surface, and the opposing effects of gravitational force (hydrostatic pressure drop) and viscous dissipation (pressure drop induced by the evaporation-driven flow taking place within the films). Again, 3D imaging techniques have shown that the fall of the drying rate is correlated with the appearance of dry patches at the sample surface, with a large enough extent to have an impact on drying rate.
Finally, a third drying stage, called receding-front period (RFP), is sometimes introduced. It is characterized by the existence of a fully dry region below the sample surface. While during the FRP some evaporation still takes place at the sample surface, the evaporation takes place inside the porous structure during the RFP. As a result, the drying rate decrease is different in the FRP and in the RFP.
Since the pioneering works on drying (Lewis Reference Lewis1921; Sherwood Reference Sherwood1929a
,Reference Sherwood
b
; Ceaglske & Hougen Reference Ceaglske and Hougen1937), describing the different drying regimes and the transitions between them has been the subject of many studies, based on scaling analysis (Tsimpanogiannis et al.
Reference Tsimpanogiannis, Yortsos, Poulou, Kanellopoulos and Stubos1999; Coussot Reference Coussot2000; Lehmann, Assouline & Or Reference Lehmann, Assouline and Or2008) and pore network or continuous modelling (see e.g. Yiotis et al.
Reference Yiotis, Boudouvis, Stubos, Tsimpanogiannis and Yortsos2003, Reference Yiotis, Boudouvis, Stubos, Tsimpanogiannis and Yortsos2004; Prat Reference Prat2007, Reference Prat2011). From an experimental perspective, the study of drying has also benefited from the use of model systems, geometrically much simpler than a ‘real’ porous medium, such as the packing of beads confined in a Hele-Shaw cell (Shaw Reference Shaw1987) or microfabricated quasi-two-dimensional model porous media, hereafter called micromodels (Laurindo & Prat Reference Laurindo and Prat1998). Note, however, that such studies are relatively few, especially when compared to other ‘classical’ porous-media-related research topics, where micromodels have became a standard tool since the pioneering works of Lenormand, Touboul & Zarcone (Reference Lenormand, Touboul and Zarcone1988) – see, for instance, recent works on supercritical
 $\text{CO}_{2}$
trapping (Hu et al.
Reference Hu, Wan, Kim and Tokunaga2017), oil recovery (Lacey et al.
Reference Lacey, Hollis, Oostrom and Shokri2017), rheology (Machado et al.
Reference Machado, Bodiguel, Beaumont, Clisson and Colin2016) or immiscible fluid displacement (Jung et al.
Reference Jung, Brinkmann, Seemann, Hiller, de La Lama and Herminghaus2016). Regarding drying, recent advances have come from a simpler model system that retains the liquid film ingredient: capillary tubes with polygonal cross-sections (Chauvet et al.
Reference Chauvet, Duru, Geoffroy and Prat2009; Keita et al.
Reference Keita, Koehler, Faure, Weitz and Coussot2016).
$\text{CO}_{2}$
trapping (Hu et al.
Reference Hu, Wan, Kim and Tokunaga2017), oil recovery (Lacey et al.
Reference Lacey, Hollis, Oostrom and Shokri2017), rheology (Machado et al.
Reference Machado, Bodiguel, Beaumont, Clisson and Colin2016) or immiscible fluid displacement (Jung et al.
Reference Jung, Brinkmann, Seemann, Hiller, de La Lama and Herminghaus2016). Regarding drying, recent advances have come from a simpler model system that retains the liquid film ingredient: capillary tubes with polygonal cross-sections (Chauvet et al.
Reference Chauvet, Duru, Geoffroy and Prat2009; Keita et al.
Reference Keita, Koehler, Faure, Weitz and Coussot2016).
The drying of capillary tubes with square cross-sections was thoroughly studied by Chauvet et al. (Reference Chauvet, Duru, Geoffroy and Prat2009, Reference Chauvet, Cazin, Duru and Prat2010a ) and Chauvet, Duru & Prat (Reference Chauvet, Duru and Prat2010b ), and was shown to display a succession of drying regimes similar to those documented for a porous medium and summarized above. In fact, while the tube liquid saturation decreases, elongated films remain trapped along the tube internal corners and transport the liquid from the liquid-saturated region to the tube open end, where evaporation occurs. Consequently, a constant-evaporation-rate period (CRP) is first observed. Depinning of the films from the tube top causes a sudden decrease of the evaporation rate (FRP) before a third period, characterized by the development of a dry region in the tube top part (RFP). Modelling the flow in the corner films and using experimental data for the evaporation rate, the authors predicted the films’ maximal extent as a function of Bond and capillary numbers, in good agreement with the experimental data. They notably highlighted the importance of the roundedness of the tube internal corners through its key impact on the viscous resistance to evaporation-induced flow (Chauvet et al. Reference Chauvet, Duru and Prat2010b ). Such an understanding of the transition between the drying regimes, gained from a simple model system, has been used in an ad hoc fashion to describe the drying of packed beads (Yiotis et al. Reference Yiotis, Salin, Tajer and Yortsos2012a ,Reference Yiotis, Salin, Tajer and Yortsos b ) and has inspired more realistic pore network modelling techniques (Vorhauer et al. Reference Vorhauer, Wang, Karaghani, Tsotsas and Prat2015).
However, the elongated corner liquid films found in polygonal cross-section capillary tubes have a well-described and simple interface shape, and it might be expected that the square capillary tube analogy has some limits when it comes to explaining and/or predicting the transport properties of liquid films of much more complex shapes, such as those imaged in 3D packings of beads. In fact, Scheel et al. (Reference Scheel, Seemann, Brinkmann, Di Michiel, Sheppard, Breidenbach and Herminghaus2008a ,Reference Scheel, Seemann, Brinkmann, Di Michiel, Sheppard and Herminghaus b ), using close inspection of 3D X-ray tomography images, have shown that the liquid clusters present in a packing of spherical beads can be classified at low liquid content into several generic classes of morphologies: liquid bridges between two particles, three particles (‘trimers’), four particles (‘pentamers’) and so on. The coalescence of such basic units at higher liquid content leads to a complex 3D liquid ‘lace’ with long-range hydraulic connectivity within the resulting liquid cluster (Scheel et al. Reference Scheel, Seemann, Brinkmann, Di Michiel, Sheppard, Breidenbach and Herminghaus2008a ), which certainly provides a good idea of the 3D liquid film networks obtained in drying and at play during the CRP. Interestingly, Cejas et al. (Reference Cejas, Hough, Frétigny and Dreyfus2016) recently reported some experiments on the drying of a single column of spherical beads, confined in a capillary tube. They related the experimentally observed drying kinetics to the topology of the film network, which displays a transition between funicular and pendular regimes, respectively with and without long-range connectivity, depending on the granular packing configuration within the tube.
In this paper, the goal is to study drying in a model system displaying liquid films with shapes more complex than those found in straight, square capillary tubes, as a step towards real 3D film networks such as those described above, and to study the relationship between the drying kinetics and the liquid film topology and hydraulic conductivity. To that end, we study the drying of a micromodel consisting of cylindrical pillars arranged in a phyllotaxy-inspired spiral pattern (Douady & Couder Reference Douady and Couder1992), and sandwiched between two horizontal flat plates. As discussed in Chen et al. (Reference Chen, Duru, Joseph, Geoffroy and Prat2017), such a design enables the formation of elongated liquid films consisting of ‘chains’ of liquid bridges between cylinders, as the drying of the initially saturating liquid occurs, which provide long-range connectivity within this model porous medium. Thus, the liquid bridges between two constitutive particles of the solid matrix (i.e. the cylinders) in the micromodel used in the present study are conceptually akin to those found between spherical particles in a packing of beads, and imaged by Scheel et al. (Reference Scheel, Seemann, Brinkmann, Di Michiel, Sheppard, Breidenbach and Herminghaus2008a ,Reference Scheel, Seemann, Brinkmann, Di Michiel, Sheppard and Herminghaus b ).
After presenting in § 2 the experimental set-up and techniques used in the present study, the main experimental results are set out in § 3. We show that the drying kinetics follows the usual picture presented briefly above, with a transition between a constant-rate period and a falling-rate period controlled by the extent of the liquid films in the micromodel. Also, the invasion of the model porous medium under study can be described by a succession of two different kinds of events: invasion of a pore or modification of the liquid film topology (film extent and film external end location within the micromodel). In § 4, the focus is the modelling of the drying invasion pattern, using the measured drying rates as input. The effect of gravity can be neglected in the present study (small Bond numbers). Then, the liquid film dynamics results from a balance between capillary and viscous effects. The former depend on the local pore-space geometry and play a key role in the pore invasion process and the presence of liquid bridges between neighbouring cylinders, which partly control the films extent via the transition between a funicular regime, where liquid bridges ‘connect’ several cylinders along a spiral, and a pendular regime, where such a connection is lost. Some of these aspects are studied using simulations of interfacial shapes with the Surface Evolver software (Brakke Reference Brakke1992). The viscous effects are related to the evaporation-induced flow in the elongated films, which induces pressure variations within the liquid films. The viscous dissipation modelling requires direct numerical simulations of the Stokes flow within the liquid bridges. Finally, we develop a viscocapillary model that is in a reasonable agreement with the data obtained, as far as the drying invasion pattern is concerned. Therefore, the present work can be seen as a step in the study of transport in networks of liquid films of complex shape.
2 Experimental set-up and techniques
2.1 Micromodel design and microfabrication
Figure 1 shows the full micromodel pattern: 661 cylinders of diameter
 $d_{c}$
are arranged along 28 spirals and sandwiched between two plates, separated by a height
$d_{c}$
are arranged along 28 spirals and sandwiched between two plates, separated by a height
 $h$
. In figure 1, the cylinders along a given spiral are marked out by an integer number between 1 and 24, with the number 1 for the most external cylinder. The centre-to-centre distances between two neighbouring cylinders along a given spiral,
$h$
. In figure 1, the cylinders along a given spiral are marked out by an integer number between 1 and 24, with the number 1 for the most external cylinder. The centre-to-centre distances between two neighbouring cylinders along a given spiral,
 $w_{/\!/}$
, and between a cylinder and its closest neighbour in the adjacent spiral (in the anticlockwise direction),
$w_{/\!/}$
, and between a cylinder and its closest neighbour in the adjacent spiral (in the anticlockwise direction),
 $w_{\bot }$
, are shown in figure 2. In this paper, we present results obtained on micromodels designed with
$w_{\bot }$
, are shown in figure 2. In this paper, we present results obtained on micromodels designed with
 $h=d_{c}=50~\unicode[STIX]{x03BC}\text{m}$
. Note that in order to validate the image processing algorithm used to measure the amount of liquid within a micromodel against data obtained using a balance (see § 2.3), we also had to use a larger micromodel, with
$h=d_{c}=50~\unicode[STIX]{x03BC}\text{m}$
. Note that in order to validate the image processing algorithm used to measure the amount of liquid within a micromodel against data obtained using a balance (see § 2.3), we also had to use a larger micromodel, with
 $d_{c}=500~\unicode[STIX]{x03BC}\text{m}$
and
$d_{c}=500~\unicode[STIX]{x03BC}\text{m}$
and
 $h=525~\unicode[STIX]{x03BC}\text{m}$
.
$h=525~\unicode[STIX]{x03BC}\text{m}$
.
The microfabrication protocol combines the classical photolithography exposure, bake and development steps with the commonly used epoxy-based SU8 photoresist as a material. It is detailed in Chen (Reference Chen2016) and we only highlight here some of its key features. First, it is important to note that, for the large micromodel, the glass bottom plate is covered by a
 $10~\unicode[STIX]{x03BC}\text{m}$
thick SU8 layer, prior to the realization of the cylinders. The glass top plate is also covered by a
$10~\unicode[STIX]{x03BC}\text{m}$
thick SU8 layer, prior to the realization of the cylinders. The glass top plate is also covered by a
 $10~\unicode[STIX]{x03BC}\text{m}$
thick SU8 layer before bonding. Thus, all the surfaces in contact with the liquid are made of SU8; see figure 1. Second, the protocol for the small system differs from that used for the large system in one major point: the top plate consists of only a
$10~\unicode[STIX]{x03BC}\text{m}$
thick SU8 layer before bonding. Thus, all the surfaces in contact with the liquid are made of SU8; see figure 1. Second, the protocol for the small system differs from that used for the large system in one major point: the top plate consists of only a
 $20~\unicode[STIX]{x03BC}\text{m}$
dry epoxy film (DF1020 negative photoresist), which is laminated on top of the bottom part of the micromodel (after the pattern of cylinders has been completed). The circular shape of the top plate is obtained following a photolithography exposure, bake and development procedure, during which good alignment of the top plate is ensured (whereas it is done manually in the large micromodel). Characterization of the bottom plates of the micromodels after microfabrication by optical profilometry and scanning electron microscopy (SEM) ensured that the designed dimensions were well reproduced, typically within a few micrometres.
$20~\unicode[STIX]{x03BC}\text{m}$
dry epoxy film (DF1020 negative photoresist), which is laminated on top of the bottom part of the micromodel (after the pattern of cylinders has been completed). The circular shape of the top plate is obtained following a photolithography exposure, bake and development procedure, during which good alignment of the top plate is ensured (whereas it is done manually in the large micromodel). Characterization of the bottom plates of the micromodels after microfabrication by optical profilometry and scanning electron microscopy (SEM) ensured that the designed dimensions were well reproduced, typically within a few micrometres.

Figure 1. Micromodel pattern. Top right: Along a given spiral, the centre-to-centre distance between two cylinders is denoted
 $w_{/\!/}$
whereas the distance between a cylinder and its closest neighbour in the adjacent spiral (in the anticlockwise direction) is denoted
$w_{/\!/}$
whereas the distance between a cylinder and its closest neighbour in the adjacent spiral (in the anticlockwise direction) is denoted
 $w_{\bot }$
. Bottom-right: Side view of the micromodel edge, for the large micromodel with
$w_{\bot }$
. Bottom-right: Side view of the micromodel edge, for the large micromodel with
 $d_{c}=500~\unicode[STIX]{x03BC}\text{m}$
and
$d_{c}=500~\unicode[STIX]{x03BC}\text{m}$
and
 $h=525~\unicode[STIX]{x03BC}\text{m}$
. The distance between the circular top plate and the rim of the cylinder pattern is
$h=525~\unicode[STIX]{x03BC}\text{m}$
. The distance between the circular top plate and the rim of the cylinder pattern is
 $2d_{c}$
. The SU8 photoresist appears in grey. Note that there is no glass top plate for the small micromodel (
$2d_{c}$
. The SU8 photoresist appears in grey. Note that there is no glass top plate for the small micromodel (
 $d_{c}=h=50~\unicode[STIX]{x03BC}\text{m}$
): the DF1020 top film is directly laminated on the pattern of cylinders.
$d_{c}=h=50~\unicode[STIX]{x03BC}\text{m}$
): the DF1020 top film is directly laminated on the pattern of cylinders.

Figure 2. Distance between neighbouring cylinders,
 $w_{/\!/}$
and
$w_{/\!/}$
and
 $w_{\bot }$
(see figure 1), made dimensionless by dividing by twice the cylinder diameter
$w_{\bot }$
(see figure 1), made dimensionless by dividing by twice the cylinder diameter
 $d_{c}$
, plotted as a function of the cylinder number along a given spiral.
$d_{c}$
, plotted as a function of the cylinder number along a given spiral.
2.2 Protocol for a drying experiment
The micromodel is positioned horizontally on top of a plane light-emitting diode (LED) light source (Phlox LedW-BL) and is imaged from the top by a sCMOS Lavision camera with a 2048 pixel
 $\times$
2048 pixel sensor. The micromodel and LED back-light are therefore perpendicular to the optical axis. The spatial resolution is typically around 1.8 pixel per micrometre (for micromodels with
$\times$
2048 pixel sensor. The micromodel and LED back-light are therefore perpendicular to the optical axis. The spatial resolution is typically around 1.8 pixel per micrometre (for micromodels with
 $h=d_{c}=50~\unicode[STIX]{x03BC}\text{m}$
). The images are acquired at a fixed acquisition rate, from 0.01 Hz to 100 Hz depending on the experiment. The LED light source is triggered by an external source and synchronized with image acquisition. A small droplet of the working liquid is gently deposited at the edge of the device and then fully fills the micromodel by capillary suction. Image acquisition is then immediately launched to follow the liquid evaporation. The experiments are performed in a temperature-controlled environment, with
$h=d_{c}=50~\unicode[STIX]{x03BC}\text{m}$
). The images are acquired at a fixed acquisition rate, from 0.01 Hz to 100 Hz depending on the experiment. The LED light source is triggered by an external source and synchronized with image acquisition. A small droplet of the working liquid is gently deposited at the edge of the device and then fully fills the micromodel by capillary suction. Image acquisition is then immediately launched to follow the liquid evaporation. The experiments are performed in a temperature-controlled environment, with
 $T=22\pm 1\,^{\circ }\text{C}$
. Evaporation takes place in a stagnant and ‘dry’ air atmosphere: there is no imposed external air flow and the vapour concentration in the room is assumed to be zero.
$T=22\pm 1\,^{\circ }\text{C}$
. Evaporation takes place in a stagnant and ‘dry’ air atmosphere: there is no imposed external air flow and the vapour concentration in the room is assumed to be zero.
Several liquids were used and their relevant thermophysical properties are listed in table 1. Data for dynamic viscosity
 $\unicode[STIX]{x1D707}_{f}$
and vapour pressure at the working temperature were obtained using tabulated values and estimating methods proposed by Reid, Prausnitz & Sherwood (Reference Reid, Prausnitz and Sherwood1987). Data for surface tension are from Jasper & Kring (Reference Jasper and Kring1955). The error bars given come from the uncertainty on the working temperature,
$\unicode[STIX]{x1D707}_{f}$
and vapour pressure at the working temperature were obtained using tabulated values and estimating methods proposed by Reid, Prausnitz & Sherwood (Reference Reid, Prausnitz and Sherwood1987). Data for surface tension are from Jasper & Kring (Reference Jasper and Kring1955). The error bars given come from the uncertainty on the working temperature,
 $\pm 1\,^{\circ }\text{C}$
. Data for the vapour–air diffusion coefficient
$\pm 1\,^{\circ }\text{C}$
. Data for the vapour–air diffusion coefficient
 $D$
were obtained from various references (Cummings & Ubbelohde Reference Cummings and Ubbelohde1953; Altshuller & Cohen Reference Altshuller and Cohen1960; Lugg Reference Lugg1968; Elliott & Watts Reference Elliott and Watts1972; Beverley, Clint & Fletcher Reference Beverley, Clint and Fletcher1999) and extrapolated to
$D$
were obtained from various references (Cummings & Ubbelohde Reference Cummings and Ubbelohde1953; Altshuller & Cohen Reference Altshuller and Cohen1960; Lugg Reference Lugg1968; Elliott & Watts Reference Elliott and Watts1972; Beverley, Clint & Fletcher Reference Beverley, Clint and Fletcher1999) and extrapolated to
 $22\pm 1\,^{\circ }\text{C}$
using expressions for temperature corrections found in Vargaftik (Reference Vargaftik1975). The uncertainties on
$22\pm 1\,^{\circ }\text{C}$
using expressions for temperature corrections found in Vargaftik (Reference Vargaftik1975). The uncertainties on
 $D$
indicated in table 1 were estimated from the scatter in the available data. All these liquids perfectly wet SU8 and DF1020: when a drop is deposited on a flat SU8 or DF1020 substrate, the liquid fully spreads, rendering any measurement of the contact angle unfeasible. In the following, the contact angle will therefore be assumed to be zero.
$D$
indicated in table 1 were estimated from the scatter in the available data. All these liquids perfectly wet SU8 and DF1020: when a drop is deposited on a flat SU8 or DF1020 substrate, the liquid fully spreads, rendering any measurement of the contact angle unfeasible. In the following, the contact angle will therefore be assumed to be zero.

Figure 3. Typical image of a micromodel. (a) Raw image, for a micromodel filled with heptane, with a resolution of 1.8 pixel per micrometre. (b) Zoom on the region of interest delimited by a dotted rectangle in panel (a). (c) Binarized image. (d) Binarized image after filling of the central liquid cluster.
Table 1. Working liquid properties at
 $22\,^{\circ }\text{C}$
:
$22\,^{\circ }\text{C}$
:
 $\unicode[STIX]{x1D70C}_{f}$
,
$\unicode[STIX]{x1D70C}_{f}$
,
 $\unicode[STIX]{x1D707}_{f}$
,
$\unicode[STIX]{x1D707}_{f}$
,
 $\unicode[STIX]{x1D6FE}$
and
$\unicode[STIX]{x1D6FE}$
and
 $D$
correspond to liquid mass density, dynamic viscosity, surface tension and vapour diffusion coefficient in air, respectively.
$D$
correspond to liquid mass density, dynamic viscosity, surface tension and vapour diffusion coefficient in air, respectively.

2.3 Image processing
In the present study, all the relevant experimental data (i.e. evaporation rates, phase distribution and liquid film extent) were obtained by image processing. A typical image obtained with the CCD camera is shown in figure 3(a). The meniscus surrounding the central liquid cluster deviates the almost parallel light coming from the back-light and appears as the darkest region on such an image. This is better seen in the close-up on the region of interest delimited by the dotted rectangle in figure 3(a), see figure 3(b), where the cylinders embedded in the liquid cluster can also be seen. The very good spatial resolution and the wide dynamic range of such images allow us to perform quantitative measurements at the scale of the cylinders, e.g. regarding the width of the liquid bridges connecting two neighbouring cylinders, along a spiral.
The volume of liquid contained within the micromodel can be measured by image processing, at any time of the drying experiment, as explained in the following. The contrast between the dark meniscus region and the bulk fluid regions (liquid or air) is large enough so that applying a binarization operation is straightforward, leading to the image shown in figure 3(c), which is then filled, figure 3(d). On such an image, the total area of the white region,
 $A$
, can be readily obtained by image processing (using the Matlab regionprops built-in function). Similarly, one can detect any cylinder that is no longer wetted by the liquid and thus appears as an isolated disk. Knowing the total number of cylinders, one can have a first estimate of the liquid volume
$A$
, can be readily obtained by image processing (using the Matlab regionprops built-in function). Similarly, one can detect any cylinder that is no longer wetted by the liquid and thus appears as an isolated disk. Knowing the total number of cylinders, one can have a first estimate of the liquid volume
 $V$
in the micromodel,
$V$
in the micromodel,
 $V=Ah-N_{w}V_{p}$
, where
$V=Ah-N_{w}V_{p}$
, where
 $N_{w}$
is the measured number of cylinders embedded in the liquid cluster and
$N_{w}$
is the measured number of cylinders embedded in the liquid cluster and
 $V_{p}=\unicode[STIX]{x03C0}hd_{c}^{2}/4$
is the volume of a cylinder. Then, one has to note that the white region of area
$V_{p}=\unicode[STIX]{x03C0}hd_{c}^{2}/4$
is the volume of a cylinder. Then, one has to note that the white region of area
 $A$
seen in figure 3(c) takes into account the projected area of the meniscus. This latter area,
$A$
seen in figure 3(c) takes into account the projected area of the meniscus. This latter area,
 $A_{m}$
, can be obtained from the image shown in figure 3(b), before the filling operation is applied. In the meniscus region, the liquid is not present over the full height
$A_{m}$
, can be obtained from the image shown in figure 3(b), before the filling operation is applied. In the meniscus region, the liquid is not present over the full height
 $h$
of the micromodel and this has to be taken into account. In fact, the formula above giving
$h$
of the micromodel and this has to be taken into account. In fact, the formula above giving
 $V$
overestimates the liquid volume, whereas the alternative expression
$V$
overestimates the liquid volume, whereas the alternative expression
 $V=(A-A_{m})h-N_{w}V_{p}$
underestimates it.
$V=(A-A_{m})h-N_{w}V_{p}$
underestimates it.
To estimate the amount of liquid in the meniscus region, we used the Surface Evolver software (Brakke Reference Brakke1992) to simulate the capillary shape of a static liquid bridge located in between two cylinders, confined between two horizontal plates. Starting from an initial ‘guess’ shape for the static liquid bridge, Surface Evolver progressively converges towards the meniscus shape by minimizing the surface energy, given a set of constraints (e.g. contact angle on solid surface and liquid volume). During the evolution procedure, the surface can be progressively refined by the user, by increasing the number of facets that shape it. In the present study, shape convergence was typically considered to be reached when the surface energy varied by less than 0.2 % between two successive surface evolution steps, its value being at the same time ‘robust’ to operations like surface refinement, vertices averaging, etc. Let us consider a typical liquid bridge shape, as shown in figure 4. We introduce
 $\unicode[STIX]{x1D706}$
such that the liquid content in the meniscus region is
$\unicode[STIX]{x1D706}$
such that the liquid content in the meniscus region is
 $\unicode[STIX]{x1D706}\times A_{p}h$
, where
$\unicode[STIX]{x1D706}\times A_{p}h$
, where
 $A_{p}$
is the projected meniscus area in the
$A_{p}$
is the projected meniscus area in the
 $z=0$
plane. The coefficient
$z=0$
plane. The coefficient
 $\unicode[STIX]{x1D706}$
can be computed from liquid bridge shapes obtained by Surface Evolver simulations. It depends on the spacing
$\unicode[STIX]{x1D706}$
can be computed from liquid bridge shapes obtained by Surface Evolver simulations. It depends on the spacing
 $w_{/\!/}$
between the cylinders, on the liquid volume trapped in the liquid bridge and on the contact angle. The values obtained for
$w_{/\!/}$
between the cylinders, on the liquid volume trapped in the liquid bridge and on the contact angle. The values obtained for
 $\unicode[STIX]{x1D706}$
typically range between 0.13 and 0.2. In the following, we assume that the volume of liquid
$\unicode[STIX]{x1D706}$
typically range between 0.13 and 0.2. In the following, we assume that the volume of liquid
 $V$
in the micromodel can be obtained as
$V$
in the micromodel can be obtained as
 $Ah-(1-\unicode[STIX]{x1D706})A_{m}h-N_{w}V_{p}$
, where
$Ah-(1-\unicode[STIX]{x1D706})A_{m}h-N_{w}V_{p}$
, where
 $A$
,
$A$
,
 $A_{m}$
and
$A_{m}$
and
 $N_{w}$
are obtained by image processing as explained above, and taking
$N_{w}$
are obtained by image processing as explained above, and taking
 $\unicode[STIX]{x1D706}$
equal to a single typical value of 0.16. This comes down to assuming that the liquid content in the meniscus region can be estimated by determining
$\unicode[STIX]{x1D706}$
equal to a single typical value of 0.16. This comes down to assuming that the liquid content in the meniscus region can be estimated by determining
 $\unicode[STIX]{x1D706}$
on the similar, but simpler, liquid bridge geometry shown in figure 4.
$\unicode[STIX]{x1D706}$
on the similar, but simpler, liquid bridge geometry shown in figure 4.

Figure 4. Typical liquid bridge capillary shape obtained from Surface Evolver. The liquid bridge is trapped between two cylinders and confined between two flat surfaces located in the
 $z=0$
and
$z=0$
and
 $z=h$
planes (not displayed). The two cylinders, of diameter
$z=h$
planes (not displayed). The two cylinders, of diameter
 $d_{c}$
, appear in light grey and are separated by
$d_{c}$
, appear in light grey and are separated by
 $w_{/\!/}$
(here,
$w_{/\!/}$
(here,
 $w_{/\!/}=d_{c}$
). The contact angle between the liquid and the solid surfaces is
$w_{/\!/}=d_{c}$
). The contact angle between the liquid and the solid surfaces is
 $0^{\circ }$
.
$0^{\circ }$
.
This image processing-based technique for measuring the liquid content in the micromodel was validated against mass measurements performed with a Mettler-Toledo MS603S balance with a
 $\pm 0.001~\text{g}$
accuracy. Such a validation test was performed with the large micromodel only (
$\pm 0.001~\text{g}$
accuracy. Such a validation test was performed with the large micromodel only (
 $h=525~\unicode[STIX]{x03BC}\text{m}$
) for which the mass of liquid is around 0.3 g at the beginning of an experiment whereas it is three orders of magnitude smaller, well below the scale minimum weight limit, in the micromodels with
$h=525~\unicode[STIX]{x03BC}\text{m}$
) for which the mass of liquid is around 0.3 g at the beginning of an experiment whereas it is three orders of magnitude smaller, well below the scale minimum weight limit, in the micromodels with
 $h=50~\unicode[STIX]{x03BC}\text{m}$
used in the drying experiments. Figure 5 compares the mass data from the balance (squares) to those obtained by image processing (after multiplying the measured liquid volume by the liquid mass density). Crosses show the data obtained when the amount of liquid in the meniscus region is neglected (
$h=50~\unicode[STIX]{x03BC}\text{m}$
used in the drying experiments. Figure 5 compares the mass data from the balance (squares) to those obtained by image processing (after multiplying the measured liquid volume by the liquid mass density). Crosses show the data obtained when the amount of liquid in the meniscus region is neglected (
 $\unicode[STIX]{x1D706}=1$
), whereas dots show the data corrected taking
$\unicode[STIX]{x1D706}=1$
), whereas dots show the data corrected taking
 $\unicode[STIX]{x1D706}=0.16$
. The latter match nicely the data obtained from the balance. Note that taking
$\unicode[STIX]{x1D706}=0.16$
. The latter match nicely the data obtained from the balance. Note that taking
 $\unicode[STIX]{x1D706}=0.13$
or 0.19 results, at most, in a negligible 2.5 % variation of the mass obtained by image processing.
$\unicode[STIX]{x1D706}=0.13$
or 0.19 results, at most, in a negligible 2.5 % variation of the mass obtained by image processing.

Figure 5. Mass loss during evaporation of heptane in a large micromodel (
 $h=525~\unicode[STIX]{x03BC}\text{m}$
). Squares, data from a precision balance. Crosses, respectively dots: data from liquid volume measurements by image processing with
$h=525~\unicode[STIX]{x03BC}\text{m}$
). Squares, data from a precision balance. Crosses, respectively dots: data from liquid volume measurements by image processing with
 $\unicode[STIX]{x1D706}=1$
(no liquid in the meniscus region), respectively
$\unicode[STIX]{x1D706}=1$
(no liquid in the meniscus region), respectively
 $\unicode[STIX]{x1D706}=0.16$
.
$\unicode[STIX]{x1D706}=0.16$
.
3 Experimental results
3.1 Phase distribution and evaporation rate as a function of time
Figure 6 shows the liquid–gas distribution at four successive times,
 $t=0$
(beginning of the experiment),
$t=0$
(beginning of the experiment),
 $t=18~\text{s}$
,
$t=18~\text{s}$
,
 $t=62~\text{s}$
and
$t=62~\text{s}$
and
 $t=125~\text{s}$
, for evaporation of heptane. The experiment starting time,
$t=125~\text{s}$
, for evaporation of heptane. The experiment starting time,
 $t=0$
, is taken when the meniscus is fully positioned around the external end of the pattern, see figure 6(a). From
$t=0$
, is taken when the meniscus is fully positioned around the external end of the pattern, see figure 6(a). From
 $t=0$
to
$t=0$
to
 $t=18~\text{s}$
approximately, one can observe a progressive invasion of air between the spirals. Concomitantly with the gas-phase ingress, some elongated liquid films remain trapped along each spiral. In fact, the distances
$t=18~\text{s}$
approximately, one can observe a progressive invasion of air between the spirals. Concomitantly with the gas-phase ingress, some elongated liquid films remain trapped along each spiral. In fact, the distances
 $w_{/\!/}$
between two cylinders along a spiral are typically small enough to allow for coalescence between the liquid clusters left around each cylinder following air invasion, liquid clusters that would otherwise remain isolated (Chen et al.
Reference Chen, Duru, Joseph, Geoffroy and Prat2017). A liquid film can be described as a chain of liquid bridges between neighbouring cylinders, which first extends up to the spiral’s most external cylinder (see figure 6
b). At longer times (
$w_{/\!/}$
between two cylinders along a spiral are typically small enough to allow for coalescence between the liquid clusters left around each cylinder following air invasion, liquid clusters that would otherwise remain isolated (Chen et al.
Reference Chen, Duru, Joseph, Geoffroy and Prat2017). A liquid film can be described as a chain of liquid bridges between neighbouring cylinders, which first extends up to the spiral’s most external cylinder (see figure 6
b). At longer times (
 $t>18~\text{s}$
), the elongated films start to recede in the system. This is caused by successive break-ups of the most external liquid bridge of each elongated film. Thus, an elongated liquid film ‘depins’ progressively from each cylinder of the spiral, while the gas-phase ingress continues. This invasion process is described in more detail in the next subsection.
$t>18~\text{s}$
), the elongated films start to recede in the system. This is caused by successive break-ups of the most external liquid bridge of each elongated film. Thus, an elongated liquid film ‘depins’ progressively from each cylinder of the spiral, while the gas-phase ingress continues. This invasion process is described in more detail in the next subsection.
The evaporation rate,
 $E=-\text{d}V/\text{d}t$
, where
$E=-\text{d}V/\text{d}t$
, where
 $V$
is the liquid volume measured by image processing as described earlier, is shown in figure 7. A quasi-constant-evaporation-rate period (CRP) is observed with
$V$
is the liquid volume measured by image processing as described earlier, is shown in figure 7. A quasi-constant-evaporation-rate period (CRP) is observed with
 $E_{CRP}\approx 4.5\times 10^{-3}~\unicode[STIX]{x03BC}\text{l}~\text{s}^{-1}$
, from
$E_{CRP}\approx 4.5\times 10^{-3}~\unicode[STIX]{x03BC}\text{l}~\text{s}^{-1}$
, from
 $t=0$
to
$t=0$
to
 $t=18~\text{s}$
. Once the elongated liquid films start to depin from the outermost cylinders, around
$t=18~\text{s}$
. Once the elongated liquid films start to depin from the outermost cylinders, around
 $t=18~\text{s}$
, a sharp decrease of the evaporation rate is observed. The phenomenology discussed above is observed for all the liquids used. It is similar to that obtained during the drying of capillary porous media and of square cross-section capillary tubes initially filled with a volatile liquid, as discussed in the introduction (§ 1).
$t=18~\text{s}$
, a sharp decrease of the evaporation rate is observed. The phenomenology discussed above is observed for all the liquids used. It is similar to that obtained during the drying of capillary porous media and of square cross-section capillary tubes initially filled with a volatile liquid, as discussed in the introduction (§ 1).

Figure 6. Evaporation of heptane in a
 $50~\unicode[STIX]{x03BC}\text{m}$
thick micromodel: phase distribution at
$50~\unicode[STIX]{x03BC}\text{m}$
thick micromodel: phase distribution at
 $t=0~\text{s}$
(a),
$t=0~\text{s}$
(a),
 $t=18~\text{s}$
(b),
$t=18~\text{s}$
(b),
 $t=62~\text{s}$
(c) and
$t=62~\text{s}$
(c) and
 $t=125~\text{s}$
(d).
$t=125~\text{s}$
(d).

Figure 7. Evaporation of heptane in a
 $50~\unicode[STIX]{x03BC}\text{m}$
thick micromodel: evaporation rate
$50~\unicode[STIX]{x03BC}\text{m}$
thick micromodel: evaporation rate
 $E$
(in
$E$
(in
 $\unicode[STIX]{x03BC}\text{l}~\text{s}^{-1}$
) as a function of time.
$\unicode[STIX]{x03BC}\text{l}~\text{s}^{-1}$
) as a function of time.
3.2 Phase distribution evolution at pore scale: an invasion process
To describe the phase distribution at pore scale, we will describe a given liquid film as a chain of connected liquid bridges, positioned between each pair of neighbouring pillars along a spiral. Then, the space between two spirals will be described as a succession of pores, each pore throat being located in between pairs of neighbouring pillars in adjacent spirals. Each liquid film will be marked out using the number of the most external cylinder wetted by the liquid and connected to the main, central liquid cluster, i.e. using a number between 1 and 23. Similarly, each main meniscus location within the micromodel will be marked out by the number of the pore it occupies. A sketch detailing these conventions is shown in figure 8(a). Note that such a representation allows us to compare readily experiments performed with different liquids, even if the experiment duration changes a lot from one liquid to another, depending on the liquid volatility.
In figure 8(b), the location of the film end (i.e. the location the external tip of the chain of liquid bridges forming the film) is plotted as a function of the main meniscus location for a given ‘pair’ of liquid film and main meniscus, in an experiment performed using heptane as evaporating liquid. For each recorded image, these two locations are determined by image processing. Film and main meniscus locations only take integer values between 1 and 23, see open circles in figure 8(b). The data points corresponding to the beginning of the experiments are in the lower left corner of the graph. As both film end and main meniscus recede towards the micromodel centre with time, they are both marked out by larger and larger numbers.

Figure 8. (a) Sketch showing the way the locations of the main menisci and the liquid films are marked out. As an example, for the three spiral ends seen in this close-up of the micromodel, the liquid film location is at cylinder #2. Two main menisci at location #7 are also highlighted by an arrow. (b) Liquid film end location as a function of the main meniscus location, for a drying experiment performed with heptane. Open circles and dotted line: data for a given liquid film–main meniscus pair. The filled black circle highlighted by an arrow marks out the data point corresponding to the particular situation depicted in (a). Solid line: data averaged over the 28 liquid film–main meniscus pairs of the micromodel. The error bars show the standard deviations of the mean values of liquid film ends and main menisci locations.
It is important to note that both locations evolve in a discontinuous manner. First, the main meniscus ‘jumps’ from one pore entrance to the next. This motion is a simplified version of the so-called Haines jumps observed in more realistic porous media (see e.g. Berg et al.
Reference Berg, Ott, Klapp, Schwing, Neiteler, Brussee, Makurat, Leu, Enzmann and Schwarz2013; Singh et al.
Reference Singh, Scholl, Brinkmann, Di Michiel, Scheel, Herminghaus and Seemann2017b
). As an example, the displacement of a given main meniscus was extracted from a stack of images taken at a high acquisition rate (100 Hz). Figure 9 shows the meniscus curvilinear coordinate along the dotted white line seen on the two insets, as a function of time. It is clearly seen that the invasion proceeds by successive jumps: the main meniscus, positioned at the entrance of a given pore, first slowly penetrates into the pore before a sudden jump occurs and drives the main meniscus to its next position, at the entrance of the next pore. In figure 9, the two insets display the images taken just after a jump (at
 $t=1.23~\text{s}$
) and just before the next one (at
$t=1.23~\text{s}$
) and just before the next one (at
 $t=2.1~\text{s}$
). Second, the location of the film end is controlled by successive break-ups of the most external liquid bridge of the chain of liquid bridges forming the film. As an example, the width of the most external liquid bridge along a film is plotted as a function of time in figure 10: it decreases continuously with time until the break-up suddenly occurs, between
$t=2.1~\text{s}$
). Second, the location of the film end is controlled by successive break-ups of the most external liquid bridge of the chain of liquid bridges forming the film. As an example, the width of the most external liquid bridge along a film is plotted as a function of time in figure 10: it decreases continuously with time until the break-up suddenly occurs, between
 $t=25$
and
$t=25$
and
 $t=26~\text{s}$
. Studying in detail the dynamics of the non-local fluid redistribution within the liquid cluster following a pore invasion or of the liquid bridge break-up is not within the scope of the present study. Such topics have been considered in recent studies, using micromodels (Armstrong & Berg Reference Armstrong and Berg2013) or packing of beads (Singh et al.
Reference Singh, Menke, Andrew, Lin, Rau, Blunt and Bijeljic2017a
).
$t=26~\text{s}$
. Studying in detail the dynamics of the non-local fluid redistribution within the liquid cluster following a pore invasion or of the liquid bridge break-up is not within the scope of the present study. Such topics have been considered in recent studies, using micromodels (Armstrong & Berg Reference Armstrong and Berg2013) or packing of beads (Singh et al.
Reference Singh, Menke, Andrew, Lin, Rau, Blunt and Bijeljic2017a
).

Figure 9. Displacement of a given main meniscus as a function of time. The length
 $D$
is the interface curvilinear coordinate along the white dotted line shown on the insets (the origin
$D$
is the interface curvilinear coordinate along the white dotted line shown on the insets (the origin
 $D=0$
being taken at the cross-marked, left end of the dotted line). The left inset shows the meniscus location just after its jump at the pore entrance at which it is located. The right inset shows the main meniscus location just before its next jump. On the two insets, the circle in white is the circle inscribed between the two pillars that mark the entrance of the pore about to be invaded.
$D=0$
being taken at the cross-marked, left end of the dotted line). The left inset shows the meniscus location just after its jump at the pore entrance at which it is located. The right inset shows the main meniscus location just before its next jump. On the two insets, the circle in white is the circle inscribed between the two pillars that mark the entrance of the pore about to be invaded.
On figure 8(b), the solid line shows the evolution of the liquid film ends as a function of the main menisci locations, averaged over the 28 spirals of the micromodel (so 28 liquid film–main meniscus pairs). A data point is obtained for each recorded image and, due to averaging, non-integer values are obtained, the error bars being taken as the standard deviations of the means. The constant-evaporation-rate period seen in figure 7 corresponds to the period during which the liquid films are connected to the spiral end, i.e. to cylinder #1. As can be seen in figure 6(b), there are some slight differences from one spiral to another, as far as the main meniscus locations are concerned and also regarding the most external cylinders wetted by the liquid. Such slight discrepancies, at a given time, from one liquid film–main meniscus pair to another, can be appreciated owing to the error bars shown in figure 8(b), for a limited set of data points (for the sake of clarity). Note that, while the amplitude of the error bars is roughly constant during a first stage for which the main menisci locations are in the range [6–12], it decreases noticeably as the liquid cluster becomes more confined in the micromodel centre (note the smaller error bars for main menisci location beyond 13). Also, it is important to state that such error bars do not come from the fact that the invasion pattern is slightly out of phase from one spiral to another but really from small differences in the invasion pattern itself, i.e. on the exact succession of main menisci and film tip locations.
3.3 Experimental results for the different liquids used
In figure 11, results using averaged values are shown for the various liquids used in the present study. All the curves display the same typical shape. First, the main menisci recede while the tips of the elongated films remain pinned to the most external cylinder (liquid film location value is then 1). Depinning from the most external cylinder occurs earlier (in terms of main meniscus location) for the most volatile fluids or, equivalently, for the highest capillary numbers (see below). The differences between one liquid and another become less pronounced when the liquid cluster is confined in the centre of the micromodel (typically for main meniscus locations larger than #17 and film locations larger than #7). Note that drying experiments were repeated several times (3–5 times) for each liquid with a very good reproducibility: one can hardly discern any differences from one experiment to another when their results are plotted on the same graph. Therefore, the slight difference seen in figure 11 between heptane and hexane is significant: on average, the first liquid bridge break-up occurs earlier with hexane (dots) than with heptane (crosses) and the liquid films observed with hexane are typically one liquid bridge shorter than with heptane, during most of the experiment duration.

Figure 10. Break-up of a liquid bridge (fluid: heptane). The liquid bridge width
 $w$
, measured along the dotted line shown in the top-left inset, made dimensionless by its initial value
$w$
, measured along the dotted line shown in the top-left inset, made dimensionless by its initial value
 $w_{i}$
, is shown as a function of time. The insets display the liquid bridge as seen on the images. The break-up occurs between
$w_{i}$
, is shown as a function of time. The insets display the liquid bridge as seen on the images. The break-up occurs between
 $t=25$
and
$t=25$
and
 $t=26~\text{s}$
and
$t=26~\text{s}$
and
 $w/w_{i}$
falls to 0. After the break-up, the presence of isolated liquid rings around the external cylinder base and top is demonstrated by the sharp black ring around the cylinder. Such an optical signature of the liquid rings disappears as the liquid contained in the rings evaporates (see image at
$w/w_{i}$
falls to 0. After the break-up, the presence of isolated liquid rings around the external cylinder base and top is demonstrated by the sharp black ring around the cylinder. Such an optical signature of the liquid rings disappears as the liquid contained in the rings evaporates (see image at
 $t=27~\text{s}$
).
$t=27~\text{s}$
).
Figure 11. Drying experiments: averaged location of the liquid film ends as a function of the averaged location of the main menisci, for the various liquids used (see legend for details). The three insets display the phase distribution just before depinning, and thus at maximal film extent, for hexane, octane and decane.
Table 2 recapitulates the results obtained for the several liquids used, regarding the evaporation rate measured during the CRP,
 $E_{CRP}$
, the capillary number
$E_{CRP}$
, the capillary number
 $Ca$
(introduced and discussed in § 4.2), and the liquid film length evolution during drying. Table 2 gives the averaged main meniscus locations when depinning occurs from cylinder #1 and #4, denoted
$Ca$
(introduced and discussed in § 4.2), and the liquid film length evolution during drying. Table 2 gives the averaged main meniscus locations when depinning occurs from cylinder #1 and #4, denoted
 $L_{1}$
and
$L_{1}$
and
 $L_{4}$
respectively. In the next section, the emphasis will be on the understanding of the liquid film dynamics, i.e. on the prediction of the typical curve shape displayed in figure 11, including
$L_{4}$
respectively. In the next section, the emphasis will be on the understanding of the liquid film dynamics, i.e. on the prediction of the typical curve shape displayed in figure 11, including
 $L_{1}$
and
$L_{1}$
and
 $L_{4}$
values. The values of
$L_{4}$
values. The values of
 $E_{CRP}$
are discussed in Chen et al. (Reference Chen, Duru, Joseph, Geoffroy and Prat2017).
$E_{CRP}$
are discussed in Chen et al. (Reference Chen, Duru, Joseph, Geoffroy and Prat2017).
Table 2. Experimental results: evaporation rate during the CRP (
 $E_{CRP}$
), capillary number
$E_{CRP}$
), capillary number
 $Ca$
as defined by (4.5) in § 4.2, mean main meniscus locations at depinning from the most external cylinder (#1),
$Ca$
as defined by (4.5) in § 4.2, mean main meniscus locations at depinning from the most external cylinder (#1),
 $L_{1}$
, and mean main meniscus locations when the films depin from cylinder #4,
$L_{1}$
, and mean main meniscus locations when the films depin from cylinder #4,
 $L_{4}$
. The uncertainty is taken as the standard deviation to the mean obtained when averaging data from several experiments, performed with a given liquid.
$L_{4}$
. The uncertainty is taken as the standard deviation to the mean obtained when averaging data from several experiments, performed with a given liquid.

4 Theoretical modelling
We now turn to the theoretical modelling of the micromodel drying. The goal is to be able to predict, for the different liquids used, the phase distribution evolution during drying, i.e. the succession of liquid bridges break-ups and pore invasions. As seen in § 3.2, the main meniscus ingress takes the form of jumps from one pore to the next one. Invasion occurs when the capillary pressure,
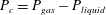 $P_{c}=P_{gas}-P_{liquid}$
, reaches a threshold that is a function of the geometry of the pore considered: this invasion pressure will be denoted
$P_{c}=P_{gas}-P_{liquid}$
, reaches a threshold that is a function of the geometry of the pore considered: this invasion pressure will be denoted
 $P_{inv,i}$
. As the spatial density of the cylinders increases from the edge to the centre of the micromodel, the pores that are successively invaded by the gas become narrower and narrower as evaporation proceeds. Therefore,
$P_{inv,i}$
. As the spatial density of the cylinders increases from the edge to the centre of the micromodel, the pores that are successively invaded by the gas become narrower and narrower as evaporation proceeds. Therefore,
 $P_{inv,i}$
increases as
$P_{inv,i}$
increases as
 $i$
increases. In between two successive pore invasions, when the main meniscus is pinned to a particular pore entrance, the capillary pressure increases slightly as evaporation proceeds, because the meniscus curvature increases until a next Haines jump occurs.
$i$
increases. In between two successive pore invasions, when the main meniscus is pinned to a particular pore entrance, the capillary pressure increases slightly as evaporation proceeds, because the meniscus curvature increases until a next Haines jump occurs.
If one assumes that capillary equilibrium is maintained all over the liquid–gas interface during drying, the pressure in a liquid film along a spiral must then also progressively increase. Consequently, each of the liquid bridges that form the liquid film must get thinner and thinner, which is observed experimentally, see figure 10. Of course, the liquid bridges cannot thin indefinitely and there must exist a critical pressure for which the liquid bridges break up. This critical pressure is expected to become smaller as the spacing between the two pillars of a given liquid bridge becomes larger. That is why break-up occurs at the most external liquid bridge of a film. In the following, we will denote by
 $P_{crit,i}$
the critical pressure for the liquid bridge trapped between cylinders #
$P_{crit,i}$
the critical pressure for the liquid bridge trapped between cylinders #
 $i$
and #
$i$
and #
 $i+1$
.
$i+1$
.
In a purely capillary scenario, starting from a given main meniscus–liquid film configuration, the invasion process will be controlled by the respective values of
 $P_{inv,i}$
and
$P_{inv,i}$
and
 $P_{crit,i}$
. The invasion scenario is more complex if the viscous pressure drop due to the evaporation-induced flow within the liquid films is such that the liquid–gas interface can no longer be considered as being at capillary equilibrium. In this case, any prediction of the invasion pattern requires knowledge of the pressure distribution in the liquid, along the film.
$P_{crit,i}$
. The invasion scenario is more complex if the viscous pressure drop due to the evaporation-induced flow within the liquid films is such that the liquid–gas interface can no longer be considered as being at capillary equilibrium. In this case, any prediction of the invasion pattern requires knowledge of the pressure distribution in the liquid, along the film.
In the remainder of the present section, we first obtain estimates of
 $P_{inv,i}$
and
$P_{inv,i}$
and
 $P_{crit,i}$
, before turning to the computation of the viscous pressure drop along the liquid films. Then, theoretical predictions of the invasion pattern, in a purely capillary case and in viscocapillary cases as well, will be compared to the experimental results. Note that the effect of gravity will be neglected in the following. In fact, the Bond number in our experimental set-up can be defined as
$P_{crit,i}$
, before turning to the computation of the viscous pressure drop along the liquid films. Then, theoretical predictions of the invasion pattern, in a purely capillary case and in viscocapillary cases as well, will be compared to the experimental results. Note that the effect of gravity will be neglected in the following. In fact, the Bond number in our experimental set-up can be defined as
 $\unicode[STIX]{x1D70C}_{l}gh^{2}/\unicode[STIX]{x1D6FE}$
. Taking
$\unicode[STIX]{x1D70C}_{l}gh^{2}/\unicode[STIX]{x1D6FE}$
. Taking
 $\unicode[STIX]{x1D6FE}\approx 20\times 10^{-3}~\text{N}~\text{m}^{-1}$
and
$\unicode[STIX]{x1D6FE}\approx 20\times 10^{-3}~\text{N}~\text{m}^{-1}$
and
 $\unicode[STIX]{x1D70C}_{l}\approx 0.8~\text{g}~\text{cm}^{-3}$
for the liquids used (see table 1), one obtain
$\unicode[STIX]{x1D70C}_{l}\approx 0.8~\text{g}~\text{cm}^{-3}$
for the liquids used (see table 1), one obtain
 $Bo\approx O(10^{-3})$
with
$Bo\approx O(10^{-3})$
with
 $h=50~\unicode[STIX]{x03BC}\text{m}$
. Also, the present modelling is isothermal: we neglect any cooling effect induced by evaporation (which would change the physical properties of the liquid, depending on its position relative to the evaporative front). Such an assumption was made by Chauvet et al. in their study of evaporation in square cross-section capillary tubes. Measurements of the external tube wall temperature by infrared thermography revealed a maximal cooling localized at the tube top, open end not exceeding a few degrees Celsius for hexane, the most volatile liquid used (Chauvet Reference Chauvet2009; Chauvet et al.
Reference Chauvet, Cazin, Duru and Prat2010a
). An isothermal modelling was shown to be in good agreement with the experimental measurement performed (maximal corner film length notably) (see Chauvet et al.
Reference Chauvet, Duru and Prat2010b
). The evaporation rates measured in the present study are of the same order of magnitude,
$h=50~\unicode[STIX]{x03BC}\text{m}$
. Also, the present modelling is isothermal: we neglect any cooling effect induced by evaporation (which would change the physical properties of the liquid, depending on its position relative to the evaporative front). Such an assumption was made by Chauvet et al. in their study of evaporation in square cross-section capillary tubes. Measurements of the external tube wall temperature by infrared thermography revealed a maximal cooling localized at the tube top, open end not exceeding a few degrees Celsius for hexane, the most volatile liquid used (Chauvet Reference Chauvet2009; Chauvet et al.
Reference Chauvet, Cazin, Duru and Prat2010a
). An isothermal modelling was shown to be in good agreement with the experimental measurement performed (maximal corner film length notably) (see Chauvet et al.
Reference Chauvet, Duru and Prat2010b
). The evaporation rates measured in the present study are of the same order of magnitude,
 $O(10^{-9}~\text{kg}~\text{s}^{-1})$
, as those reported by Chauvet et al. and the characteristic size of the micromodel,
$O(10^{-9}~\text{kg}~\text{s}^{-1})$
, as those reported by Chauvet et al. and the characteristic size of the micromodel,
 $O$
(mm), is similar to that of the tip of the capillary tubes used by Chauvet et al. Also, the micromodel glass bottom plate has a high thermal conductivity. For these reasons, we expect the isothermal assumption to be correct in the present geometry.
$O$
(mm), is similar to that of the tip of the capillary tubes used by Chauvet et al. Also, the micromodel glass bottom plate has a high thermal conductivity. For these reasons, we expect the isothermal assumption to be correct in the present geometry.
4.1 Critical capillary pressure of a liquid bridge and pore invasion pressure
A key point of the above scenario is that there is a critical capillary pressure (or equivalently critical curvature) above which a liquid bridge cannot be sustained in between two neighbouring cylinders. This point was studied using the software Surface Evolver (SE), by simulating the shape of single liquid bridges trapped between two cylinders, confined between two horizontal plates. Such liquid bridges can be considered as the building block of the elongated liquid films that are observed along each spiral in the experiment. Typically, for a given spacing between the two cylinders, a converged liquid bridge shape was computed as a function of the liquid volume. The equilibrium capillary pressure and relevant geometrical parameters describing the liquid bridge were obtained for each volume step. We assume that the liquid bridge break-up occurs when its thickness
 $t$
at the location
$t$
at the location
 $(x=0,y=w_{/\!/}/2,z=h/2)$
, see figure 4, tends to zero (simulations are typically stopped when
$(x=0,y=w_{/\!/}/2,z=h/2)$
, see figure 4, tends to zero (simulations are typically stopped when
 $t/2d_{c}=0.01$
). The critical pressure for a liquid bridge is then that obtained in SE ‘just before’ the two liquid–gas interfaces collapse. Figure 12 shows the evolution of the dimensionless critical pressure,
$t/2d_{c}=0.01$
). The critical pressure for a liquid bridge is then that obtained in SE ‘just before’ the two liquid–gas interfaces collapse. Figure 12 shows the evolution of the dimensionless critical pressure,
 $2d_{c}\times P_{crit}/\unicode[STIX]{x1D6FE}$
, obtained in SE for a zero contact angle, as a function of the dimensionless spacing between the two cylinders,
$2d_{c}\times P_{crit}/\unicode[STIX]{x1D6FE}$
, obtained in SE for a zero contact angle, as a function of the dimensionless spacing between the two cylinders,
 $w_{/\!/}/2d_{c}$
. As expected, the critical pressure increases when
$w_{/\!/}/2d_{c}$
. As expected, the critical pressure increases when
 $w_{/\!/}$
decreases. Results for different contact angles and details in the use of SE are given in Chen (Reference Chen2016).
$w_{/\!/}$
decreases. Results for different contact angles and details in the use of SE are given in Chen (Reference Chen2016).

Figure 12. Critical capillary pressure for liquid bridge break-up. The capillary pressure
 $P_{gas}-P_{liquid}$
is made dimensionless by dividing by
$P_{gas}-P_{liquid}$
is made dimensionless by dividing by
 $\unicode[STIX]{x1D6FE}/2d_{c}$
and is plotted as a function of the dimensionless centre-to-centre distance between the two cylinders,
$\unicode[STIX]{x1D6FE}/2d_{c}$
and is plotted as a function of the dimensionless centre-to-centre distance between the two cylinders,
 $w_{/\!/}/2d_{c}$
. The contact angle of the liquid on the cylinders and on the top and bottom plates is zero.
$w_{/\!/}/2d_{c}$
. The contact angle of the liquid on the cylinders and on the top and bottom plates is zero.
In the experiment, the elongated liquid films observed consist of chains of connected liquid bridges and break-up occurs systematically for the most external liquid bridge. To check if the critical capillary pressure obtained for an isolated liquid bridge is a fair approximation of the critical pressure at play in the experiment, some SE simulations were also ran along a chain of cylinders with varying distances between the cylinders, corresponding to those imposed by the microfabrication design. Capillary shapes of elongated films were obtained for successive, decreasing liquid volumes until the liquid bridge break-up occurs in between the two most distant cylinders. The critical pressure found when considering a chain of
 $N$
cylinders (i.e.
$N$
cylinders (i.e.
 $N-1$
liquid bridges), made dimensionless by its value for
$N-1$
liquid bridges), made dimensionless by its value for
 $N=2$
, was found to vary by less than 1 %, whatever
$N=2$
, was found to vary by less than 1 %, whatever
 $N$
is, compared to the reference case (
$N$
is, compared to the reference case (
 $N=2$
).
$N=2$
).
Another key element of the basic invasion mechanism outlined above is the knowledge of the capillary pressure to be reached to invade a given pore,
 $P_{inv,i}$
. As seen in figure 10, the liquid–gas interface just before invasion of pore #
$P_{inv,i}$
. As seen in figure 10, the liquid–gas interface just before invasion of pore #
 $i$
closely matches the circle inscribed in between the two pillars highlighted in red, i.e. the opening of the pore about to be invaded. Such an observation was repeated over several invasion events. Consequently, the invasion capillary pressure for a given pore #
$i$
closely matches the circle inscribed in between the two pillars highlighted in red, i.e. the opening of the pore about to be invaded. Such an observation was repeated over several invasion events. Consequently, the invasion capillary pressure for a given pore #
 $i$
is estimated as
$i$
is estimated as
 $$\begin{eqnarray}P_{inv,i}=\unicode[STIX]{x1D6FE}\left(\frac{2}{D_{i}}+\frac{2}{h}\right),\end{eqnarray}$$
where
 $2/D_{i}$
is the curvature of the interface in the observation plane with
$2/D_{i}$
is the curvature of the interface in the observation plane with
 $D_{i}=w_{\bot ,i}-d_{c}$
,
$D_{i}=w_{\bot ,i}-d_{c}$
,
 $h$
is the micromodel thickness and the liquid is perfectly wetting (zero contact angle). Note that
$h$
is the micromodel thickness and the liquid is perfectly wetting (zero contact angle). Note that
 $D_{i}$
is a function of the pore considered and decreases as one penetrates further into the micromodel.
$D_{i}$
is a function of the pore considered and decreases as one penetrates further into the micromodel.
4.2 Viscous pressure drop within the liquid films
To estimate the viscous pressure drop due to the evaporation-induced flow within the liquid films, we again regard the liquid film as a succession of connected liquid bridges. A pressure drop
 $\unicode[STIX]{x0394}P_{\unicode[STIX]{x1D707},i}$
is defined for each liquid bridge
$\unicode[STIX]{x0394}P_{\unicode[STIX]{x1D707},i}$
is defined for each liquid bridge
 $i$
(located between cylinders
$i$
(located between cylinders
 $i$
and
$i$
and
 $i+1$
) as the flow-induced pressure difference between the liquid bridge inlet and outlet, located in planes
$i+1$
) as the flow-induced pressure difference between the liquid bridge inlet and outlet, located in planes
 $y=0$
and
$y=0$
and
 $y=w_{i}$
respectively, see figure 4. The invasion algorithm in a viscocapillary case, described in the next subsection, will require an estimate of the pressure in the middle of each liquid bridge
$y=w_{i}$
respectively, see figure 4. The invasion algorithm in a viscocapillary case, described in the next subsection, will require an estimate of the pressure in the middle of each liquid bridge
 $i$
, for a given position
$i$
, for a given position
 $j$
of the main meniscus:
$j$
of the main meniscus:
 $$\begin{eqnarray}P_{lb,i}=P_{inv,j}-\left(\frac{\unicode[STIX]{x0394}P_{\unicode[STIX]{x1D707},i}}{2}+\mathop{\sum }_{k=i+1}^{k=j-1}\unicode[STIX]{x0394}P_{\unicode[STIX]{x1D707},k}\right).\end{eqnarray}$$
To calculate
 $\unicode[STIX]{x0394}P_{\unicode[STIX]{x1D707},i}$
, we follow the classical analysis of Ransohoff & Radke (Reference Ransohoff and Radke1988) for corner flows, which relates the pressure drop to the flow rate in the liquid film by a Poiseuille-like law:
$\unicode[STIX]{x0394}P_{\unicode[STIX]{x1D707},i}$
, we follow the classical analysis of Ransohoff & Radke (Reference Ransohoff and Radke1988) for corner flows, which relates the pressure drop to the flow rate in the liquid film by a Poiseuille-like law:
 $$\begin{eqnarray}\unicode[STIX]{x0394}P_{\unicode[STIX]{x1D707},i}=\frac{\unicode[STIX]{x1D6FD}}{R_{in,i}^{2}}\unicode[STIX]{x1D707}_{f}w_{/\!/,i}\frac{q_{i}}{A_{in,i}}.\end{eqnarray}$$
In this expression,
 $q_{i}$
is the liquid flow rate in the liquid bridge,
$q_{i}$
is the liquid flow rate in the liquid bridge,
 $A_{in,i}$
is the liquid bridge total cross-section area in the
$A_{in,i}$
is the liquid bridge total cross-section area in the
 $y=0$
plane and
$y=0$
plane and
 $\unicode[STIX]{x1D6FD}$
is a dimensionless flow resistance, which is a function of the liquid bridge shape, the contact angle and the boundary condition at the liquid–air interface. In the
$\unicode[STIX]{x1D6FD}$
is a dimensionless flow resistance, which is a function of the liquid bridge shape, the contact angle and the boundary condition at the liquid–air interface. In the
 $y=0$
plane, the liquid bridge consists of four identical liquid corners/wedges, confined between the horizontal plates and the cylinder wall, with a radius of curvature
$y=0$
plane, the liquid bridge consists of four identical liquid corners/wedges, confined between the horizontal plates and the cylinder wall, with a radius of curvature
 $R_{in,i}$
in the plane
$R_{in,i}$
in the plane
 $y=0$
.
$y=0$
.
Use of (4.3) requires the knowledge of the liquid bridge shape (
 $A_{in}$
and
$A_{in}$
and
 $R_{in}$
), of the viscous resistance
$R_{in}$
), of the viscous resistance
 $\unicode[STIX]{x1D6FD}$
, and of the liquid flow rate within the liquid bridge. An extensive set of SE simulations of liquid bridges was first performed, giving
$\unicode[STIX]{x1D6FD}$
, and of the liquid flow rate within the liquid bridge. An extensive set of SE simulations of liquid bridges was first performed, giving
 $A_{in}$
and
$A_{in}$
and
 $R_{in}$
as a function of the capillary pressure and
$R_{in}$
as a function of the capillary pressure and
 $w_{/\!/}$
. The viscous resistance
$w_{/\!/}$
. The viscous resistance
 $\unicode[STIX]{x1D6FD}$
was then obtained from direct numerical simulations (DNS) of the flow within the simulated liquid bridges (the detailed procedure and validation tests are presented in appendix A).
$\unicode[STIX]{x1D6FD}$
was then obtained from direct numerical simulations (DNS) of the flow within the simulated liquid bridges (the detailed procedure and validation tests are presented in appendix A).
Therefore, in the present modelling, the viscous flow-induced pressure drop within each liquid bridge is computed using a liquid bridge shape obtained at capillary equilibrium (i.e. with no flow). As the capillary number is small in the present experiments, deviations from the capillary shape should be small and the present local equilibrium assumption is expected to be relevant. Note that avoiding such an assumption would require one to simulate the flow within the film together with the film shape, using a volume-of-fluids (VOF) or a level-set method, for instance. However, such numerical techniques remain numerically challenging and computationally demanding in the case of low-capillary-number flows, e.g. due to spurious effects such as parasitic currents (Horgue et al. Reference Horgue, Augier, Quintard and Prat2012; Raeini, Blunt & Bijeljic Reference Raeini, Blunt and Bijeljic2012). Use of DNS techniques allowing interface tracking in the present film flow problem is then well beyond the scope of the present paper.
As far as the flow rate within the liquid bridge is concerned, we assume that the pore space remains saturated with vapour during the micromodel drying, due to confinement effects. Such an assumption has been validated by simulations of the stationary vapour concentration field in the pore space (see Chen Reference Chen2016). As a result, evaporation occurs at the tip of the liquid films only, i.e. around the last cylinder connected to the liquid film, and the flow rate
 $q$
is constant along a liquid film. We also assume that the evaporation rate is evenly distributed around the 28 spirals of the system so that
$q$
is constant along a liquid film. We also assume that the evaporation rate is evenly distributed around the 28 spirals of the system so that
 $q=E/28$
. The evaporation rate
$q=E/28$
. The evaporation rate
 $E$
is measured experimentally, as explained earlier, and its evolution during a drying experiment can be formulated as a function of the location of the liquid film tips:
$E$
is measured experimentally, as explained earlier, and its evolution during a drying experiment can be formulated as a function of the location of the liquid film tips:
 $E=E_{\text{CRP}}\times f_{i}$
, where
$E=E_{\text{CRP}}\times f_{i}$
, where
 $i$
is the film tip location (i.e. the number of the most external cylinder wetted by the liquid films, averaged over the 28 liquid films). The function
$i$
is the film tip location (i.e. the number of the most external cylinder wetted by the liquid films, averaged over the 28 liquid films). The function
 $f_{i}$
is such that
$f_{i}$
is such that
 $f_{1}=1$
and can be obtained experimentally. It is well fitted by an fifth-order polynomial and does not depend on the liquid used.
$f_{1}=1$
and can be obtained experimentally. It is well fitted by an fifth-order polynomial and does not depend on the liquid used.
Finally, (4.3) can be manipulated to introduce the relevant, dimensionless capillary number. To that end, we introduce
 $R_{0}$
, a typical order of magnitude for
$R_{0}$
, a typical order of magnitude for
 $R_{in}$
, such that
$R_{in}$
, such that
 $R_{in}/R_{0}\approx O(1)$
for all the liquid bridge geometries relevant in the present study. Then,
$R_{in}/R_{0}\approx O(1)$
for all the liquid bridge geometries relevant in the present study. Then,
 $$\begin{eqnarray}\frac{\unicode[STIX]{x0394}P_{\unicode[STIX]{x1D707}}}{\unicode[STIX]{x1D6FE}}=\frac{\unicode[STIX]{x1D707}}{\unicode[STIX]{x1D6FE}}\frac{\unicode[STIX]{x1D6FD}E_{CRP}fw_{/\!/}}{28\times A_{in}\times R_{in}^{2}}=\frac{\unicode[STIX]{x1D707}}{\unicode[STIX]{x1D6FE}}\frac{E_{CRP}}{28\times R_{0}^{2}}\times \frac{\unicode[STIX]{x1D6FD}fw_{/\!/}R_{0}^{2}}{A_{in}R_{in}^{2}}=Ca\unicode[STIX]{x1D6FD}\frac{fw_{/\!/}R_{0}^{2}}{A_{in}R_{in}^{2}},\end{eqnarray}$$
where the capillary number
 $Ca$
is defined as
$Ca$
is defined as
 $$\begin{eqnarray}Ca=\frac{\unicode[STIX]{x1D707}}{\unicode[STIX]{x1D6FE}}\frac{E_{CRP}}{28R_{0}^{2}}\end{eqnarray}$$
and can be calculated taking
 $R_{0}=10~\unicode[STIX]{x03BC}\text{m}$
, see table 2. Note that a Reynolds number for the liquid flow within the liquid films can be defined as
$R_{0}=10~\unicode[STIX]{x03BC}\text{m}$
, see table 2. Note that a Reynolds number for the liquid flow within the liquid films can be defined as
 $Re=\unicode[STIX]{x1D70C}_{f}uR_{0}/\unicode[STIX]{x1D707}_{f}$
, with
$Re=\unicode[STIX]{x1D70C}_{f}uR_{0}/\unicode[STIX]{x1D707}_{f}$
, with
 $u\approx E_{CRP}/(28R_{0}^{2})$
. Such a Reynolds number is in the range
$u\approx E_{CRP}/(28R_{0}^{2})$
. Such a Reynolds number is in the range
 $O(10^{-3}){-}O(0.1)$
in the experiments.
$O(10^{-3}){-}O(0.1)$
in the experiments.
4.3 Invasion algorithms and comparison between theoretical predictions and experimental results
Once
 $P_{inv}$
and
$P_{inv}$
and
 $P_{crit}$
are estimated, the expected invasion pattern in the capillary case,
$P_{crit}$
are estimated, the expected invasion pattern in the capillary case,
 $Ca=0$
, is obtained straightforwardly. For given locations
$Ca=0$
, is obtained straightforwardly. For given locations
 $(i,j)$
of the liquid film tip and main meniscus, respectively (initialization is at
$(i,j)$
of the liquid film tip and main meniscus, respectively (initialization is at
 $i=1$
,
$i=1$
,
 $j=2$
), one compares
$j=2$
), one compares
 $P_{inv,j}$
and
$P_{inv,j}$
and
 $P_{crit,i}$
. If
$P_{crit,i}$
. If
 $P_{inv,j}<P_{crit,i}$
,
$P_{inv,j}<P_{crit,i}$
,
 $j\rightarrow j+1$
, otherwise break-up occurs and
$j\rightarrow j+1$
, otherwise break-up occurs and
 $i\rightarrow i+1$
. When the capillary number is non-zero, one first needs to compute the liquid pressure distribution along the liquid film. Then, the pressure in the middle of the most external liquid bridge is compared to
$i\rightarrow i+1$
. When the capillary number is non-zero, one first needs to compute the liquid pressure distribution along the liquid film. Then, the pressure in the middle of the most external liquid bridge is compared to
 $P_{crit}$
. More precisely, the viscocapillary algorithm is the following.
$P_{crit}$
. More precisely, the viscocapillary algorithm is the following.
(i) The pressure at the liquid bridge
 $j-1$
,
$P_{lb,j-1}$
, is initialized at
$P_{inv,j}$
. The radius of curvature
$R_{in,j-1}$
is obtained by extrapolating from the set of SE simulation data, giving
$R_{in,j-1}$
as a function of
$P_{lb,j-1}$
. The dimensionless evaporation rate is set to
$f_{\#j}$
. The pressure drop
$\unicode[STIX]{x0394}P_{\unicode[STIX]{x1D707},j-1}$
is then computed using (4.3).
$j-1$
,
$P_{lb,j-1}$
, is initialized at
$P_{inv,j}$
. The radius of curvature
$R_{in,j-1}$
is obtained by extrapolating from the set of SE simulation data, giving
$R_{in,j-1}$
as a function of
$P_{lb,j-1}$
. The dimensionless evaporation rate is set to
$f_{\#j}$
. The pressure drop
$\unicode[STIX]{x0394}P_{\unicode[STIX]{x1D707},j-1}$
is then computed using (4.3).(ii) The pressure at the liquid bridge is then set to
$P_{inv,j}-\unicode[STIX]{x0394}P_{\unicode[STIX]{x1D707},j-1}/2$
. This new pressure involves a new liquid bridge shape and so an updated radius of curvature
$R_{in,j-1}$
is obtained to compute a new
$\unicode[STIX]{x0394}P_{\unicode[STIX]{x1D707},j-1}$
. A few iterations are needed for this procedure to converge to stable values for
$\unicode[STIX]{x0394}P_{\unicode[STIX]{x1D707},j-1}$
and
$P_{lb,j-1}$
. Then, liquid bridge
$j-2$
is considered:
$P_{lb,j-2}$
is initialized at
$P_{inv,j}-\unicode[STIX]{x0394}P_{\unicode[STIX]{x1D707},j-1}$
and the above procedure is repeated until convergence for
$\unicode[STIX]{x0394}P_{\unicode[STIX]{x1D707},j-2}$
and
$P_{lb,j-2}$
.(iii) Once the pressure drops have been obtained for all the liquid bridges, the pressure
$P_{lb,i}$
computed from (4.2) is compared to
$P_{crit,i}$
. If smaller, the main meniscus recedes,
$j\rightarrow j+1$
. Otherwise, break-up occurs. In this case, the film length is set to be one liquid bridge shorter,
$i\rightarrow i+1$
. In both cases, the full algorithm is repeated from step (i) above, to identify the next step of the invasion process (pore invasion or liquid bridge break-up), and so on.


The prediction of the capillary model (
 $Ca=0$
) is shown as open circles in figure 13 together with results obtained taking into account viscous effects, for
$Ca=0$
) is shown as open circles in figure 13 together with results obtained taking into account viscous effects, for
 $Ca=10^{-5}$
,
$Ca=10^{-5}$
,
 $3.18\times 10^{-5}$
and
$3.18\times 10^{-5}$
and
 $2\times 10^{-4}$
, shown as squares, diamonds and crosses, respectively, in figure 13. For sufficiently ‘large’ capillary numbers, typically
$2\times 10^{-4}$
, shown as squares, diamonds and crosses, respectively, in figure 13. For sufficiently ‘large’ capillary numbers, typically
 $Ca>10^{-6}$
, deviations from the capillary curve are found. The trend observed as capillary numbers increase is the same as in the experiments, see figure 11. When the capillary number is large,
$Ca>10^{-6}$
, deviations from the capillary curve are found. The trend observed as capillary numbers increase is the same as in the experiments, see figure 11. When the capillary number is large,
 $Ca>3\times 10^{-4}$
, no films are formed during the early invasion process. From initialization at
$Ca>3\times 10^{-4}$
, no films are formed during the early invasion process. From initialization at
 $i=1$
and
$i=1$
and
 $j=2$
, the system directly jumps to
$j=2$
, the system directly jumps to
 $i=2$
and
$i=2$
and
 $j=3$
as the single liquid bridge between cylinders #1 and #2 cannot be sustained. However, the evolution does not follow the dotted line shown in figure 13, which shows the result obtained from the invasion algorithm when elongated films never develop. When the evaporation rate has decreased sufficiently, the viscous effects decrease and elongated films consisting of several connected liquid bridges can be found (as soon as the main meniscus has receded to location #6 for the
$j=3$
as the single liquid bridge between cylinders #1 and #2 cannot be sustained. However, the evolution does not follow the dotted line shown in figure 13, which shows the result obtained from the invasion algorithm when elongated films never develop. When the evaporation rate has decreased sufficiently, the viscous effects decrease and elongated films consisting of several connected liquid bridges can be found (as soon as the main meniscus has receded to location #6 for the
 $Ca=2\times 10^{-4}$
case shown in figure 13). Note, however, that such a case was not observed in the present experiments. It could probably be observed for highly volatile liquids, for which the present isothermal modelling may be inappropriate.
$Ca=2\times 10^{-4}$
case shown in figure 13). Note, however, that such a case was not observed in the present experiments. It could probably be observed for highly volatile liquids, for which the present isothermal modelling may be inappropriate.

Figure 13. Theoretical predictions regarding the liquid film end location as a function of the main meniscus location for four different capillary numbers (see legend for details). The solid line is the result obtained for drying experiment performed with heptane at
 $Ca=3.18\times 10^{-5}$
, see table 2 and figure 8(b). The straight dotted line shows the result obtained from the invasion algorithm when no films can develop, i.e. for ‘large’ capillary numbers.
$Ca=3.18\times 10^{-5}$
, see table 2 and figure 8(b). The straight dotted line shows the result obtained from the invasion algorithm when no films can develop, i.e. for ‘large’ capillary numbers.
A qualitative agreement between experiment and theory is shown in figure 13 for the particular case of drying with heptane, for which
 $Ca=3.18\times 10^{-5}$
. This remains true when considering the other liquids used in the present study (data not shown in figure 13 for the sake of clarity) and this can be appreciated in figure 14, where the main meniscus locations when depinning occurs from cylinders #1 and #4, denoted
$Ca=3.18\times 10^{-5}$
. This remains true when considering the other liquids used in the present study (data not shown in figure 13 for the sake of clarity) and this can be appreciated in figure 14, where the main meniscus locations when depinning occurs from cylinders #1 and #4, denoted
 $L_{1}$
and
$L_{1}$
and
 $L_{4}$
, respectively, are plotted as a function of the capillary number
$L_{4}$
, respectively, are plotted as a function of the capillary number
 $Ca$
. The theoretical prediction (squares and circles) converges to the purely capillary case as soon as
$Ca$
. The theoretical prediction (squares and circles) converges to the purely capillary case as soon as
 $Ca<8\times 10^{-7}$
. The transition to a viscocapillary regime occurs in the range
$Ca<8\times 10^{-7}$
. The transition to a viscocapillary regime occurs in the range
 $Ca=10^{-6}-10^{-4}$
and is quite sharp. For
$Ca=10^{-6}-10^{-4}$
and is quite sharp. For
 $Ca>10^{-4}$
, the first liquid bridge cannot be sustained, as discussed above. Experimental data from table 2 are shown as crosses (
$Ca>10^{-4}$
, the first liquid bridge cannot be sustained, as discussed above. Experimental data from table 2 are shown as crosses (
 $L_{1}$
) and dots (
$L_{1}$
) and dots (
 $L_{4}$
). Despite some discrepancies, the trend from the theoretical prediction is reproduced and the agreement between modelling and experiment is quite satisfactory, given the various approximations made in the modelling, notably the local capillary equilibrium assumption.
$L_{4}$
). Despite some discrepancies, the trend from the theoretical prediction is reproduced and the agreement between modelling and experiment is quite satisfactory, given the various approximations made in the modelling, notably the local capillary equilibrium assumption.

Figure 14. Film length, expressed in number of connected liquid bridges, as a function of the capillary number
 $Ca$
when depinning from cylinders #1 and #4 occurs,
$Ca$
when depinning from cylinders #1 and #4 occurs,
 $L_{1}$
and
$L_{1}$
and
 $L_{4}$
. Circles, respectively squares: theoretical prediction for depinning from cylinder #1, respectively #4. Crosses, respectively dots: experimental results for
$L_{4}$
. Circles, respectively squares: theoretical prediction for depinning from cylinder #1, respectively #4. Crosses, respectively dots: experimental results for
 $L_{1}$
, respectively
$L_{1}$
, respectively
 $L_{4}$
(see table 2).
$L_{4}$
(see table 2).
5 Conclusion
The main goal of the present study was to investigate the drying dynamics in a model system displaying liquid films with a complex shape. The spatial pattern of the cylinders used in the present study allows one to obtain funicular liquid films, i.e. liquid films connecting several cylinders, that can span a large region of the micromodel during the drying process. These liquid films are topologically more complex than the elongated films found in polygonal cross-section capillary tubes. However, their impact on the drying kinetics is the same: by providing hydraulic connectivity between the central liquid cluster and the micromodel periphery, they are responsible for the constant-evaporation-rate period. Predicting the maximal extent of the films along the spirals is therefore a key point, which requires the modelling of liquid transport within the films.
The modelling is based on the straightforward idea of decomposing the films into elementary units, here liquid bridges connecting two neighbouring cylinders. At this local scale, and assuming a local capillary equilibrium, i.e. provided that capillary numbers are small, bridge shape and liquid flow with the capillary bridge can be studied numerically, providing data essential for writing down an invasion algorithm (critical pressure for liquid bridge break-up, pore invasion pressure and resistance to flow within a liquid bridge). Such a modelling is found to be in qualitative agreement with the experiments, as far as the drying dynamics, i.e. the invasion pattern and extent of films, is concerned. An important effect taken into account is the fact that the viscous effects modify the pressure distribution along the films, leading to a decrease of the film length compared to a purely capillary case. Thus, the present study provides a conceptual framework to deal with viscocapillary drying regimes, at low capillary numbers.
With the general idea of fully understanding and quantifying the impact of liquid films on the drying of porous media, an obvious next step would be to turn to 3D liquid film clusters found in the packing of beads. In such clusters, the films have also been shown to be classified into several units (dimer, trimer, etc.) – see Scheel et al. (Reference Scheel, Seemann, Brinkmann, Di Michiel, Sheppard, Breidenbach and Herminghaus2008a ,Reference Scheel, Seemann, Brinkmann, Di Michiel, Sheppard and Herminghaus b ). Also, Cejas et al. (Reference Cejas, Hough, Frétigny and Dreyfus2016) recently reported some experiments on the drying of a single column of spherical beads, in a capillary–gravity regime. Using Surface Evolver simulations, they related the experimentally observed drying kinetics to the topology of the film network, which displays a transition between a funicular and a pendular regime (without long-range connectivity) depending on the arrangement of the beads. However, the extension of a ‘direct’ approach, such as that used in the present study, to a real 3D film network remains elusive due to the complex connectivity of such networks. A more fruitful approach may lie in a fine topological analysis of such film networks, in order to localize the regions that control the viscous dissipation and then the pressure evolution within the film (in a viscous regime).
Finally, let us note that if the knowledge gained by the present study has applications in drying and other porous-media problems involving transport within liquid films, it also may have an interest for microfluidic applications, where control of evaporation is a major issue (see e.g. Clément & Leng Reference Clément and Leng2004). The present study shows that such a control may be achieved by finely tuning the microsystem design in order to favour, or not, the transport of a liquid by films (see Chen et al. Reference Chen, Duru, Joseph, Geoffroy and Prat2017).
Appendix. Direct numerical simulation of Stokes flow within liquid films
In this appendix, we detail the numerical techniques used to compute the flow within a liquid bridge and obtain the viscous resistance
 $\unicode[STIX]{x1D6FD}$
defined in § 4.2. The liquid is supposed to be isothermal, incompressible and Newtonian. Gravity is neglected and the flow Reynolds number is smaller than 1, see § 4.2. Therefore, the equations of motion reduce to Stokes equations.
$\unicode[STIX]{x1D6FD}$
defined in § 4.2. The liquid is supposed to be isothermal, incompressible and Newtonian. Gravity is neglected and the flow Reynolds number is smaller than 1, see § 4.2. Therefore, the equations of motion reduce to Stokes equations.
The full numerical procedure, from Surface Evolver (SE) simulations to get the liquid–vapour interface shape to DNS of the Stokes flow, was first validated by computing
 $\unicode[STIX]{x1D6FD}$
for the flow in a right-angled straight wedge, a case first studied by Ransohoff & Radke (Reference Ransohoff and Radke1988). The interface shape is computed using SE for different contact angles between the liquid and the (
$\unicode[STIX]{x1D6FD}$
for the flow in a right-angled straight wedge, a case first studied by Ransohoff & Radke (Reference Ransohoff and Radke1988). The interface shape is computed using SE for different contact angles between the liquid and the (
 $y{-}z$
) and (
$y{-}z$
) and (
 $x{-}y$
) planes; see a typical example in figure 15(a). The interface shape obtained from SE is saved as an IGES file that is imported into the finite-element-based commercial software Comsol Multiphysics. Comsol uses free tetrahedral elements to mesh a liquid domain of length
$x{-}y$
) planes; see a typical example in figure 15(a). The interface shape obtained from SE is saved as an IGES file that is imported into the finite-element-based commercial software Comsol Multiphysics. Comsol uses free tetrahedral elements to mesh a liquid domain of length
 $L$
along the
$L$
along the
 $y$
-axis and delimited by the interface and the (
$y$
-axis and delimited by the interface and the (
 $y{-}z$
) and (
$y{-}z$
) and (
 $x{-}y$
) planes. A no-slip boundary condition is implemented on the two contact planes between the liquid and the wedge. Two different boundary conditions can be used at the liquid–gas interface, namely a no-stress boundary condition or a no-slip boundary condition. Finally, a pressure difference
$x{-}y$
) planes. A no-slip boundary condition is implemented on the two contact planes between the liquid and the wedge. Two different boundary conditions can be used at the liquid–gas interface, namely a no-stress boundary condition or a no-slip boundary condition. Finally, a pressure difference
 $\unicode[STIX]{x0394}P$
is imposed between the inlet and the outlet planes, separated by a distance
$\unicode[STIX]{x0394}P$
is imposed between the inlet and the outlet planes, separated by a distance
 $L$
along the
$L$
along the
 $y$
-axis, see figure 15(a). The Stokes flow is then solved numerically and the dimensionless viscous resistance is obtained as
$y$
-axis, see figure 15(a). The Stokes flow is then solved numerically and the dimensionless viscous resistance is obtained as
 $$\begin{eqnarray}\unicode[STIX]{x1D6FD}=\frac{-R_{in}^{2}}{\unicode[STIX]{x1D707}_{f}\langle \boldsymbol{u}\rangle }\times \frac{\unicode[STIX]{x0394}P}{L},\end{eqnarray}$$
where
 $\langle \boldsymbol{u}\rangle$
is obtained by dividing the total liquid flow rate computed by Comsol by the liquid film cross-sectional area and
$\langle \boldsymbol{u}\rangle$
is obtained by dividing the total liquid flow rate computed by Comsol by the liquid film cross-sectional area and
 $R_{in}$
is the interface radius of curvature in the
$R_{in}$
is the interface radius of curvature in the
 $x{-}z$
plane (see figure 15
a). Numerical results for
$x{-}z$
plane (see figure 15
a). Numerical results for
 $\unicode[STIX]{x1D6FD}$
converge as soon as the mesh surface density used in the SE simulations is large enough. Simulations were run for different contact angle between the liquid and the wedge walls, considering either the no-slip or no-stress boundary conditions. For all the cases investigated, the results of Ransohoff & Radke (Reference Ransohoff and Radke1988) regarding
$\unicode[STIX]{x1D6FD}$
converge as soon as the mesh surface density used in the SE simulations is large enough. Simulations were run for different contact angle between the liquid and the wedge walls, considering either the no-slip or no-stress boundary conditions. For all the cases investigated, the results of Ransohoff & Radke (Reference Ransohoff and Radke1988) regarding
 $\unicode[STIX]{x1D6FD}$
are recovered within less than 1 %.
$\unicode[STIX]{x1D6FD}$
are recovered within less than 1 %.

Figure 15. (a) Typical liquid–gas interface in a right-angled straight wedge computed using Surface Evolver. Here the contact angle
 $\unicode[STIX]{x1D703}$
is
$\unicode[STIX]{x1D703}$
is
 $10^{\circ }$
. (b) DNS computational domain obtained from a typical liquid bridge shape (see figure 4). (c) Typical computed pressure field in a liquid bridge from Comsol, with a no-stress boundary condition on the interface. Isobars on the liquid–gas interface are shown as coloured lines.
$10^{\circ }$
. (b) DNS computational domain obtained from a typical liquid bridge shape (see figure 4). (c) Typical computed pressure field in a liquid bridge from Comsol, with a no-stress boundary condition on the interface. Isobars on the liquid–gas interface are shown as coloured lines.
We now turn to the case of liquid bridges. A typical converged liquid bridge shape has been shown in figure 4. The unit cell used for the DNS consists of the liquid bridge part that is in the half-space
 $x>0$
, confined between the
$x>0$
, confined between the
 $y=0$
and
$y=0$
and
 $y=w_{/\!/}$
planes on the one hand and between the
$y=w_{/\!/}$
planes on the one hand and between the
 $z=0$
and
$z=0$
and
 $z=h/2$
planes on the other, leading to the computational domain shown in figure 15(b). A no-slip boundary condition is implemented on the liquid–cylinders and liquid–bottom plate interfaces, together with the symmetry at the plane
$z=h/2$
planes on the other, leading to the computational domain shown in figure 15(b). A no-slip boundary condition is implemented on the liquid–cylinders and liquid–bottom plate interfaces, together with the symmetry at the plane
 $z=h/2$
. Similarly to the straight-wedge case, a pressure difference is imposed between the inlet and outlet liquid bridge cross-sections. Computations are run considering a no-stress boundary condition on the liquid–vapour interface. The viscous resistance to the flow is obtained using (A 1), where the pressure gradient driving the flow is now defined as
$z=h/2$
. Similarly to the straight-wedge case, a pressure difference is imposed between the inlet and outlet liquid bridge cross-sections. Computations are run considering a no-stress boundary condition on the liquid–vapour interface. The viscous resistance to the flow is obtained using (A 1), where the pressure gradient driving the flow is now defined as
 $\unicode[STIX]{x0394}P_{l}/w_{/\!/}$
. In (A 1),
$\unicode[STIX]{x0394}P_{l}/w_{/\!/}$
. In (A 1),
 $R_{in}$
is now the interface radius of curvature in the (
$R_{in}$
is now the interface radius of curvature in the (
 $x{-}z$
) plane, at the inlet of the computational domain, see figure 15(b). It is determined by fitting the interface profile with a circle. The velocity
$x{-}z$
) plane, at the inlet of the computational domain, see figure 15(b). It is determined by fitting the interface profile with a circle. The velocity
 $\langle \boldsymbol{u}\rangle$
is computed in the inlet plane. Numerical results for
$\langle \boldsymbol{u}\rangle$
is computed in the inlet plane. Numerical results for
 $\unicode[STIX]{x1D6FD}$
converge for a SE surface mesh density larger than that found to be necessary for convergence in the straight-wedge case. Also, they were found to be slightly sensitive to the volume-mesh refinement scheme used in Comsol. Finally, we estimate the uncertainty on the values of
$\unicode[STIX]{x1D6FD}$
converge for a SE surface mesh density larger than that found to be necessary for convergence in the straight-wedge case. Also, they were found to be slightly sensitive to the volume-mesh refinement scheme used in Comsol. Finally, we estimate the uncertainty on the values of
 $\unicode[STIX]{x1D6FD}$
obtained to be of the order of 2 %–3 %.
$\unicode[STIX]{x1D6FD}$
obtained to be of the order of 2 %–3 %.
Figure 15(c) displays a typical result regarding the pressure field in the liquid bridge. As can be seen, pressure gradients are concentrated close to the liquid bridge inlet and outlet, i.e. in the corner film confined between the cylinder and the flat bottom plane. The pressure gradient is significantly weaker in the central region of the liquid bridge. Figure 16 shows the evolution of
 $\unicode[STIX]{x1D6FD}$
, as a function of
$\unicode[STIX]{x1D6FD}$
, as a function of
 $R_{in}/w_{/\!/}$
, for various spacing
$R_{in}/w_{/\!/}$
, for various spacing
 $w_{/\!/}$
between the cylinders and a fixed contact angle (
$w_{/\!/}$
between the cylinders and a fixed contact angle (
 $\unicode[STIX]{x1D703}=0^{\circ }$
). The trend depicted in figure 16 is consistent with the liquid bridge shape variation with its volume. A liquid bridge is more ‘tortuous’ for smaller liquid volumes, which is consistent with the increase of the flow resistance with decreasing
$\unicode[STIX]{x1D703}=0^{\circ }$
). The trend depicted in figure 16 is consistent with the liquid bridge shape variation with its volume. A liquid bridge is more ‘tortuous’ for smaller liquid volumes, which is consistent with the increase of the flow resistance with decreasing
 $R_{in}$
, as smaller volumes mean smaller
$R_{in}$
, as smaller volumes mean smaller
 $R_{in}$
values. More results for
$R_{in}$
values. More results for
 $\unicode[STIX]{x1D6FD}$
, notably for various liquid–solid contact angles, are given in Chen (Reference Chen2016).
$\unicode[STIX]{x1D6FD}$
, notably for various liquid–solid contact angles, are given in Chen (Reference Chen2016).

Figure 16. Liquid bridge flow resistance
 $\unicode[STIX]{x1D6FD}$
as a function of
$\unicode[STIX]{x1D6FD}$
as a function of
 $R_{in}/w_{/\!/}$
for four different spacings between the two cylinders; see legend for details. These numerical results were obtained with a no-viscous-stress boundary condition at the liquid–gas interface and for a
$R_{in}/w_{/\!/}$
for four different spacings between the two cylinders; see legend for details. These numerical results were obtained with a no-viscous-stress boundary condition at the liquid–gas interface and for a
 $0^{\circ }$
contact angle.
$0^{\circ }$
contact angle.


