1 Introduction
SBLI unsteadiness is relevant for engine intake design. Despite this, off-centre unsteadiness has been largely neglected in experiments, and the majority of simulations employ spanwise-periodic boundary conditions (Garnier Reference Garnier2009; Pasquariello, Hickel & Adams Reference Pasquariello, Hickel and Adams2017). In particular, researchers are interested in the structurally fatiguing low-frequency reflected shock motion which occurs at Strouhal numbers around
![]() $St=fL_{sep}/U_{\infty }=0.03$
(Dupont, Haddad & Debiève Reference Dupont, Haddad and Debiève2006). While much research has been conducted to further our understanding of two-dimensional SBLI unsteadiness, three-dimensional studies have been highlighted as an important area for future research (Dussauge, Dupont & Debiève Reference Dussauge, Dupont and Debiève2006; Clemens & Narayanaswamy Reference Clemens and Narayanaswamy2014). In particular, it is not fully understood how the dynamic behaviour of the corner separations that exist in real geometries relates to phenomena observed at the centreline.
$St=fL_{sep}/U_{\infty }=0.03$
(Dupont, Haddad & Debiève Reference Dupont, Haddad and Debiève2006). While much research has been conducted to further our understanding of two-dimensional SBLI unsteadiness, three-dimensional studies have been highlighted as an important area for future research (Dussauge, Dupont & Debiève Reference Dussauge, Dupont and Debiève2006; Clemens & Narayanaswamy Reference Clemens and Narayanaswamy2014). In particular, it is not fully understood how the dynamic behaviour of the corner separations that exist in real geometries relates to phenomena observed at the centreline.
It has been established that corner separations affect the mean characteristics of the central separation. Bruce et al. (Reference Bruce, Burton, Titchener and Babinsky2011) showed that corner separations influence the extent of the main separation region of normal SBLIs; this was expanded upon by Babinsky, Oorebeek & Cottingham (Reference Babinsky, Oorebeek and Cottingham2013) who proposed that interactions can be classified as ‘quasi-two-dimensional’ or with increased or decreased separation based on the viscous aspect ratio
![]() $\unicode[STIX]{x1D6FF}/w$
of the configuration (where
$\unicode[STIX]{x1D6FF}/w$
of the configuration (where
![]() $\unicode[STIX]{x1D6FF}$
is the incoming boundary layer height and
$\unicode[STIX]{x1D6FF}$
is the incoming boundary layer height and
![]() $w$
is the working section width). However, the exact relationship between the two is complex; Benek, Suchyta & Babinsky (Reference Benek, Suchyta and Babinsky2014, Reference Benek, Suchyta and Babinsky2016) and Poggie & Porter (Reference Poggie and Porter2018) conducted LES of test cases with varying viscous aspect ratios without successfully finding a flow parameter which collapsed the trends for the observed variation in separation across test cases with different shock strengths and incoming Mach numbers.
$w$
is the working section width). However, the exact relationship between the two is complex; Benek, Suchyta & Babinsky (Reference Benek, Suchyta and Babinsky2014, Reference Benek, Suchyta and Babinsky2016) and Poggie & Porter (Reference Poggie and Porter2018) conducted LES of test cases with varying viscous aspect ratios without successfully finding a flow parameter which collapsed the trends for the observed variation in separation across test cases with different shock strengths and incoming Mach numbers.
Wang et al. (Reference Wang, Sandham, Hu and Liu2015) subsequently proposed that the two-dimensionality of oblique SBLIs depends on the conical growth from the shock generator leading edge of the swept fin interactions between the shock generator, incident shock and sidewall boundary layers. These interactions affect the main SBLI by distorting the incident shock. This further shows that interactions are strongly influenced by the sidewalls, as well as the height of the domain.
There has been previous speculation on links between corner and central separation region unsteadiness. An early suggestion of a relation arose from the particle image velocimetry (PIV) measurements on an oblique SBLI summarised by Dupont et al. (Reference Dupont, Haddad, Ardissone and Debiève2005) and Dussauge et al. (Reference Dussauge, Dupont and Debiève2006). The PIV in the
![]() $x{-}z$
plane parallel to the wall revealed the presence of two counter-rotating ‘tornado’ vortices behind the separation shock extending to
$x{-}z$
plane parallel to the wall revealed the presence of two counter-rotating ‘tornado’ vortices behind the separation shock extending to
![]() $y\sim 0.5\unicode[STIX]{x1D6FF}$
. From the velocity gradients in the
$y\sim 0.5\unicode[STIX]{x1D6FF}$
. From the velocity gradients in the
![]() $x{-}z$
plane, they estimated that the angular frequency of the vortices was of the same order as the low-frequency shock unsteadiness. They concluded that further work was required to determine what effect the sidewalls and wind tunnel aspect ratios have on this phenomenon. Oil flow visualisations by Babinsky et al. (Reference Babinsky, Oorebeek and Cottingham2013) revealed that the foci of such vortices move inwards when blockage is placed in the corners and those of Grossman & Bruce (Reference Grossman and Bruce2018) show the same tendency for increasing duct aspect ratio
$x{-}z$
plane, they estimated that the angular frequency of the vortices was of the same order as the low-frequency shock unsteadiness. They concluded that further work was required to determine what effect the sidewalls and wind tunnel aspect ratios have on this phenomenon. Oil flow visualisations by Babinsky et al. (Reference Babinsky, Oorebeek and Cottingham2013) revealed that the foci of such vortices move inwards when blockage is placed in the corners and those of Grossman & Bruce (Reference Grossman and Bruce2018) show the same tendency for increasing duct aspect ratio
![]() $\def\AR{A\mkern-8muR}\AR =w/h$
, where
$\def\AR{A\mkern-8muR}\AR =w/h$
, where
![]() $h$
is the height of the leading edge of the shock generator from the tunnel floor.
$h$
is the height of the leading edge of the shock generator from the tunnel floor.
This link was then investigated by Garnier (Reference Garnier2009) in an SBLI simulation with sidewalls. Garnier (Reference Garnier2009) investigated the correlation between the reflected shock motion and the corner flows and central flow counter-rotating vortices, but found no link; however, due to the short signal time of the simulation, motions with frequencies lower than 200 Hz could not be investigated. Historically, investigation of low-frequency dynamics via numerical simulations is lacking due to the challenges of obtaining a sufficiently long run time (Pasquariello et al. Reference Pasquariello, Hickel and Adams2017), which are increased further by the inclusion of sidewalls. Experiments have an advantage in this sense if longer run times are available; however, it is difficult to obtain high-resolution spatial data over a sizeable extent.
Funderburk & Narayanaswamy (Reference Funderburk and Narayanaswamy2016) experimentally investigated this link by taking pressure measurements under the central and corner separations of a compression ramp SBLI. Noting the differences in the cross-coherences of the power spectra under the most energetic locations at the centre and corner with locations upstream and downstream of them, they concluded that the separations behave independently of each other. However, they were not able to simultaneously measure the pressure in the two regions due to the constraints of the experimental arrangement.
Therefore, by utilising both LES and experimental data, the purpose of this paper is two-fold: to map the unsteadiness across the span of oblique SBLIs and to evaluate the influence of off-centre unsteadiness on the well-documented, low-frequency motions at the spanwise centre. Data are taken from two independent studies with similar interaction strengths, but with different Mach numbers and aspect ratios. Our interest is in the extent to which low-frequency phenomena are similar.
2 Methodology
2.1 Numerical approach – ‘Test case 1’
The numerical dataset is taken from the full-span LES of a
![]() $9^{\circ }$
oblique SBLI at Mach 2.7 and
$9^{\circ }$
oblique SBLI at Mach 2.7 and
![]() $\def\AR{A\mkern-8muR}\AR =2$
(
$\def\AR{A\mkern-8muR}\AR =2$
(
![]() $\unicode[STIX]{x1D6FF}/w=0.069$
) by Wang et al. (Reference Wang, Sandham, Hu and Liu2015). Previous LES (Wang et al.
Reference Wang, Sandham, Hu and Liu2015) showed that the corner and its neighbouring attached flow region are not significantly changed by aspect ratios in the range 1–4. This configuration generates an expected inviscid incident shock strength of
$\unicode[STIX]{x1D6FF}/w=0.069$
) by Wang et al. (Reference Wang, Sandham, Hu and Liu2015). Previous LES (Wang et al.
Reference Wang, Sandham, Hu and Liu2015) showed that the corner and its neighbouring attached flow region are not significantly changed by aspect ratios in the range 1–4. This configuration generates an expected inviscid incident shock strength of
![]() $p_{2}/p_{1}=1.82$
. The Reynolds number based on the boundary layer compressible momentum thickness at the shock impingement location was
$p_{2}/p_{1}=1.82$
. The Reynolds number based on the boundary layer compressible momentum thickness at the shock impingement location was
![]() $Re_{\unicode[STIX]{x1D703}}=4300$
and the boundary layer compressible displacement thickness was
$Re_{\unicode[STIX]{x1D703}}=4300$
and the boundary layer compressible displacement thickness was
![]() $\unicode[STIX]{x1D6FF}^{\ast }=2.3~\text{mm}$
. The simulated domain was the entire channel, including the shock generator and both sidewalls, as shown in figure 1. The streamwise
$\unicode[STIX]{x1D6FF}^{\ast }=2.3~\text{mm}$
. The simulated domain was the entire channel, including the shock generator and both sidewalls, as shown in figure 1. The streamwise
![]() $\times$
wall normal
$\times$
wall normal
![]() $\times$
spanwise resolution of the grid was
$\times$
spanwise resolution of the grid was
![]() $480\times 416\times 758$
. Full details including a description of the grid sensitivity study are provided in Wang et al. (Reference Wang, Sandham, Hu and Liu2015).
$480\times 416\times 758$
. Full details including a description of the grid sensitivity study are provided in Wang et al. (Reference Wang, Sandham, Hu and Liu2015).
In the present work, the WH2 (
![]() $\def\AR{A\mkern-8muR}\AR=2$
) simulation of Wang et al. (Reference Wang, Sandham, Hu and Liu2015) was continued for approximately 23 periods of the expected low-frequency motion based on
$\def\AR{A\mkern-8muR}\AR=2$
) simulation of Wang et al. (Reference Wang, Sandham, Hu and Liu2015) was continued for approximately 23 periods of the expected low-frequency motion based on
![]() $St=0.03$
(
$St=0.03$
(
![]() $f_{0}=629~\text{Hz}$
,
$f_{0}=629~\text{Hz}$
,
![]() $T_{0}=1.59~\text{ms}$
), following a transient time of approximately 4 periods. The pressure history on the bottom wall (see figure 1) was sampled every 20 simulation time steps, from which the power spectral densities (PSDs) of the signals were then computed using Welch’s method with a 50 % overlap. The PSDs were reconstructed with 2 segments at the lowest frequency and 32 at the high frequencies.
$T_{0}=1.59~\text{ms}$
), following a transient time of approximately 4 periods. The pressure history on the bottom wall (see figure 1) was sampled every 20 simulation time steps, from which the power spectral densities (PSDs) of the signals were then computed using Welch’s method with a 50 % overlap. The PSDs were reconstructed with 2 segments at the lowest frequency and 32 at the high frequencies.
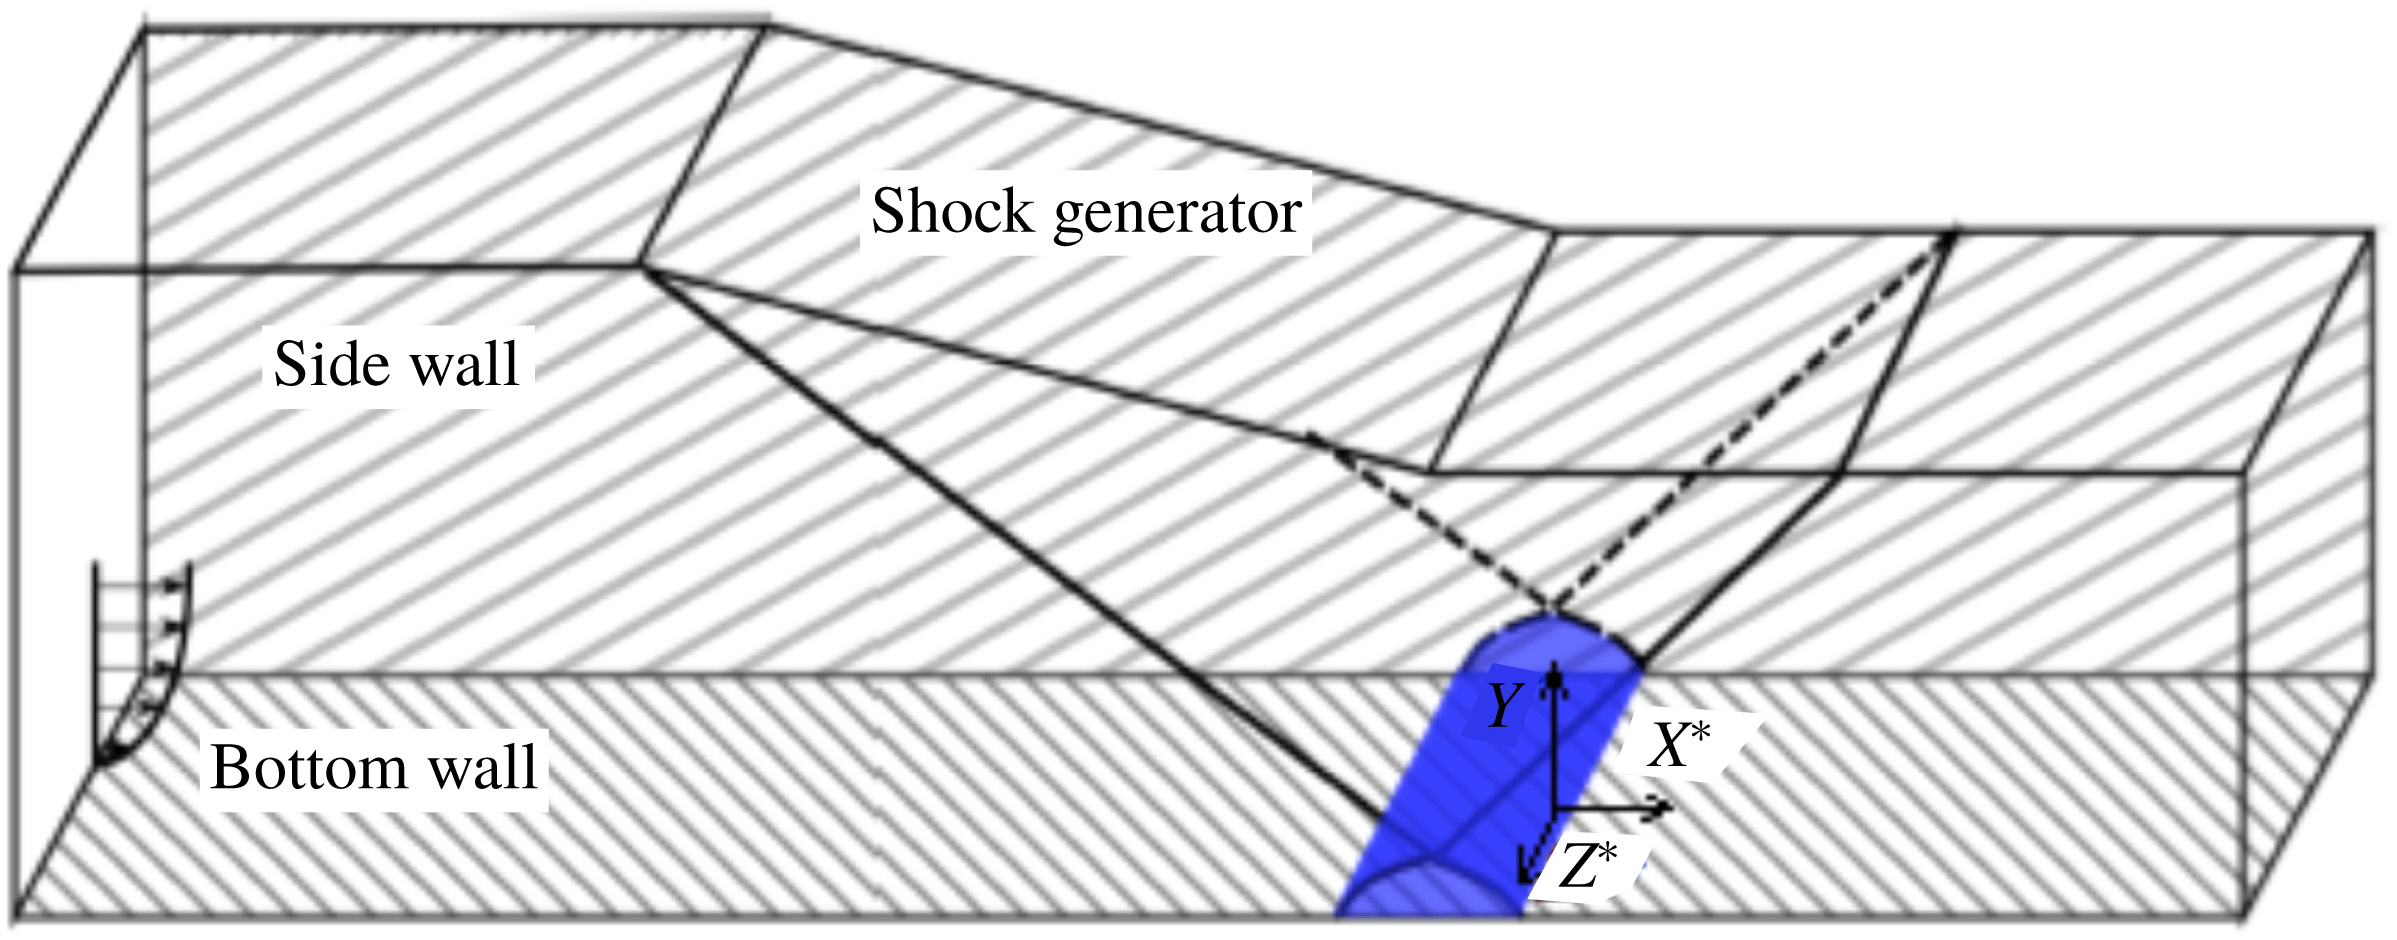
Figure 1. Schematic diagram of numerical domain.
2.2 Experimental set-up – ‘Test case 2’
Experiments were conducted in the Imperial College supersonic wind tunnel to study the oblique SBLI formed by a
![]() $12^{\circ }$
wedge in a Mach 2 free stream at
$12^{\circ }$
wedge in a Mach 2 free stream at
![]() $\def\AR{A\mkern-8muR}\AR=1$
(
$\def\AR{A\mkern-8muR}\AR=1$
(
![]() $\unicode[STIX]{x1D6FF}/w=0.036$
). The inviscid pressure rise across this incident shock is expected to be
$\unicode[STIX]{x1D6FF}/w=0.036$
). The inviscid pressure rise across this incident shock is expected to be
![]() $p_{2}/p_{1}=1.88$
and the upstream boundary layer had
$p_{2}/p_{1}=1.88$
and the upstream boundary layer had
![]() $Re_{\unicode[STIX]{x1D703}}\approx 10\,000$
and
$Re_{\unicode[STIX]{x1D703}}\approx 10\,000$
and
![]() $\unicode[STIX]{x1D6FF}^{\ast }\approx 1.2~\text{mm}$
. Further details can be found in Grossman & Bruce (Reference Grossman and Bruce2018).
$\unicode[STIX]{x1D6FF}^{\ast }\approx 1.2~\text{mm}$
. Further details can be found in Grossman & Bruce (Reference Grossman and Bruce2018).
The surface oil flow visualisation technique described in Grossman & Bruce (Reference Grossman and Bruce2018) was employed to characterise the separation region at the floor. The pressure history on the floor was recorded using high-frequency response Kulite standard version miniature pressure transducers XCQ-093-15PSIA, all
![]() $2.4~\text{mm}$
in diameter. Channels were sampled at 1 MHz for 14 s during the steady state of the tunnel operation, equivalent to
$2.4~\text{mm}$
in diameter. Channels were sampled at 1 MHz for 14 s during the steady state of the tunnel operation, equivalent to
![]() $6300T_{0}$
, where
$6300T_{0}$
, where
![]() $T_{0}=2.22~\text{ms}$
(
$T_{0}=2.22~\text{ms}$
(
![]() $f_{0}=450~\text{Hz}$
) is one expected low-frequency period based on
$f_{0}=450~\text{Hz}$
) is one expected low-frequency period based on
![]() $St=0.03$
. Although not shown for brevity, convergence was confirmed, as the same trends were found using one tenth of the available time series (still 630 low-frequency cycles).
$St=0.03$
. Although not shown for brevity, convergence was confirmed, as the same trends were found using one tenth of the available time series (still 630 low-frequency cycles).
The signals were obtained over a
![]() $10\times 40$
streamwise-by-spanwise grid covering the central 94 % of the working section width
$10\times 40$
streamwise-by-spanwise grid covering the central 94 % of the working section width
![]() $w=150~\text{mm}$
with resolution
$w=150~\text{mm}$
with resolution
![]() $1.36~\text{mm}\times 3.6~\text{mm}$
or
$1.36~\text{mm}\times 3.6~\text{mm}$
or
![]() $0.04L_{sep}\times 0.02w$
, where
$0.04L_{sep}\times 0.02w$
, where
![]() $L_{sep}$
is the centreline separation length. The PSDs were then computed using Welch’s method with 1700 windows of length 16.4 ms with 50 % overlap, giving a frequency resolution of 61 Hz or
$L_{sep}$
is the centreline separation length. The PSDs were then computed using Welch’s method with 1700 windows of length 16.4 ms with 50 % overlap, giving a frequency resolution of 61 Hz or
![]() $St=0.004$
.
$St=0.004$
.

Figure 2. (a) Photograph and (b) CAD model showing experimental set-up.
Ten sensors were mounted in a floor plug at the same streamwise position with a spanwise centre-to-centre spacing of 3.6 mm (as shown in figure 2). The floor plug could be placed at four locations across the working section span. A streamwise resolution of 1.4 mm was achieved by shifting the shock generator up and down with two streamwise plug locations. The shock generator was traversed vertically in increments of 1.21 mm in order to effectively shift the interactions by
![]() $\pm 1.36~\text{mm}$
in the streamwise direction. In shifting the shock generator by such small vertical increments, the aspect ratio was always within
$\pm 1.36~\text{mm}$
in the streamwise direction. In shifting the shock generator by such small vertical increments, the aspect ratio was always within
![]() $\def\AR{A\mkern-8muR}\AR=1.02\pm 0.017$
, which caused minimal change in the confinement and in the boundary layer thickness at the shock impingement.
$\def\AR{A\mkern-8muR}\AR=1.02\pm 0.017$
, which caused minimal change in the confinement and in the boundary layer thickness at the shock impingement.
2.3
 $St=0.03$
For the remainder of the paper the distribution in power contained in
![]() $St=0.03$
will be considered. The choice in using
$St=0.03$
will be considered. The choice in using
![]() $St=0.03$
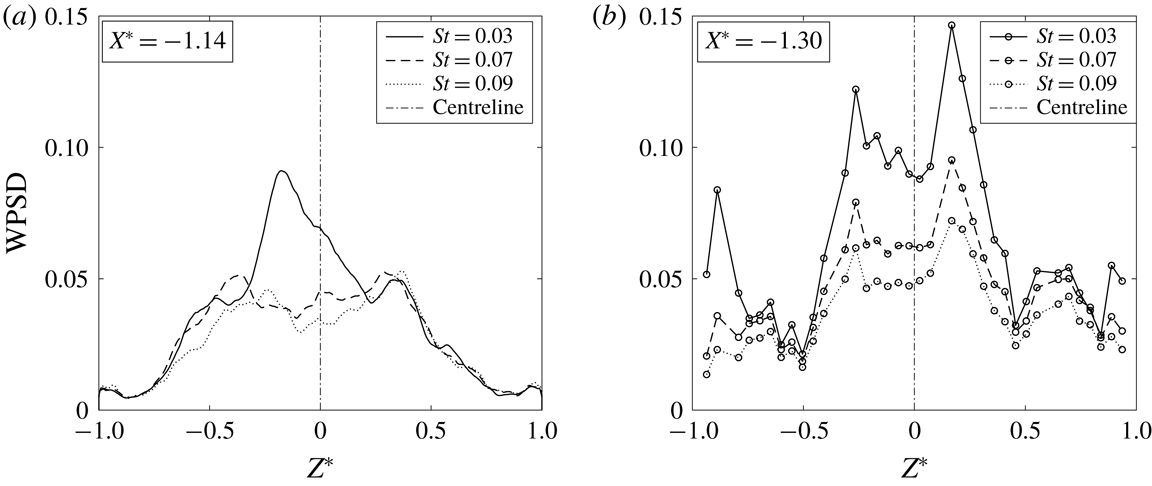
based on the centreline separation length is mostly due to historical convention in that this frequency is expected to be characteristic of the unsteadiness of a separated SBLI. However, it was also found that this was a good representation of the variation in energy contained in low frequencies across the span of the interactions – and choices of other Strouhal numbers yielded similar trends. Example PSDs across the span of an interaction are shown in figure 3, from which it can be seen that the power at
$St=0.03$
based on the centreline separation length is mostly due to historical convention in that this frequency is expected to be characteristic of the unsteadiness of a separated SBLI. However, it was also found that this was a good representation of the variation in energy contained in low frequencies across the span of the interactions – and choices of other Strouhal numbers yielded similar trends. Example PSDs across the span of an interaction are shown in figure 3, from which it can be seen that the power at
![]() $St=0.03$
captures the variation in low-frequency energy content at each location.
$St=0.03$
captures the variation in low-frequency energy content at each location.

Figure 3. Example PSDs along
![]() $X^{\ast }=-1.30$
for test case 2.
$X^{\ast }=-1.30$
for test case 2.
3 Results
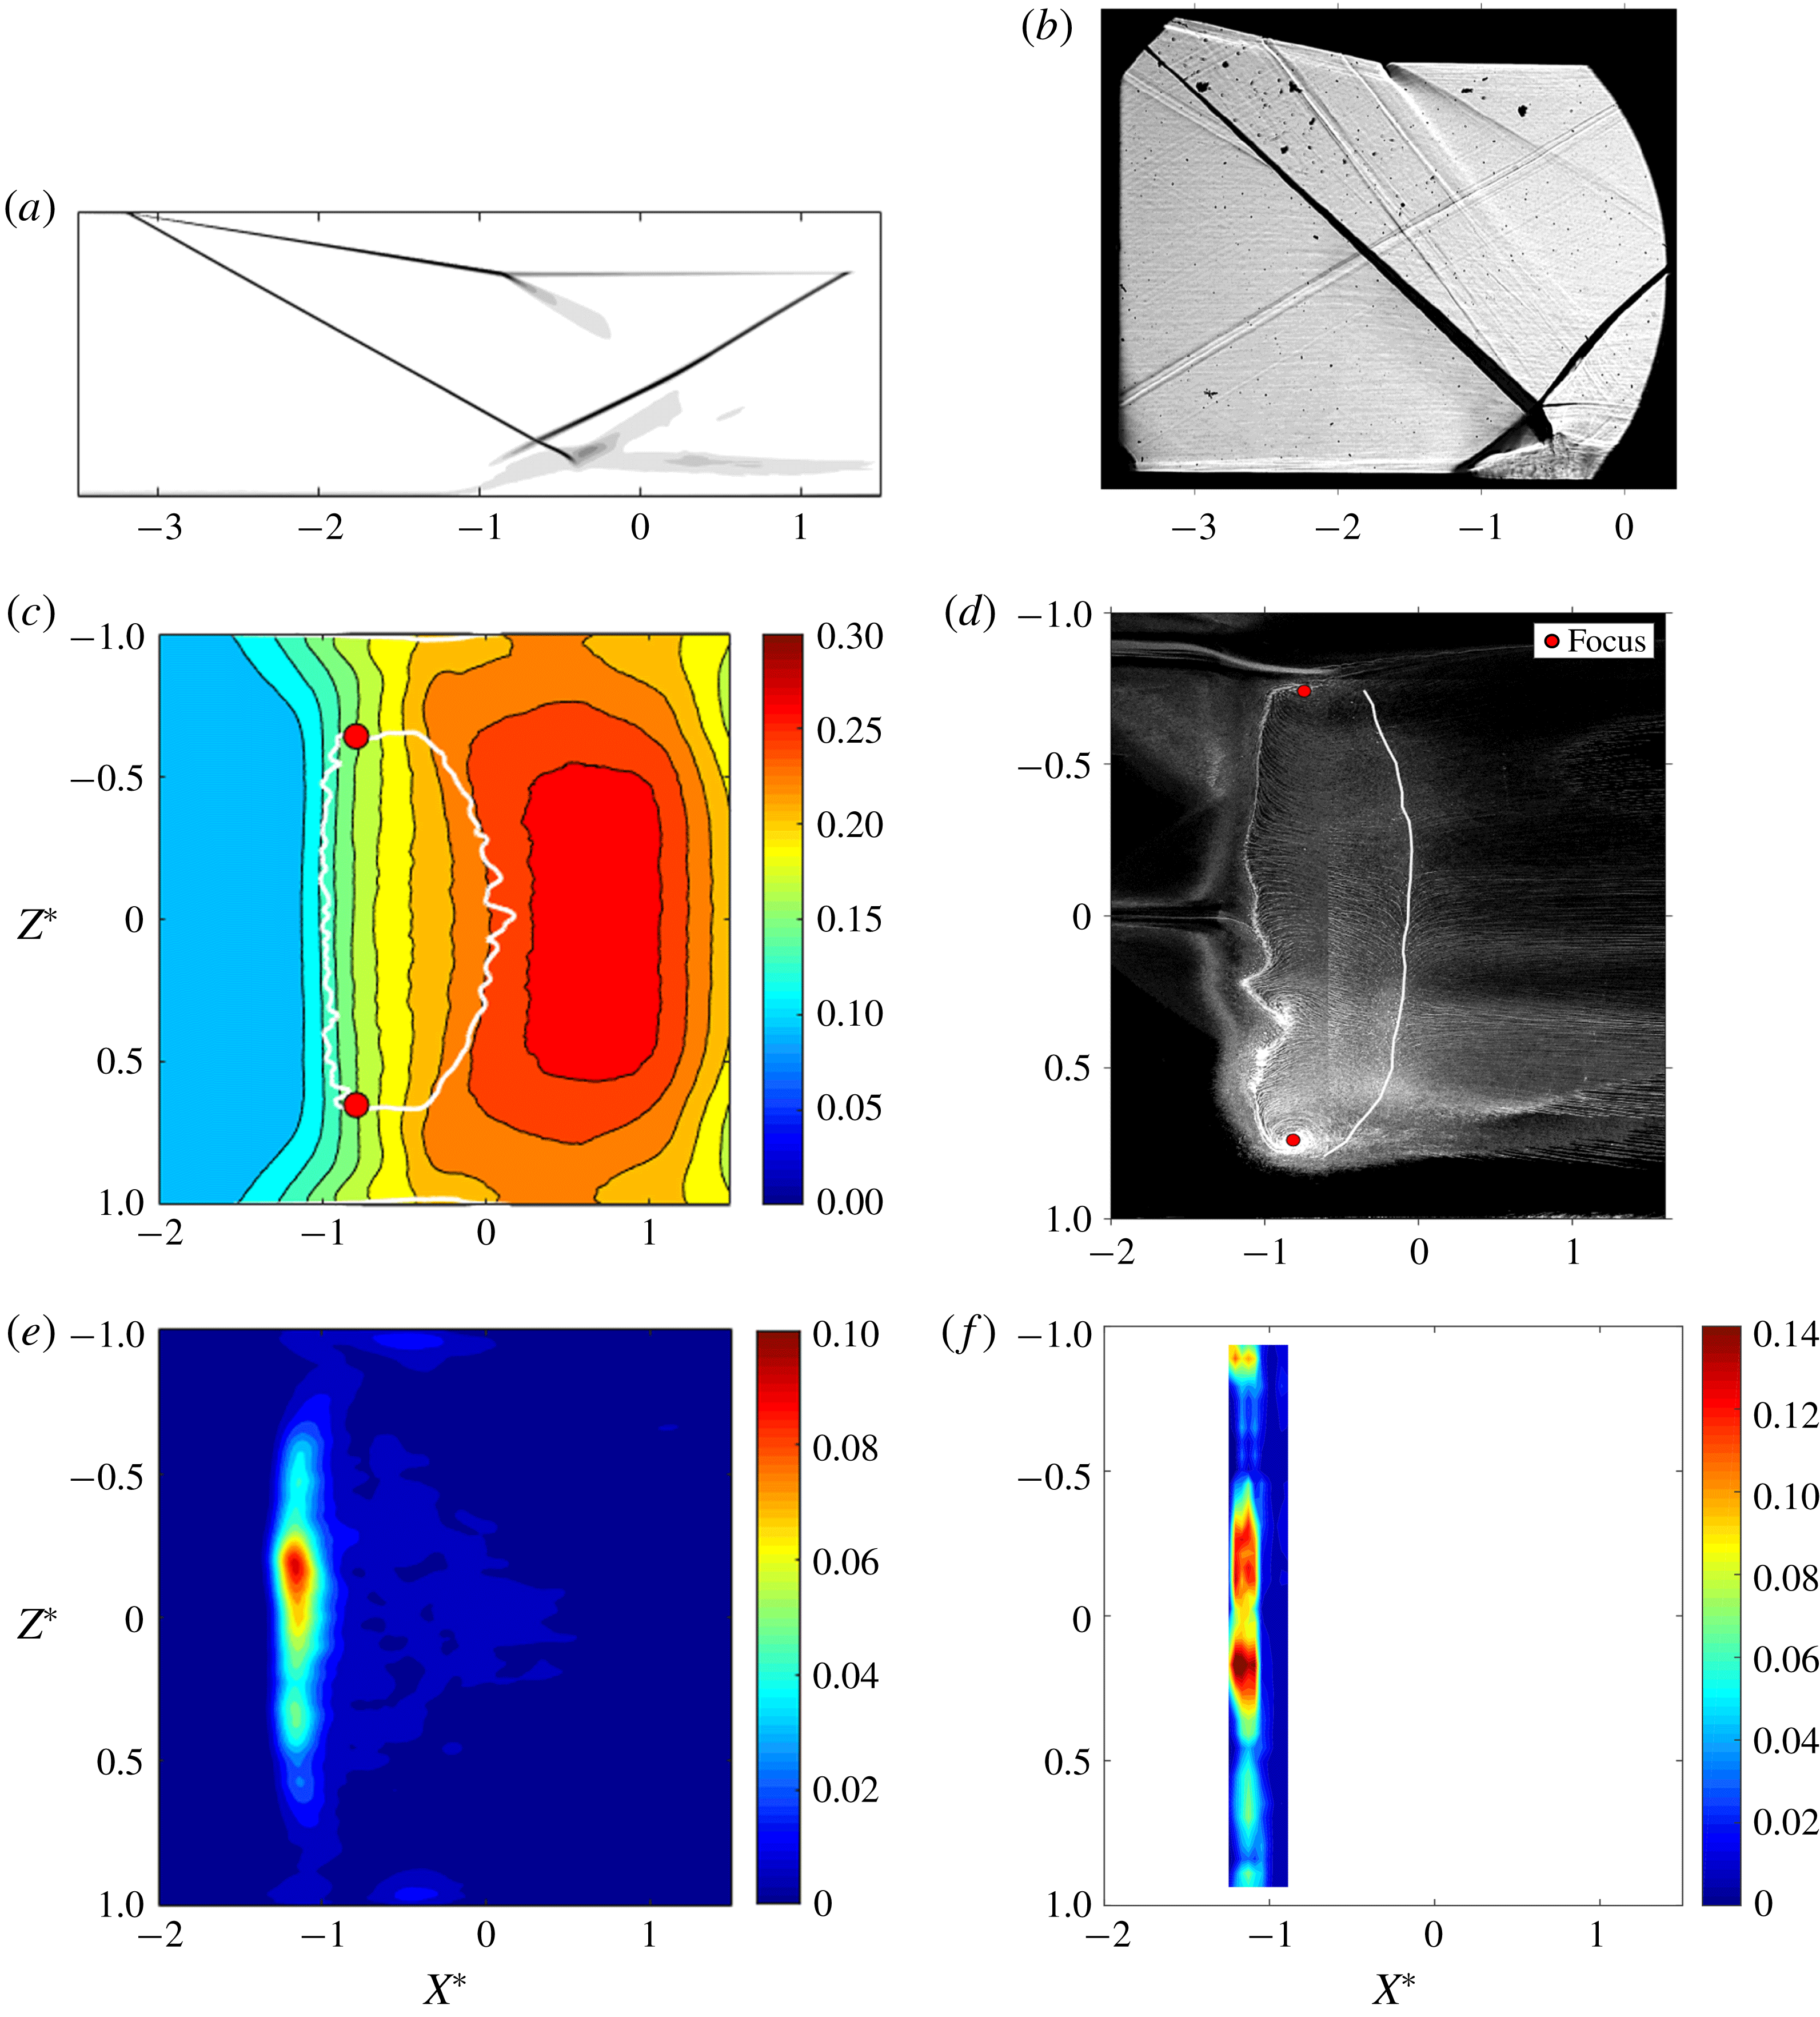
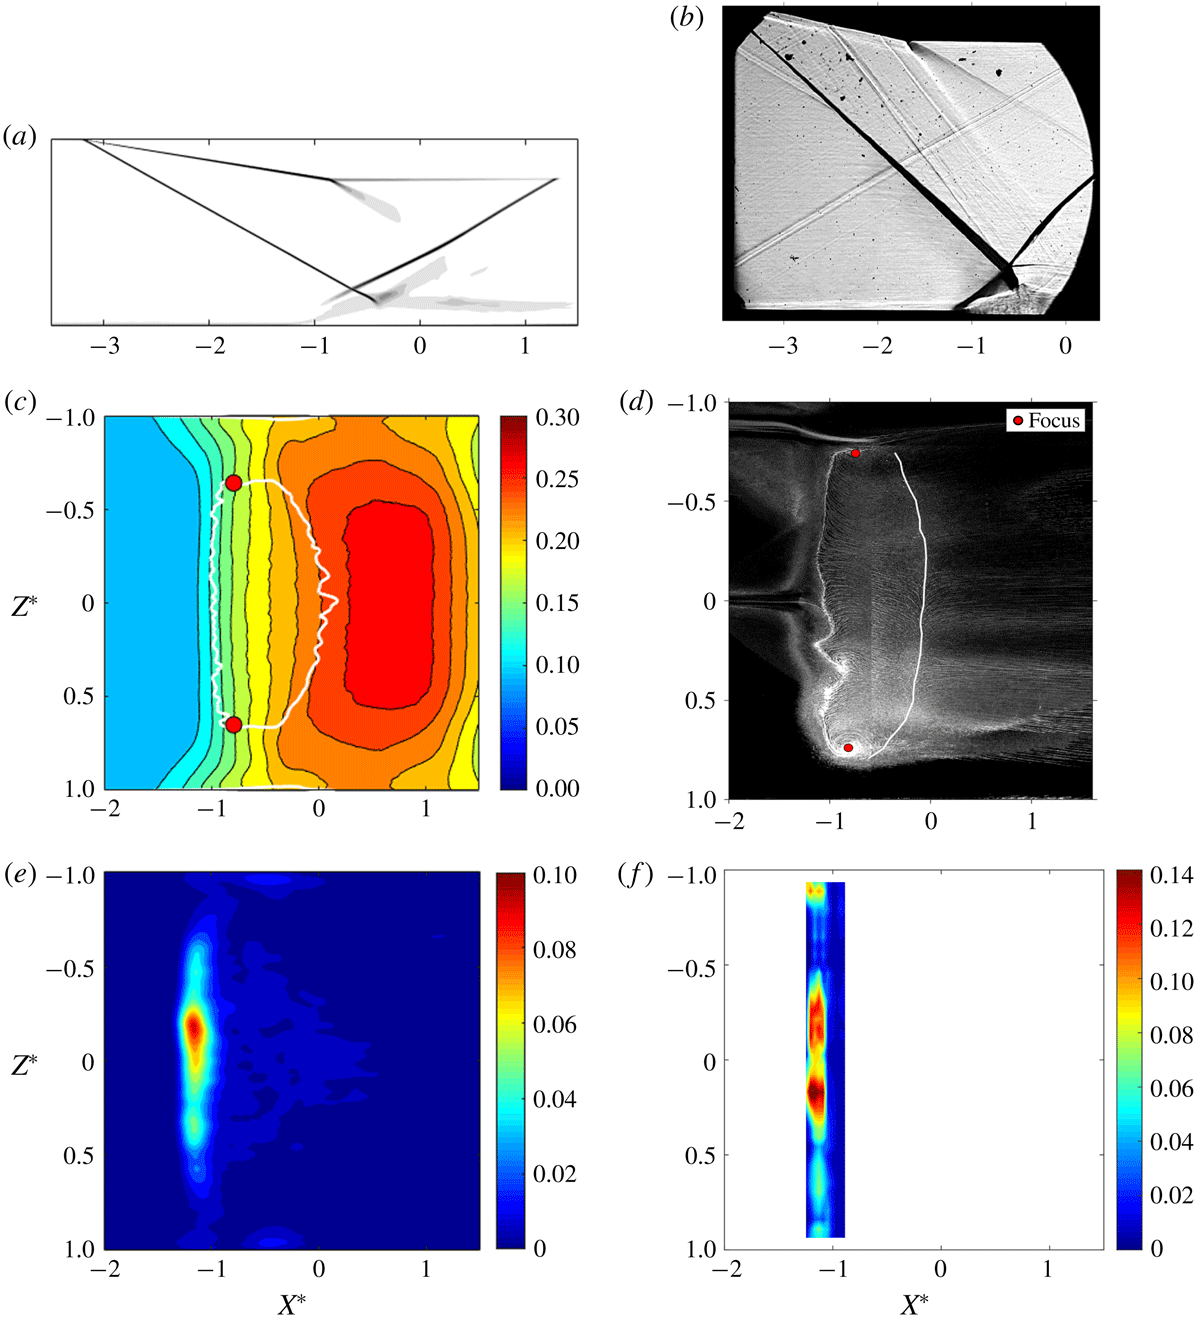
Figure 4. Schlieren images for (a) test case 1 and (b) test case 2. Mean separation regions on the floor plane with (c) contours of wall pressure for test case 1 and (d) artificially emphasised reattachment line for test case 2. Map of WPSDs at
![]() $St=0.03$
on the bottom wall plane for (e) test case 1 and (f) test case 2.
$St=0.03$
on the bottom wall plane for (e) test case 1 and (f) test case 2.
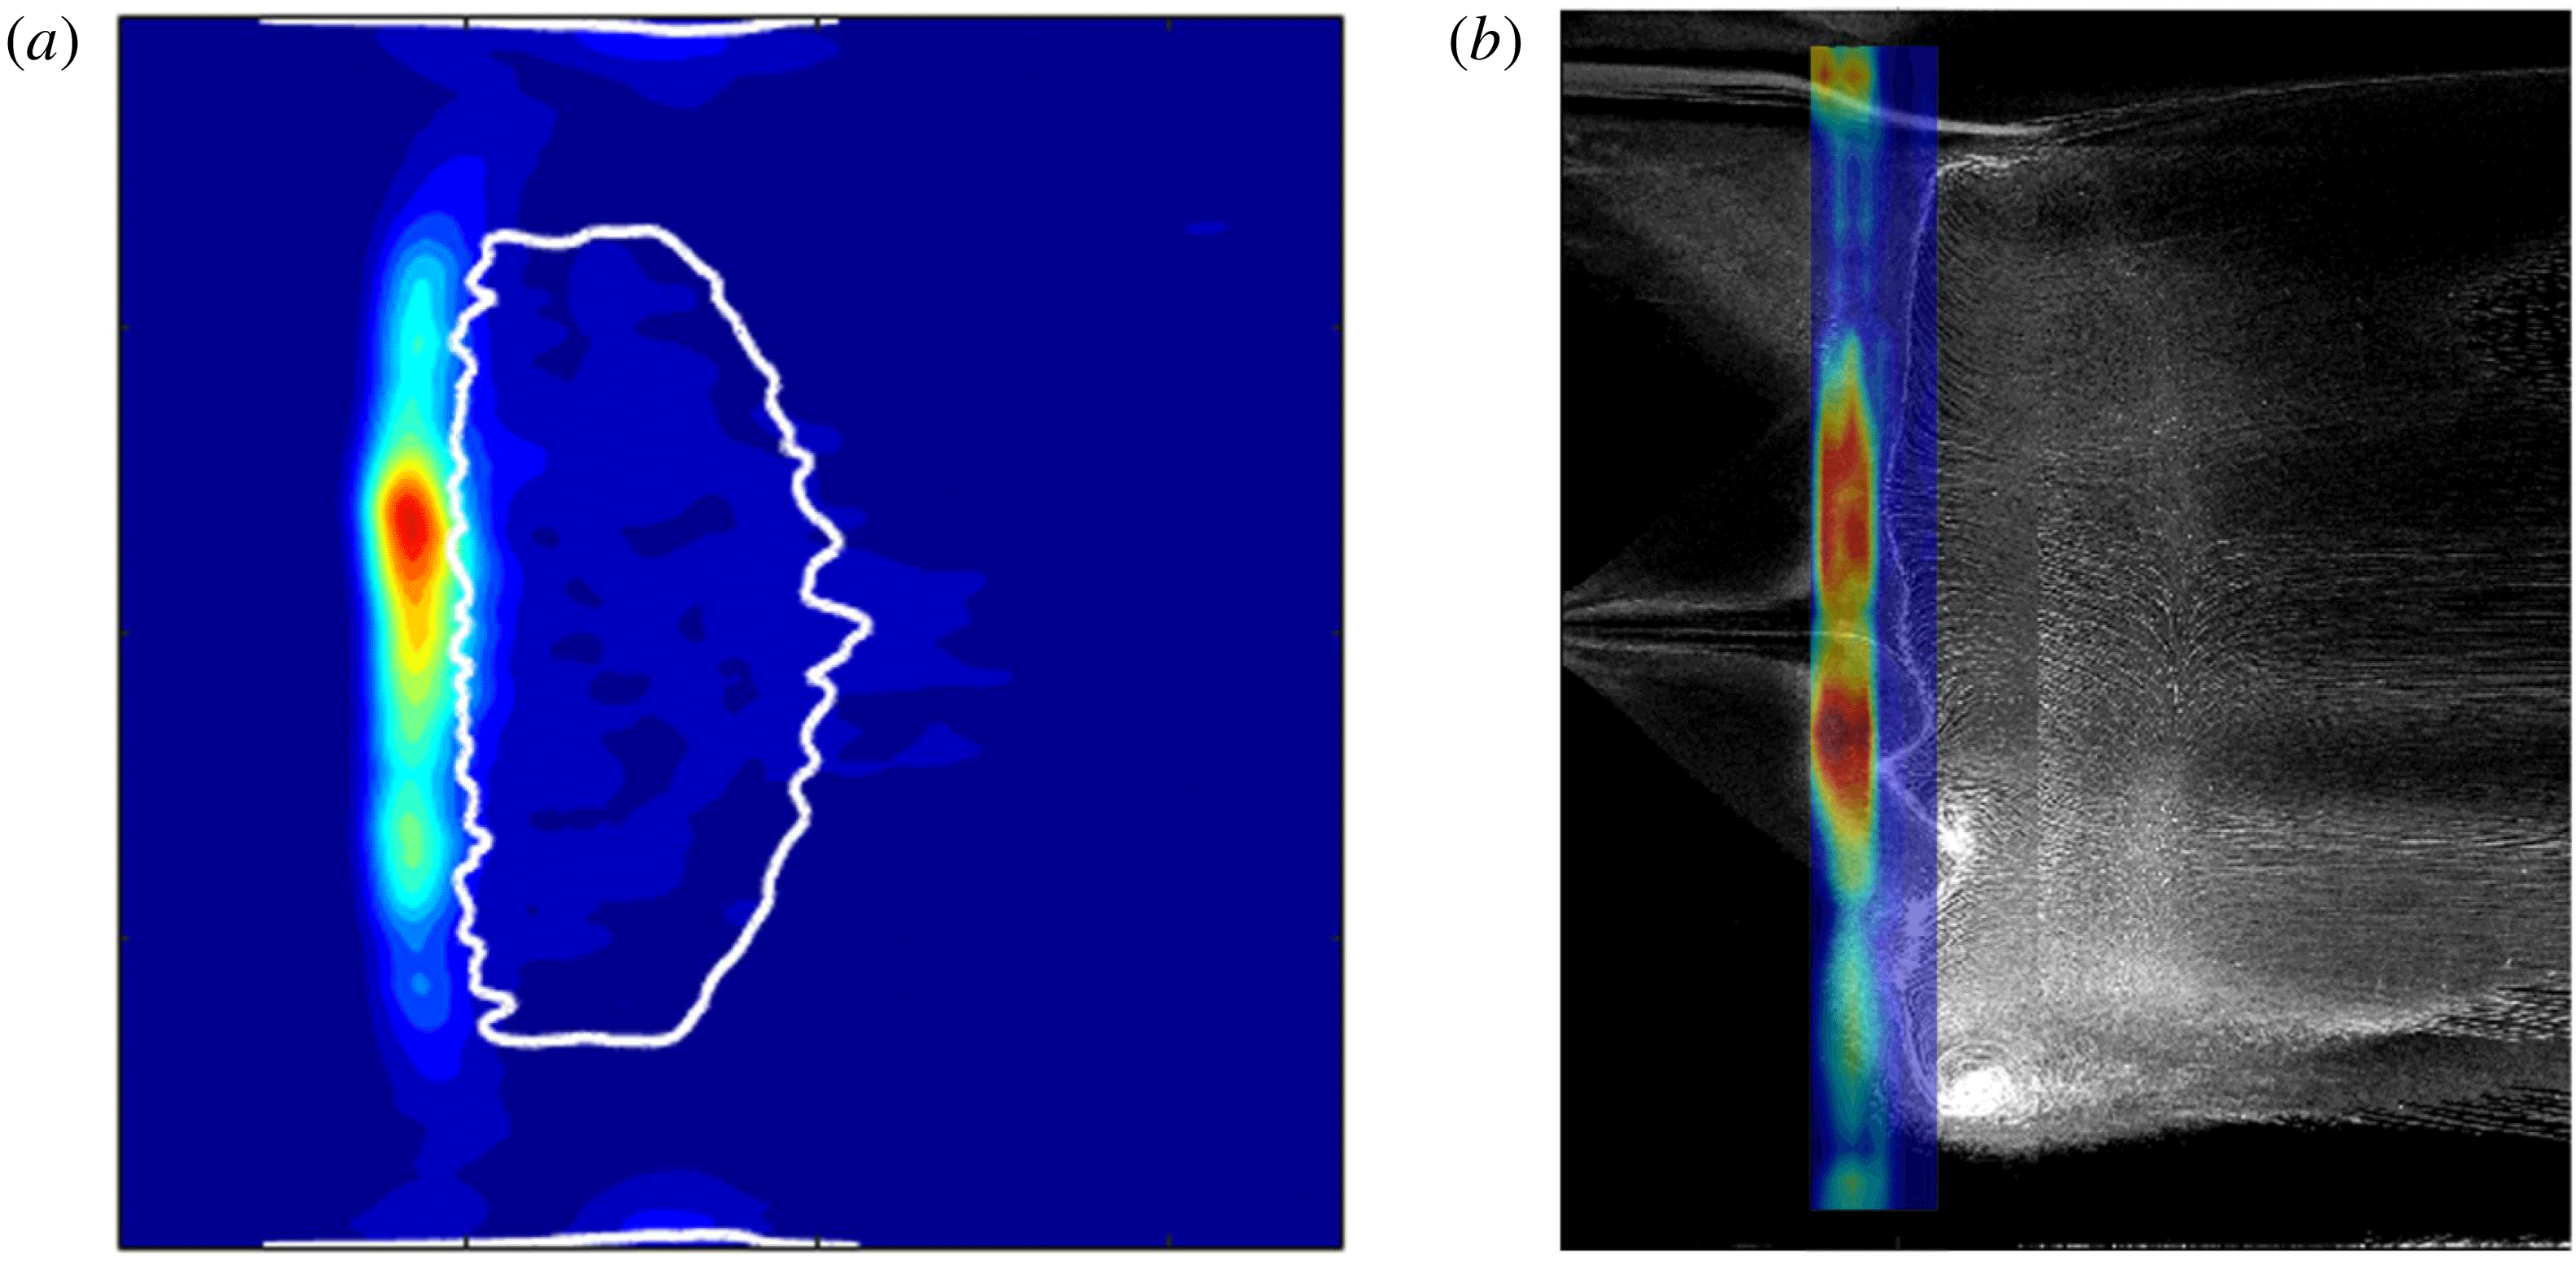
Figure 5. WPSD map superimposed with mean separation region for (a) test case 1 and (b) test case 2.
3.1 Mean separation regions
Figure 4(a,b) show schlieren images of the numerical and experimental flow fields (in the
![]() $x{-}y$
plane). Figure 4(c,d) show the mean separation regions in the
$x{-}y$
plane). Figure 4(c,d) show the mean separation regions in the
![]() $x{-}z$
plane: for the numerical case, this is shown by a white line along which
$x{-}z$
plane: for the numerical case, this is shown by a white line along which
![]() $(\unicode[STIX]{x2202}u/\unicode[STIX]{x2202}y)_{w}=0$
; while in the experiment, the oil collects at lines for which the shear stress is zero, and therefore the region for
$(\unicode[STIX]{x2202}u/\unicode[STIX]{x2202}y)_{w}=0$
; while in the experiment, the oil collects at lines for which the shear stress is zero, and therefore the region for
![]() $(\unicode[STIX]{x2202}u/\unicode[STIX]{x2202}y)_{w}\leqslant 0$
is apparent within the thick white lines in the photograph. As expected, the position of the separation line inferred from the oil flow in figure 4(d) aligns with the foot of the separation shock wave deduced from the schlieren in figure 4(b), consistent with previous reported results for incident-reflected SBLIs (Grossman & Bruce Reference Grossman and Bruce2018).
$(\unicode[STIX]{x2202}u/\unicode[STIX]{x2202}y)_{w}\leqslant 0$
is apparent within the thick white lines in the photograph. As expected, the position of the separation line inferred from the oil flow in figure 4(d) aligns with the foot of the separation shock wave deduced from the schlieren in figure 4(b), consistent with previous reported results for incident-reflected SBLIs (Grossman & Bruce Reference Grossman and Bruce2018).
![]() $X^{\ast }$
is normalised by
$X^{\ast }$
is normalised by
![]() $L_{sep}$
and
$L_{sep}$
and
![]() $Z^{\ast }$
by
$Z^{\ast }$
by
![]() $w/2$
.
$w/2$
.
A similar centreline separation length is caused by the interactions in both cases (
![]() $0.29w$
in the LES compared to
$0.29w$
in the LES compared to
![]() $0.23w$
in the experiment). A notable difference between the separation regions is that, while the LES separation line is straight, there is a large meandering in the experimental case in the positive
$0.23w$
in the experiment). A notable difference between the separation regions is that, while the LES separation line is straight, there is a large meandering in the experimental case in the positive
![]() $z$
-plane
$z$
-plane
![]() $O(0.3L_{sep})$
. This is attributed to an imperfection in the wind tunnel contraction or nozzle giving rise to different boundary layer characteristics across the span. Test case 1 exhibits a typical ‘medium viscous aspect ratio’ separation shape and test case 2 shows a ‘large viscous aspect ratio’ shape, as proposed by Babinsky et al. (Reference Babinsky, Oorebeek and Cottingham2013).
$O(0.3L_{sep})$
. This is attributed to an imperfection in the wind tunnel contraction or nozzle giving rise to different boundary layer characteristics across the span. Test case 1 exhibits a typical ‘medium viscous aspect ratio’ separation shape and test case 2 shows a ‘large viscous aspect ratio’ shape, as proposed by Babinsky et al. (Reference Babinsky, Oorebeek and Cottingham2013).
The foci of the tornado vortices described in § 1 are marked in figure 4(c,d). In test case 1 these are at approximately 36 % of the half-span from the walls, whereas in test case 2 these are at approximately 24 % of the half-span. Both Wang et al. (Reference Wang, Sandham, Hu and Liu2015) and Grossman & Bruce (Reference Grossman and Bruce2018) show a slight increase in distance from the wall to the foci for increasing
![]() $\def\AR{A\mkern-8muR}\AR$
, so this difference might be attributed to the difference in aspect ratio between the test cases.
$\def\AR{A\mkern-8muR}\AR$
, so this difference might be attributed to the difference in aspect ratio between the test cases.
3.2 Wall pressure spectra
Figure 4(e,f) show the energy content in the weighted power spectral density (WPSD) at
![]() $St=0.03$
on the floor plane of the interactions. This is made dimensionless by integrating over the Strouhal number range. Figure 4(e,f) highlight that high-energy low-frequency motions exist across the span of the central separation regions. There is also some low-frequency motion near the sidewalls in both cases. In the simulations this peaks at approximately
$St=0.03$
on the floor plane of the interactions. This is made dimensionless by integrating over the Strouhal number range. Figure 4(e,f) highlight that high-energy low-frequency motions exist across the span of the central separation regions. There is also some low-frequency motion near the sidewalls in both cases. In the simulations this peaks at approximately
![]() $0.7L_{sep}$
downstream of the peak unsteadiness of the central separation – outside the range of experimental measurements. However, experimental results do show energy comparable to that seen at the centreline in the same streamwise location as at the centre. Meanwhile, there is little low-frequency energy in the attached channels between the central and corner separations, which might have been expected as separation is a condition of low-frequency SBLI unsteadiness (Babinsky & Harvey Reference Babinsky and Harvey2011).
$0.7L_{sep}$
downstream of the peak unsteadiness of the central separation – outside the range of experimental measurements. However, experimental results do show energy comparable to that seen at the centreline in the same streamwise location as at the centre. Meanwhile, there is little low-frequency energy in the attached channels between the central and corner separations, which might have been expected as separation is a condition of low-frequency SBLI unsteadiness (Babinsky & Harvey Reference Babinsky and Harvey2011).
The higher energy in the corner separations of test case 2 might be due to the absolute height of the duct being three times larger than that of test case 1, which might result in larger interactions of the sidewall boundary layers with the incident shock. This hypothesis is supported by the apparent thickening of the incident shock towards the floor seen in the spanwise-integrated schlieren image for test case 2 in figure 4(b). This is because these interactions are equivalent to a swept SBLI (Wang et al. Reference Wang, Sandham, Hu and Liu2015). Hence, more energetic low-frequency motion might be expected due to the larger separations.
Comparison of figures 4(d) and 4(f) for test case 2 reveal that regions of high low-frequency power in the central separation region are correlated with locations where the separation line (inferred from oil flow) is locally displaced upstream. This is further explored in figure 5, where the WPSD maps have been superimposed onto the separation regions. Figure 5(b) confirms that, for test case 2 (with
![]() $\def\AR{A\mkern-8muR}\AR =1$
), regions of the interaction where the separation line is more upstream do exhibit more low-frequency power. This trend is less obvious in figure 5(a), possibly because the higher
$\def\AR{A\mkern-8muR}\AR =1$
), regions of the interaction where the separation line is more upstream do exhibit more low-frequency power. This trend is less obvious in figure 5(a), possibly because the higher
![]() $\def\AR{A\mkern-8muR}\AR$
of test case 1 (
$\def\AR{A\mkern-8muR}\AR$
of test case 1 (
![]() $\def\AR{A\mkern-8muR}\AR =2$
) gives rise to less significant spanwise variations in the location of the separation line.
$\def\AR{A\mkern-8muR}\AR =2$
) gives rise to less significant spanwise variations in the location of the separation line.
The spanwise power distribution at the streamwise lines containing the point with the highest energy (
![]() $X^{\ast }=-1.14$
in test case 1 and
$X^{\ast }=-1.14$
in test case 1 and
![]() $X^{\ast }=-1.30$
in test case 2) are presented in figure 6. It shows that the most energetic instances of the low frequencies do not occur at the centreline. This case falls into category (ii) from Wang et al. (Reference Wang, Sandham, Hu and Liu2015), in which the sidewall effects have reached the central region of the flow, resulting in significant spanwise variations in the incident shock strength.
$X^{\ast }=-1.30$
in test case 2) are presented in figure 6. It shows that the most energetic instances of the low frequencies do not occur at the centreline. This case falls into category (ii) from Wang et al. (Reference Wang, Sandham, Hu and Liu2015), in which the sidewall effects have reached the central region of the flow, resulting in significant spanwise variations in the incident shock strength.
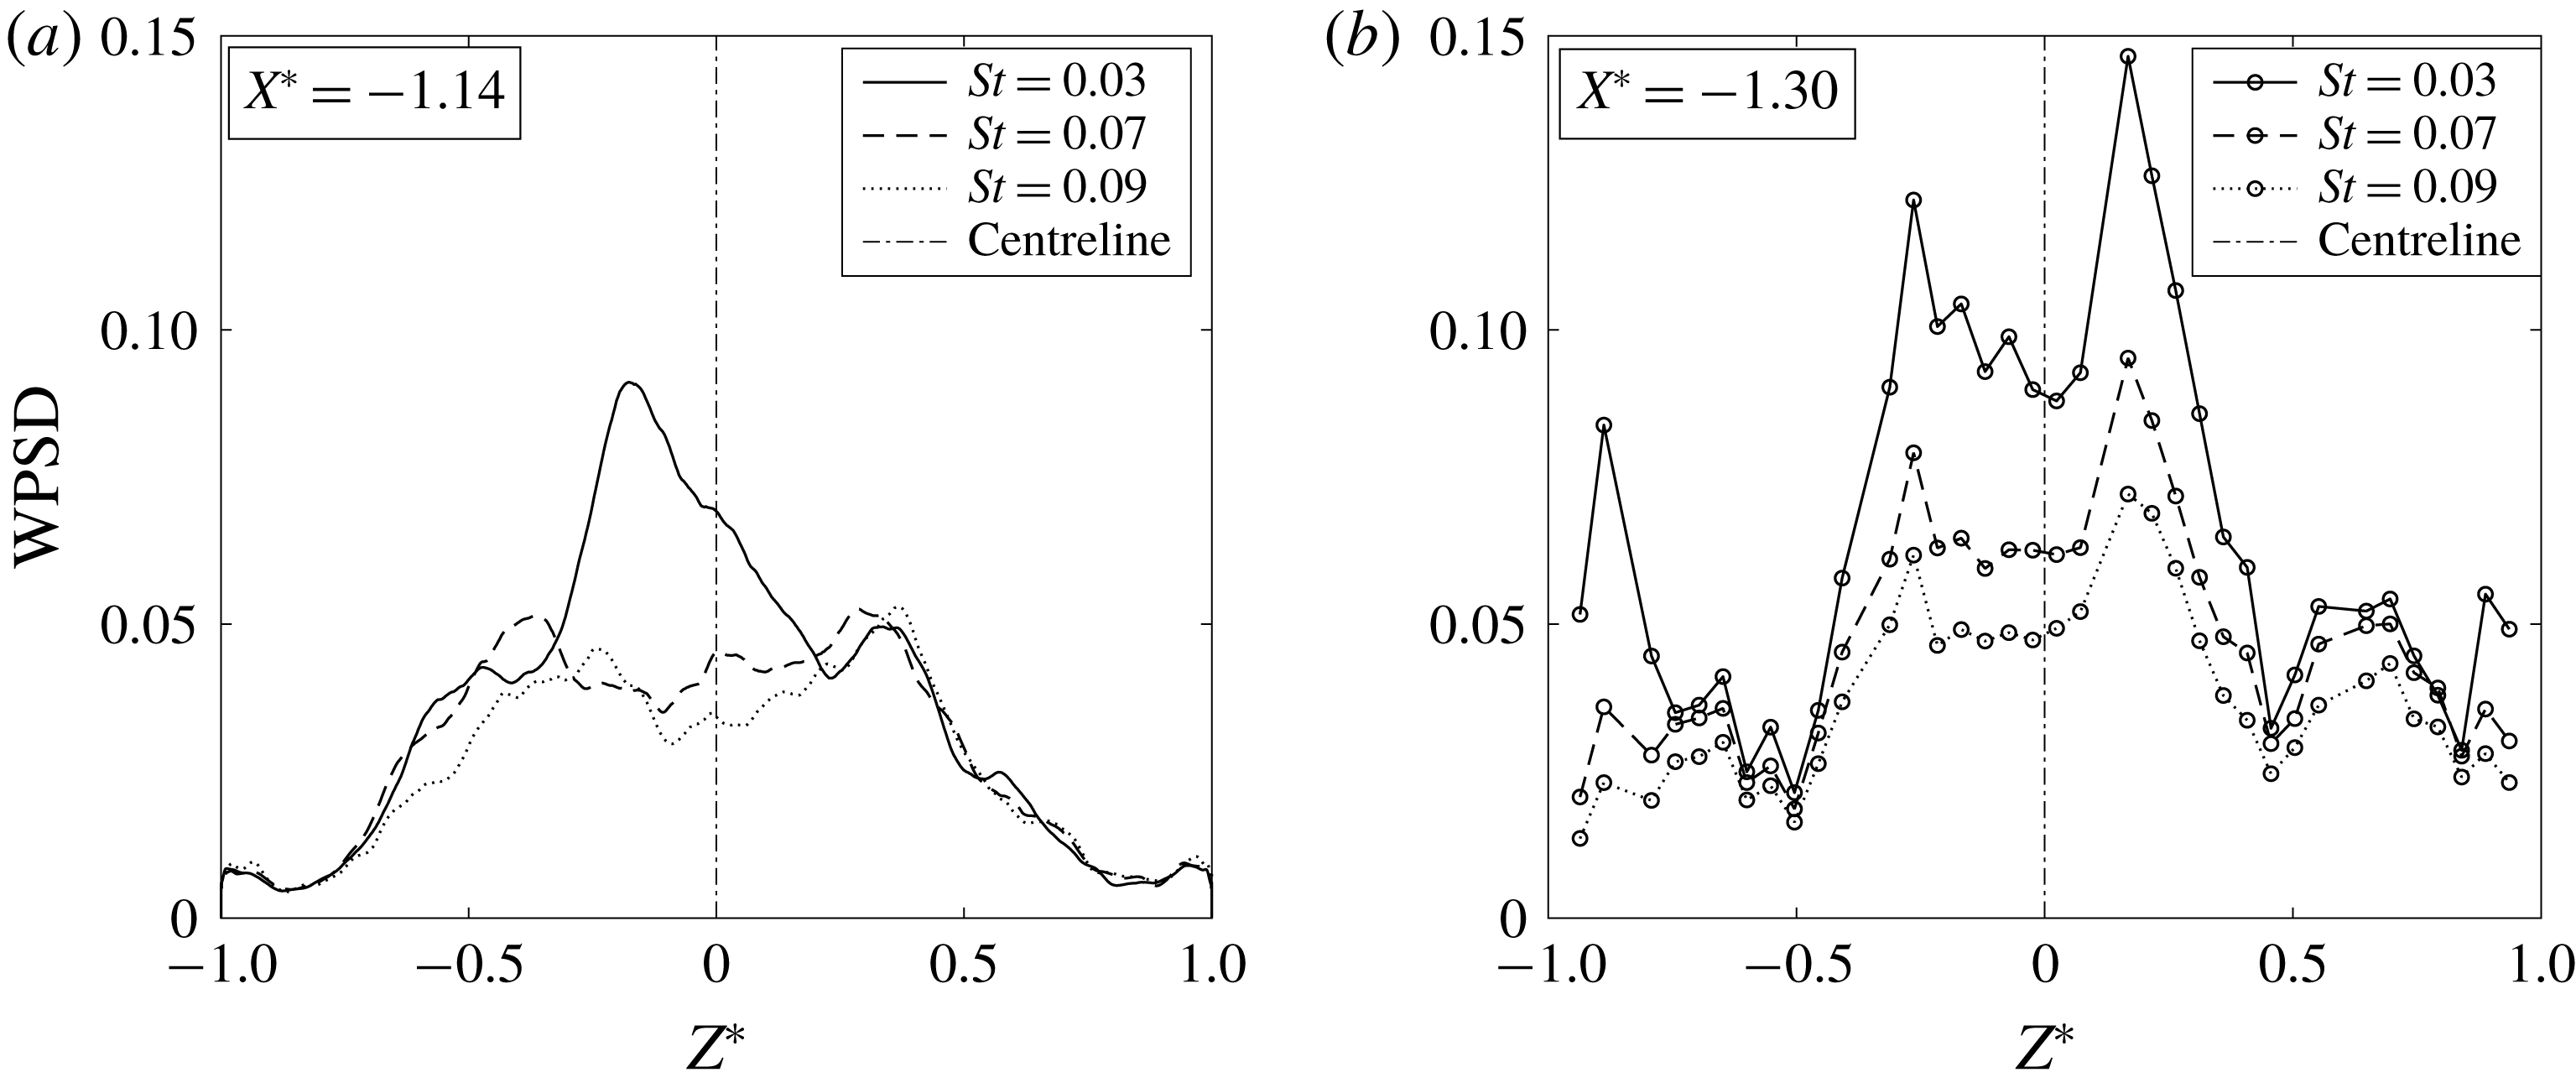
Figure 6. WPSD at streamwise locations of highest
![]() $St=0.03$
energy content for (a) test case 1 and (b) test case 2.
$St=0.03$
energy content for (a) test case 1 and (b) test case 2.
Off-centre peaks appear in all the cases in figure 6. In all the cases except the numerical case at
![]() $St=0.03$
(which is most affected by the sampling time), there are two off-centre peaks. In the experiment these are not quite symmetric about the centreline. However, the ratio of the power across the peaks for the different Strouhal numbers remains fairly constant (at approximately 1.2), implying convergence. It is therefore possible that some interactions exhibit a more prevalent low-frequency behaviour on one side of the spanwise centre.
$St=0.03$
(which is most affected by the sampling time), there are two off-centre peaks. In the experiment these are not quite symmetric about the centreline. However, the ratio of the power across the peaks for the different Strouhal numbers remains fairly constant (at approximately 1.2), implying convergence. It is therefore possible that some interactions exhibit a more prevalent low-frequency behaviour on one side of the spanwise centre.
3.3 Two-point correlations
Given the significant low-frequency energy content near the sidewalls, the influence of pressure fluctuations near the wall on those at the centre was examined by considering the two-point correlations
![]() $R_{pp}$
of the pressure signals. This is defined as in (3.1), where
$R_{pp}$
of the pressure signals. This is defined as in (3.1), where
![]() $p^{\prime }(z,\unicode[STIX]{x1D70F})$
is the pressure fluctuation at a location
$p^{\prime }(z,\unicode[STIX]{x1D70F})$
is the pressure fluctuation at a location
![]() $z$
and time instance
$z$
and time instance
![]() $\unicode[STIX]{x1D70F}$
and
$\unicode[STIX]{x1D70F}$
and
![]() $p^{\prime }(z+r_{2},\unicode[STIX]{x1D70F}^{\prime })$
is the pressure fluctuation at a location separated from
$p^{\prime }(z+r_{2},\unicode[STIX]{x1D70F}^{\prime })$
is the pressure fluctuation at a location separated from
![]() $z$
by
$z$
by
![]() $r_{2}$
in the
$r_{2}$
in the
![]() $z$
-direction and at a time delay
$z$
-direction and at a time delay
![]() $\unicode[STIX]{x1D70F}^{\prime }$
. A positive time delay corresponds to the event at time
$\unicode[STIX]{x1D70F}^{\prime }$
. A positive time delay corresponds to the event at time
![]() $\unicode[STIX]{x1D70F}$
occurring first. The signals are first low-pass filtered with a cutoff frequency of
$\unicode[STIX]{x1D70F}$
occurring first. The signals are first low-pass filtered with a cutoff frequency of
![]() $St=0.15$
to focus on low-frequency behaviour. Contour levels
$St=0.15$
to focus on low-frequency behaviour. Contour levels
![]() $-0.2<R_{pp}<0.2$
are suppressed to mitigate noise.
$-0.2<R_{pp}<0.2$
are suppressed to mitigate noise.
Figure 7 shows that significant correlations of centreline behaviour diminish beyond approximately 20 % of the half-span. In contrast, figure 8 shows that there are significant correlations from the near-wall point into the central flow until the spanwise location of the vortex foci shown in figure 4(c,d) (at
![]() $Z^{\ast }=0.64$
and
$Z^{\ast }=0.64$
and
![]() $Z^{\ast }=0.76$
in test cases 1 and 2, respectively). Therefore, along the same streamwise plane, there is not a significant relation of the pressure between the two separation regions.
$Z^{\ast }=0.76$
in test cases 1 and 2, respectively). Therefore, along the same streamwise plane, there is not a significant relation of the pressure between the two separation regions.

Figure 7. Two-point correlations from centreline pressure at (a)
![]() $Z^{\ast }=0.00$
for test case 1 and (b)
$Z^{\ast }=0.00$
for test case 1 and (b)
![]() $Z^{\ast }=0.02$
for test case 2 along same spanwise axis.
$Z^{\ast }=0.02$
for test case 2 along same spanwise axis.

Figure 8. Two-point correlations from near wall pressure at (a)
![]() $Z^{\ast }=0.96$
for test case 1 and (b)
$Z^{\ast }=0.96$
for test case 1 and (b)
![]() $Z^{\ast }=0.94$
for test case 2 along same spanwise axis.
$Z^{\ast }=0.94$
for test case 2 along same spanwise axis.
The influence of the corner separation unsteadiness from a different streamwise plane on the central region was evaluated, for which only the numerical data could be employed. A further two-point correlation was performed between the signal at
![]() $X^{\ast }=-0.41$
,
$X^{\ast }=-0.41$
,
![]() $Z^{\ast }=0.96$
(the high-energy peak in the corner separation of figure 4
e) and across the span of the domain at
$Z^{\ast }=0.96$
(the high-energy peak in the corner separation of figure 4
e) and across the span of the domain at
![]() $X^{\ast }=-1.14$
. This is shown in figure 9, which highlights a negative correlation with the pressure signal
$X^{\ast }=-1.14$
. This is shown in figure 9, which highlights a negative correlation with the pressure signal
![]() $0.74L_{sep}$
upstream, at a slightly later time. However, this correlation extends less far into the central flow, and therefore does not appear to be affecting the central unsteadiness.
$0.74L_{sep}$
upstream, at a slightly later time. However, this correlation extends less far into the central flow, and therefore does not appear to be affecting the central unsteadiness.
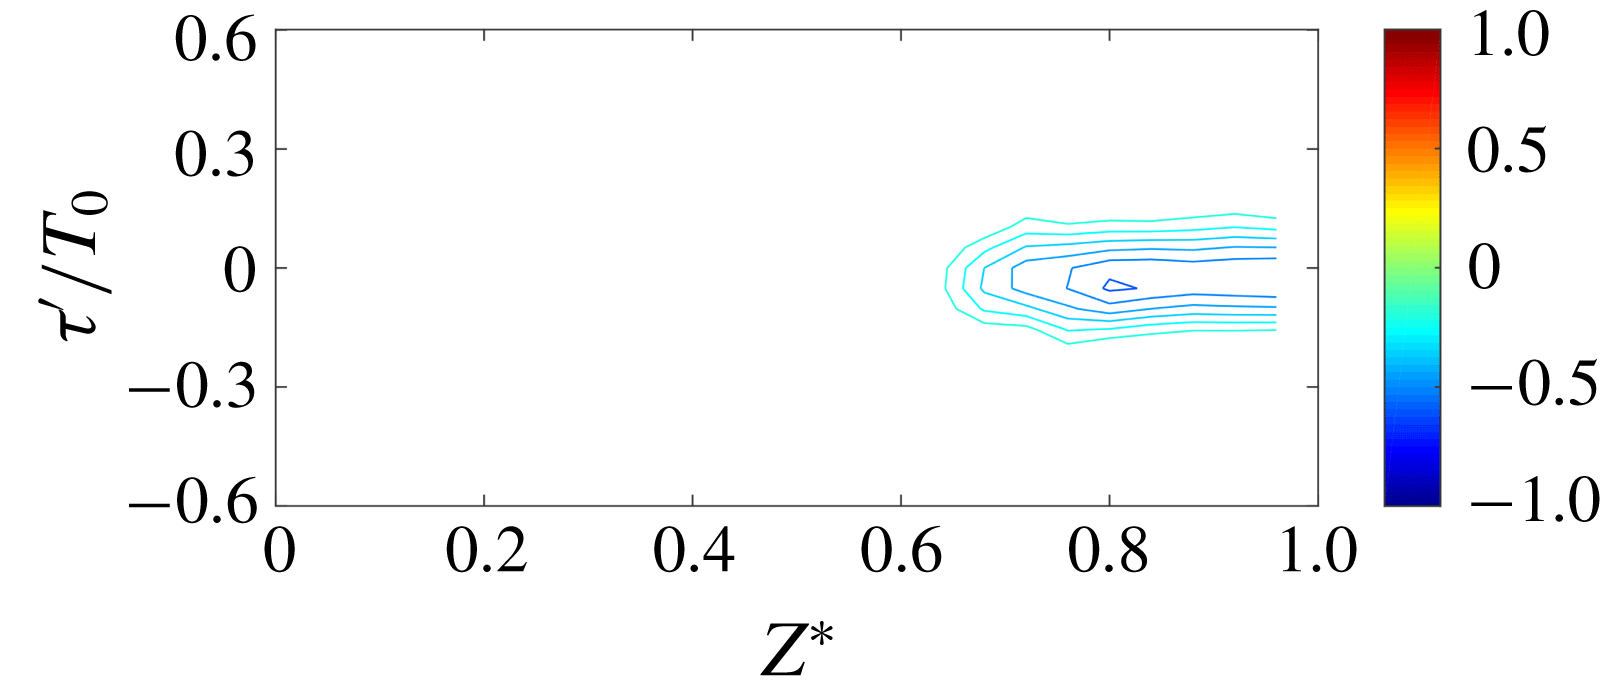
Figure 9. Two-point correlations from near wall pressure at
![]() $Z^{\ast }=0.96$
,
$Z^{\ast }=0.96$
,
![]() $X^{\ast }=-0.41$
and spanwise points along
$X^{\ast }=-0.41$
and spanwise points along
![]() $X^{\ast }=-1.14$
.
$X^{\ast }=-1.14$
.
None of the surface pressure correlations, consistently between the experiments and simulations, show any indication of a low-frequency unsteady connection between the sidewall and central separations. This is in agreement with the conclusion drawn from separate central and corner separation measurements by Funderburk & Narayanaswamy (Reference Funderburk and Narayanaswamy2016). Due to the datasets only being available at the floor, it is not possible to directly assess the correlation of the two regions above the bottom wall on different wall-normal planes. This could potentially occur via the interaction of the tornado vortices and sidewall vortices.
4 Conclusion
Two oblique SBLIs of similar strength have been investigated. Both exhibit the most powerful instances of low-frequency motions off-centre – likely due to the incident shocks being locally strengthened by their interaction with the sidewall boundary layers. Both showed asymmetric unsteadiness behaviour – the reasons for which appear to be different. The experimental separation region exhibited significant asymmetry, which correlated with a varying spanwise power in the low-frequency motions. An asymmetry was also seen in the spanwise distribution of power in
![]() $St=0.03$
in the LES data; however, this may be an artefact of the data only comprising 23 expected low-frequency periods. At frequencies for which there are more available cycles and hence better convergence (
$St=0.03$
in the LES data; however, this may be an artefact of the data only comprising 23 expected low-frequency periods. At frequencies for which there are more available cycles and hence better convergence (
![]() $St=0.07$
and 0.09), the unsteadiness was more symmetric, with peaks away from the centre.
$St=0.07$
and 0.09), the unsteadiness was more symmetric, with peaks away from the centre.
Nonetheless, the results show that conventional assumptions of two-dimensionality at the centre of an interaction may be invalid even at moderate aspect ratios. This could explain some discrepancies between spanwise-periodic simulations and experiments, as the sidewalls affected the mean unsteady characteristics, even though the cross-correlations at low frequency showed no direct dynamical link between the central and corner separations.
The low-frequency energy content was more prevalent in the corner separations in the experimental case. This could be attributed to the smaller test section aspect ratio giving the swept sidewall SBLIs greater influence, although more tests at different aspect ratios are desirable in order to verify this. While the two-point correlations of the pressure at the near-sidewall points with the pressure at the more central points were insignificant, these datasets were limited to the pressure history at the floor. Therefore, the study cannot completely rule out the possibility of the corner separations affecting the central unsteadiness. It would be of interest to compare the results to studies with ‘quasi-two-dimensional’ and highly three-dimensional interaction regions, which may reveal different relations between central and corner separations.
Acknowledgement
The authors would like to thank UK Turbulence Consortium under EPSRC grant EP/L000261/1 for the computing time.


