


1. Introduction
Vortex-induced vibrations (VIV) of a one degree of freedom (1DOF) cylinder placed in flow is a canonical problem in fluid-structure interactions (Bearman Reference Bearman1984; Sarpkaya Reference Sarpkaya2004; Williamson & Govardhan Reference Williamson and Govardhan2004). When the shedding frequency and the natural frequency of the system become equal, oscillations are observed in the transverse direction (cross-flow (CF) direction) over a range of reduced velocity (a dimensionless flow velocity). This range is called the lock-in range in which the shedding frequency and the oscillation frequency are synchronized, and the shedding frequency deviates from that predicted by the Strouhal law. If the cylinder is allowed to oscillate in the inline (IL) direction as well, dual resonance can occur (Dahl, Hover & Triantafyllou Reference Dahl, Hover and Triantafyllou2006, Reference Dahl, Hover and Triantafyllou2007; Dahl et al. Reference Dahl, Hover, Triantafyllou and Oakley2010), in which case synchronization between the shedding frequency and the CF oscillation frequencies as well as synchronization between two times the shedding frequency and the IL oscillation frequencies are observed, and as a result the response follows a figure-eight trajectory. During dual resonance, the cylinder moves upstream at the two extremes of its CF displacement – also referred to as a counterclockwise (CCW) trajectory. This preferred direction of the trajectory is not limited to a two degree of freedom (2DOF) cylinder. A flexible cylinder undergoing VIV also exhibits CCW figure-eight trajectories in the region where the flow has excited the structure (Bourguet et al. Reference Bourguet, Modarres-Sadeghi, Karniadakis and Triantafyllou2011). A floating cylinder, supported by mooring lines, and undergoing VIV also follows a CCW figure-eight motion in the range of excitation (Carlson & Modarres-Sadeghi Reference Carlson and Modarres-Sadeghi2018).
If instead of a cylinder, bluff bodies with non-circular cross-sections are placed in flow, besides VIV, galloping could be observed as well. Despite VIV, which is the result of a synchronization between the shedding frequency and the natural frequency of the system, galloping is the result of a negative overall damping of the system due to the flow-induced damping (Blevins Reference Blevins1990; Païdoussis, Price & De Langre Reference Païdoussis, Price and De Langre2010).
In a recent study, Zhao et al. (Reference Zhao, Nemes, Jacono and Sheridan2010) and Nemes et al. (Reference Nemes, Zhao, Lo Jacono and Sheridan2012) studied the flow-induced response of a 1DOF square prism placed at different angles of attack in water. They observed that a square prism undergoes galloping for angles of attack up to  $7.5^{\circ }$, i.e. for angles of attack where one of the sides of the square is mainly perpendicular to the incoming flow. Then for a narrow range of angles of attack,
  $\alpha = 7.5^{\circ }\text {--}10^{\circ }$, they observed both VIV and galloping, as the response transitioned to mainly VIV for higher angles of attack. They used their data to explain that the ‘kink’ in the galloping response that was originally observed by Bearman et al. (Reference Bearman, Gartshore, Maull and Parkinson1987) is related to the synchronization of the vortex shedding frequency to the first or the third harmonic of the oscillation frequency. Zhao, Cheng & Zhou (Reference Zhao, Cheng and Zhou2013) performed numerical analysis for a square prism with a
  $1:1$ ratio between the CF and IL natural frequencies, and a mass ratio of
  $m^* \approx 3$, for
  $\alpha = 0^{\circ }, 22.5^{\circ }$ and
  $45^{\circ }$. They observed lock-in for all three angles of attack, however, they did not observe any galloping for the
  $\alpha = 0^{\circ }$ case, despite the experimental observation of galloping at this angle of attack by Zhao et al. (Reference Zhao, Leontini, Lo Jacono and Sheridan2014). They related the lack of galloping to the low Reynolds number (
 $Re=100$) used in their numerical work. Zhao (Reference Zhao2015) extended the numerical analysis of this system to structures with rectangular cross-sections. Li et al. (Reference Li, Lyu, Kou and Zhang2019) used linear stability analysis of a square prism at
  $\alpha = 0^\circ$ with a degree of freedom in the CF direction to determine unstable structural and fluid modes and investigated how those modes change with the mass ratio,
  $m^{*}$, and the Reynolds number,
  ${\it Re}$. They showed that mode competition can delay the onset of galloping when modes approach each other in frequency: the wake mode dominates and locks the structural mode, preventing galloping. During galloping, they showed that the wake mode and the structural mode were innately weakly coupled.
Besides a square cross-section, a bluff body with a triangular cross-section has been studied recently as a case of a bluff body with non-circular cross-section, which can exhibit both VIV and galloping responses, at different angles of attack. Several recent studies have considered the equilateral triangle case (Alonso, Meseguer & Pérez-Grande Reference Alonso, Meseguer and Pérez-Grande2005; Alonso & Meseguer Reference Alonso and Meseguer2006; Alonso, Sanz-Lobera & Meseguer Reference Alonso, Sanz-Lobera and Meseguer2012; Alawadhi Reference Alawadhi2013; Seyed-Aghazadeh, Carlson & Modarres-Sadeghi Reference Seyed-Aghazadeh, Carlson and Modarres-Sadeghi2017).
The experimental works by Alonso et al. (Reference Alonso, Meseguer and Pérez-Grande2005) and Alonso & Meseguer (Reference Alonso and Meseguer2006) considered a pendulum-like triangular prism (with mainly a CF degree of freedom and a slight IL contribution) and recorded the oscillation response and instability regions for varying angles of attack and varying leading vertex angles. They showed that both  $\alpha$ (the angle of attack) and
  $\beta$ (the vertex angle) influence the onset of galloping. Alonso et al. (Reference Alonso, Sanz-Lobera and Meseguer2012) continued to expand the instability map for a triangular prism by also considering hysteresis. They showed the instability regions agreed with the findings of Parkinson & Smith (Reference Parkinson and Smith1964), in that the galloping instability is related to the slope of the lift versus
  $\alpha$ and, furthermore, that hysteresis occurs at inflection points of
  $C_L$ versus
  $\alpha$. Seyed-Aghazadeh et al. (Reference Seyed-Aghazadeh, Carlson and Modarres-Sadeghi2017) considered a prism with pure CF degree of freedom and investigated the wake modes, oscillation response and fluid forces for
  $\alpha = 0^{\circ }\text {--}60^{\circ }$ and a reduced velocity,
  $U^*$, of up to 23. They showed a range of
  $\alpha = 30^{\circ }\text {--}35^{\circ }$ where both VIV and galloping occur at different
  ${\it U^*}$ ranges. For these angles of attack, at lower reduced velocities, VIV was observed, then no oscillations were observed for a range of reduced velocities, and then at a higher reduced velocity galloping started. At angles of attack above
  $35^{\circ }$, when the oscillations started at the beginning of the lock-in range, they never stopped as the reduced velocity was increased, and the VIV-type response transitioned to galloping-type without any region of zero-amplitude response in between.
While there are several studies on transition from VIV to galloping for bluff bodies with non-circular cross-sections free to oscillate in the CF direction only, studies in which the non-circular body is allowed to oscillate in both the CF and IL directions are limited. Studies on VIV of a circular cylinder with 2DOF have revealed that the VIV response of the cylinder is influenced significantly by the introduction of the IL degree of freedom, and it is our goal here to investigate the influence of introducing the IL degree of freedom on the flow-induced response of a non-circular bluff body.
In the present work, we consider a bluff body with a square cross-section, which is free to oscillate in both the CF and IL directions, with a 2 : 1 ratio between the natural frequencies in the IL and CF direction,  $f_{nIL} = 2 \times f_{nCF}$, so that dual resonance is possible for the system. We place the square prism in the flow of water at different angles of attack, and we investigate the response of the structure, as we increase the flow velocity, by measuring the structure's displacements in the IL and CF directions and the flow forces that act on the structure. Simultaneously, we conduct flow visualizations of the wake to relate the observed response to the wake of the structure.
We have chosen a  $2:1$ ratio for the IL and CF frequencies to make a dual resonance possible. Previous studies on a 2DOF cylinder have shown that when a
  $2:1$ ratio exists between the IL and CF frequencies, the lock-in in both directions start at the same reduced velocity. This is also expected to occur here, since the frequency of the fluctuating flow forces in the IL direction is twice that in the CF direction, and if a
  $2:1$ ratio of the natural frequencies are also considered, then dual resonance is expected. Results of studies on 2DOF VIV of a cylinder have shown that when instead of a
  $2:1$ ratio, a
  $1:1$ ratio exists, lock-in can still occur in both the CF and IL directions, however, the lock-in ranges do not start at the same value of the reduced velocity. The lock-in in the IL direction (and oscillations in the CF direction as a result of the IL lock-in) is observed at a lower reduced velocity, and the lock-in in the CF (and oscillations in the IL direction as a result of the CF lock-in) occurs at a higher reduced velocity (Williamson & Jauvtis Reference Williamson and Jauvtis2004). When VIV of a 2DOF system is considered as a representative of a cross-section of a long flexible structure, then the
  $2:1$ ratio between the two frequencies should be considered, since in a tension-dominated flexible cylinder, there always exists a natural frequency in the IL direction twice the natural frequency for which a lock-in is observed in the CF direction, and as a result, when CF lock-in is observed, an IL lock-in is observed simultaneously as well (Seyed-Aghazadeh & Modarres-Sadeghi Reference Seyed-Aghazadeh and Modarres-Sadeghi2016; Seyed-Aghazadeh, Edraki & Modarres-Sadeghi Reference Seyed-Aghazadeh, Edraki and Modarres-Sadeghi2019).
2. Experimental method
Experiments were conducted in a recirculating water tunnel with a  $1.27\ \textrm {m} \times 0.5\ \textrm {m} \times 0.38\ \textrm {m}$ test section which has a turbulence intensity below 1 % for flow velocities up to 1 m s
 $^{-1}$. Using bubble image velocimetry (BIV), the uniformity of flow was measured to be within 2 %–8 % of the nominal flow velocity, excluding the boundary layer effects (Seyed-Aghazadeh et al. Reference Seyed-Aghazadeh, Carlson and Modarres-Sadeghi2017). A mounting apparatus was constructed which used two planar air bearings to support a lightweight aluminium truss, permitting it to move freely on a level plane (figure 1a). Opposing springs in the CF and IL directions connected the truss to a separate frame attached to the test section. The lengths of the springs were maximized within the confines of the apparatus to minimize the structural coupling in the CF and IL directions. Two non-contacting displacement sensors, fixed to the frame, measured the movement of the truss in the CF and IL directions at 500 Hz. By taking the PSD contents of arbitrary displacements, structural coupling between the CF and IL displacements was found to be negligible, i.e. the frequency contribution of the perpendicular component was approximately 2 % that of the sensor-aligned direction in the CF, and below 3 % in the IL direction (figure 1b). The truss supported a six-axis ATI Nano-17 force transducer which was attached to the bluff body within the test-section through a surface-piercing cylinder. All results in the present work had the inertia of the combined cylinder and attachment load subtracted from the forces recorded by the sensor.

Figure 1. (a) A schematic of the experimental apparatus, with the locations of the measurement devices. The force sensor is attached to the structure directly above the free surface. (b) Normalized power spectral density (PSD) spectra of the structure's free decay oscillations in air to show that the two directions are not coupled through the structure: the magnitude of the IL peak in the CF direction is approximately 2 % of the CF peak, and the magnitude of the CF peak in the IL direction is 3 % of the IL peak.
The bluff bodies considered included a circular cylinder, and a square cross-section prism. For the square prism, the angle of attack,  $\alpha$, is defined as shown in figure 2. The cylinder and the square prism were manufactured from a lightweight ABS plastic using 3-D printing, with a hollow interior, and a diameter of
  $D=2.54$ cm for the circular cylinder and a side of
  $D=1.9$ cm for the square prism. The aspect ratio,
  $L/D$, was 8.5 for the circular cylinder and 17.8 for the square prism. The mass ratio, defined as
  $m^{*} = {m}/{\rho V}$ where
  $m$ is the moving mass,
  $\rho$ the fluid density and
  $V$ the displaced fluid volume, was
  $m^* \approx 2.54$ for the circular cylinder and
  $m^* \approx 4.52$ for the square prism. These mass ratios are relatively close to those of the system used by Zhao et al. (Reference Zhao, Leontini, Lo Jacono and Sheridan2014) in their study on a 1DOF square prism in flow. Williamson & Govardhan (Reference Williamson and Govardhan2004) showed how increasing the mass ratio decreases the peak amplitude of oscillations as well as the width of the lock-in range for the VIV response of a 1DOF cylinder. These experiments were conducted over a Reynolds number range of
  $Re = 1200$ to 7500 for the cylinder, and
  $Re = 1000$ to 4300 for the prism. The natural frequencies in the CF and IL directions were calculated based on decay tests in water and they were found to be
  $f_{N_{CF}}=0.6$ and
  $f_{n_{IL}}=1.2$ Hz for the cylinder, and
  $f_{N_{CF}}=0.65$ and
  $f_{n_{IL}}=1.3$ Hz for the prism. Decay tests in air were also conducted to calculate the structural damping ratios in the CF and IL directions as
  $\zeta _{CF}=0.0038$ and
  $\zeta _{IL}=0.0035$, respectively.

Figure 2. The sides and edges of a square prism placed in flow, as well as the definition of the angle of attack,  $\alpha$.
For flow visualization, a 50  $\mathrm {\mu }$m platinum wire was mounted at the midplane of the test section, crossing 3 cm upstream from the bluff body. A 50 volt, 2 amp power supply connected the platinum wire to two carbon plates below the wire, and the voltage potential between the platinum and carbon created a stream of hydrogen bubbles of similar scale to the wire diameter via hydrolysis. The bubble field was illuminated by two light-emitting diode lighting banks for imaging by a high-speed Phantom Miro M310 camera (
 $1280 \times 800$ pixels operating at 120 frames per second). The flow field was quantified using BIV with the hydrogen bubbles as tracing elements. This process is described in Currier & Modarres-Sadeghi (Reference Currier and Modarres-Sadeghi2019).
3. Response of a circular cylinder
First, both to validate our experimental set-up and to have a basis for comparison, we conducted a series of experiments to observe VIV in a uniform cylinder with  ${f_{n_{IL}} = 2 \times f_{n_{CF}}}$, where
  $f_{n_{IL}}$ and
  $f_{n_{CF}}=f_n$ are the natural frequencies in otherwise still fluid, in the IL and CF directions, respectively. In figure 3 the oscillation trajectories, the amplitudes in the CF and IL directions (defined as
  $A^*_{CF}=A_{CF}/D$,
  $A^*_{IL}=A_{IL}/D$, respectively, where
  $A_{CF}$ and
  $A_{IL}$ are calculated based on
  $\sqrt {2}$ times of the root mean square (r.m.s.) of the displacement time histories in their respective directions), the CF–IL phase angles, the ratio of the amplitude of oscillations in the IL direction to the amplitude of oscillations in the CF direction
  $(A_{IL}/A_{CF}$), and the frequency contents of the CF and IL forces (defined as the peak frequency of the force in the CF or IL direction normalized by
  $f_n$) are shown for all reduced velocities (defined as
  $U^*=U/f_{n}D$) tested. The wake is shown for sample reduced velocities in figure 4.

Figure 3. The response of a cylinder free to oscillate in the CF and IL directions: (a) the trajectory of the response, where the red colour represents that the cylinder moves upstream at the extremes of its CF oscillations (CCW); (b) the CF and IL amplitudes of the response; (c) the phase difference between the CF and IL displacements defined based on assuming  $y_{CF} = y_{0} \sin (\omega t)$ and
  $x_{IL} = x_{0} \sin (2\omega t + \phi )$; (d) the ratio of the amplitude of the IL oscillations and the amplitude of the CF oscillations; (e) force frequency contents in the CF and (f) IL directions.

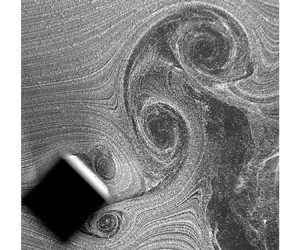
Figure 4. Cylinder's wake (a) at the beginning of oscillations, where IL lock-in is expected and symmetric shedding is observed, (b) within the first IL lock-in range, where IL amplitude is larger than the CF amplitude, and symmetric shedding is observed, (c) toward the end of the IL lock-in, where a figure-eight response is emerging, while the shedding is still symmetric, (d) during the dual IL and CF lock-in, where slight influence of the symmetric shedding of a pure IL response can be observed in the form of smaller vortices in an asymmetric pair of vortices shed in each cycle, (e) during the dual IL and CF lock-in, where the asymmetric shedding due to CF oscillations dominates the wake and (f) within the CF-induced lock-in.
Oscillations start at  ${\it U^*} \approx$ 3.6 with very small amplitudes of around
  $0.01D$. These amplitudes are not visible in the amplitude plot of figure 3, but their existence can be verified by observing the wake at this reduced velocity (figure 4a). During each cycle of oscillations two vortices are shed simultaneously from the two sides of the cylinder. For a cylinder fixed in flow, a von Kármán vortex street is expected, in which asymmetric vortex shedding is observed. If the cylinder oscillates mainly in the CF direction, then a 2S (two single vortices shed per cycle of oscillations, one after the other) is expected. However, here two symmetric vortices are shed simultaneously from the two sides of the cylinder. This type of symmetric shedding has been observed before for VIV in the IL direction, when oscillations exist only in the IL direction (Cagney & Balabani Reference Cagney and Balabani2014; Gurian, Currier & Modarres-Sadeghi Reference Gurian, Currier and Modarres-Sadeghi2019). The presence of these symmetric vortices here confirms that oscillations in the IL direction exist at this reduced velocity. The amplitude of oscillations in the IL direction is very small (less than
  $0.01D$), however, these very small IL oscillations are enough to induce symmetric shedding in the wake. While CF oscillations exist as well, their amplitude is negligible compared with the amplitudes that are observed in the CF direction at higher reduced velocities. In a 1DOF CF system, no oscillation is expected to start before
  $U^* \approx 5$. Note that the reduced velocity of
  $U^*=3.6$ is defined based on the CF frequency. The corresponding reduced velocity defined based on the IL frequency, which is normally used in studies of IL VIV, would be half of that of the CF-frequency-based
  $U^*$, i.e.
  $U^*_{IL}=1.8$. This reduced velocity is within the first range of non-zero-amplitude oscillations for a cylinder in pure IL VIV (Gurian et al. Reference Gurian, Currier and Modarres-Sadeghi2019). According to the IL VIV studies, the first range of oscillations is observed for
  $U^*_{IL}=1.7\text {--}2.5$, which corresponds to
  $U^*=3.4\text {--}5$. In the present experiments, we do observe mainly IL oscillations for this range of reduced velocities (note the
  $A_{IL}/A_{CF}$ ratios in this range in figure 3d), which results in the shedding of symmetric vortices in the wake. Jauvtis & Williamson (Reference Jauvtis and Williamson2004) have also observed this symmetric shedding at the onset of the 2DOF VIV response within a similar range of reduced velocities. The CF oscillations that are observed in the range where a symmetric shedding exists have also been observed previously by Jauvtis & Williamson (Reference Jauvtis and Williamson2004). Similar to what we have observed here, in that range they had observed a smaller CF amplitude than the IL amplitude. The small CF oscillations exist only as a result of the presence of a CF degree of freedom and are triggered by the slightest asymmetry in the incoming flow. However, the oscillations in this range of reduced velocities remain mainly in the IL direction, and the mainly IL oscillations result in the shedding of symmetric vortices.
Another example of these oscillations (for  $U^*=4$), with larger amplitudes of oscillations, is shown in figure 4(b). These oscillations are mainly in the IL direction with an amplitude of 0.03
 $D$, and some small-amplitude (
 ${\approx }0.01D$) CF oscillations are observed as well. At higher reduced velocities (
 $U^*=4.3$ – figure 4c), while the IL oscillations are still the main observed oscillations, the CF oscillations become more significant, but their magnitude is still approximately half that of the IL oscillations, and the shedding remains symmetric. At this reduced velocity, a figure-eight type trajectory starts to appear in the response of the system. This is the emergence of the figure-eight trajectories that have been observed extensively in the past in the VIV response of a 2DOF cylinder (e.g. Jauvtis & Williamson Reference Jauvtis and Williamson2004; Dahl et al. Reference Dahl, Hover and Triantafyllou2006, Reference Dahl, Hover and Triantafyllou2007), as a result of the
  $2:1$ frequency ratio between the IL and CF oscillations. The figure-eight at this reduced velocity is a ‘wide’ figure-eight with the IL oscillations dominating the response.
The difference between our case and that of Jauvtis and Williamson is that in our case the ratios between the IL and CF natural frequencies is  $2:1$, while in Jauvtis and Williamson's case the ratio was
  $1:1$. As a result, they had observed a separated lock-in range with symmetric shedding, because resonance had occurred in the IL direction only, however, in our case, since a
  $2:1$ ratio exists between the IL and CF natural frequencies, dual resonance occurs, and the onsets of the CF response due to the CF lock-in and the CF response due to the IL lock-in become very close to each other (theoretically identical) and as a result, the CF response, which is initially smaller than the IL response, grows and becomes larger than the IL amplitude very quickly, by increasing the reduced velocity. The CF synchronization starts at
  $U^*=4.8$, and the CF amplitude grows significantly compared with the lower reduced velocities.
At  $U^*=5$, the figure-eight becomes narrower, resembling more the type of figure-eight that is expected in a typical 2DOF VIV response: with larger CF amplitude than the IL amplitude. The wake at this reduced velocity shows features of both the pure IL and pure CF oscillations: at some instances of oscillations, symmetric shedding in the IL direction appear, but they are influenced by the asymmetric shedding of larger vortices as a result of the large-amplitude CF oscillations. The result is shedding of asymmetric pairs of vortices in the wake, with the larger vortex being the result of the CF oscillations, and the smaller vortex, which trails the large vortex, being the result of the IL oscillations (figure 4d).
The amplitude of the CF oscillations increases rapidly from  $U^*=4.5$ to 5.5, while the amplitude of the IL oscillations increases initially and then decreases (figure 3b). At
  $U^*=5.5$, which is approximately the reduced velocity at which the lock-in is expected to start for a purely CF VIV case, a local maximum is observed in the CF amplitude, followed by a slight decrease in the magnitude, and then another increase, leading to a range of reduced velocities (
 $U^*=8\text {--}13$) for which the CF amplitude remains constant and close to
  $A^*=0.9$. The IL amplitude follows a bell-shaped curve for a range of
  $U^*=5.5\text {--}9$, corresponding to the range where the CF amplitude drops from its first local maximum and then increases again. The range of
  $U^*=5.5\text {--}8$, corresponds to the
  $U^*_{IL}=2.75\text {--}4$. Curiously, this is the range of reduced velocities for which in a purely IL VIV case, a second range of non-zero amplitudes is observed (Gurian et al. Reference Gurian, Currier and Modarres-Sadeghi2019). In this range, for a pure IL VIV case, oscillations of up to 0.05D are observed, together with asymmetric shedding in the wake. The
  $2:1$ ratio between the IL and CF frequencies that we have considered in the present work makes this range of reduced velocities correspond also to the beginning of the expected range of lock-in for a purely CF case. Therefore, in the 2DOF case, for the range that the pure IL VIV would also be expected, the IL amplitude does follow its bell-shaped case and causes fluctuations in the amplitude of the CF oscillations. This is the manifestation of the dual resonance as discussed by Dahl et al. (Reference Dahl, Hover and Triantafyllou2007). In this range of flow velocities, at the beginning of each half-cycle of oscillations, a shear layer is separated from one side of the cylinder. The shear layer bends quickly and forms an attached vortex, which travels with the cylinder to the end of that half-cycle, and is then shed (figure 4e).
After the range of expected IL oscillations in the pure IL case ends ( $U^*=8$), oscillations in the CF are still expected, because
  $U^*=8$ is still in the middle of the expected lock-in range for a pure CF case, and IL oscillations are observed here as a result of the CF synchronization. In a pure IL case, no oscillations would have been observed in this range. The IL oscillations in this range of reduced velocities are with a relatively constant magnitude. The trajectory is still a figure-eight. The wake (figure 4f) is very similar to the wake in the previous range.
At  $U^* = 13.5$, the amplitudes of oscillations in both the CF and IL directions drop significantly. The IL amplitudes become negligible in this range, resulting in vertical trajectories, in the CF direction only. The amplitudes of these CF oscillations continue to decrease with increasing reduced velocity, until these oscillations also approach zero amplitude at
  $U^*=16.3$, and the lock-in range ends.
During the range of reduced velocities where both pure IL and pure CF VIV are expected ( $U^*=5.5\text {--}8$), the trajectory transforms from a figure-eight that is significantly bent to the left (toward the incoming flow) to a straight figure-eight. When the IL oscillations stay constant (for
  $U^*=8\text {--}13$) the figure-eight trajectories stay straight, until they turn into straight lines when the IL oscillations are stopped at
  $U^*=13.5$. The trend of the trajectories that we observe here, moving from a figure-eight mainly bent to the left to a straight figure-eight, and then a vertical line (with negligible IL oscillations) is the same as the trend that Dahl et al. (Reference Dahl, Hover, Triantafyllou and Oakley2010) have observed in the VIV response of a 2DOF cylinder with a
  $1.9:1$ IL to CF frequency ratio – the closest ratio to
  $2:1$ in their experiments. These different ranges of response are also clear in the frequency contents of the CF and IL forces (figure 3e,f). For the range of reduced velocities where oscillations are mainly in the IL direction (
 $3.6 < U^* < 5$), the main peak frequency is observed in the IL direction and at a normalized frequency of around 2. This is then followed by a range where lock-in is observed in both the CF and IL directions (
 $5.5< U^*<8$), where peak frequencies in the CF direction are observed both for the first and the third harmonics, and in the IL direction at two times the fundamental frequency. The maximum contribution of the third harmonic is observed in this range of reduced velocities, where dual resonance (simultaneous lock-in in the CF and IL directions) occurs. When the dual resonance ends, and in the range where the response is ruled by the CF oscillations (
 $8< U^*<13$), while the IL oscillations still exist, the first harmonic in the CF and the second harmonic in the IL directions are observed – the third harmonic component in the CF direction is less significant for this range, although it does exist. The third harmonic component disappears when the IL oscillations become very small in the range of
  $13< U^*<16.3$.
In figure 5, we compare the amplitude of the CF oscillations observed in our experiments with those observed in two previous 2DOF VIV experiments, namely those conducted by Sarpkaya (Reference Sarpkaya1995) and Dahl et al. (Reference Dahl, Hover and Triantafyllou2006). Note that the horizontal axis in the plot of figure 5(a) is  $U^* St$, as also used by Sarpkaya (Reference Sarpkaya1995), where
  $St$ is the Strouhal number, while the horizontal axis in the plot of figure 5(b) is the reduced velocity,
  $U^*$, the way it is defined in the present work and also used by Dahl et al. (Reference Dahl, Hover and Triantafyllou2006). The experiments conducted by Sarpkaya were at a Reynolds number of
  $Re= 35\,000$, and those by Dahl et al. at a Reynolds number range of
  $Re= 11\,000$ to 44 000, while our experiments were conducted over a Reynolds number range of
  $Re = 1000$ to 4300. The mass-damping coefficient was not reported for Sarpkaya's results, and it was
  $m^* \zeta = 0.35$ for Dahl et al. experiments, which was much larger than
  $m^* \zeta = 0.01$ in our experiments. Sarpkaya's experiments were conducted for a ratio of
  $2:1$ between the IL and CF natural frequencies, similar to the ratio used in our experiments, while Dahl et al., used a ratio of
  $1.9$ : 1. Despite these differences in the parameters used in these three sets of experiments, the observed results are comparable in the sense that in all three cases an amplitude of around one diameter has been observed, with two local maxima in the amplitude response. The lock-in range in our experiments is wider than the lock-in range reported by Sarpkaya and Dahl et al., most probably due to the much smaller mass-damping coefficient that we have used in our experiments. Overall, our results are in agreement with what has been observed in the past in studies on VIV of a 2DOF cylinder.

Figure 5. A comparison of the CF amplitude of oscillations measured in the present experiments with those conducted by (a) Sarpkaya (Reference Sarpkaya1995) and (b) Dahl et al. (Reference Dahl, Hover and Triantafyllou2006).
4. Prism response at varying angles of attack
We used the 2DOF set-up discussed in the previous section and conducted a series of experiments on a square prism at various angles of attack. The angle of attack of the square prism was incremented from  $\alpha = 0^{\circ }$ to
  $\alpha = 45^{\circ }$ in steps of
  $5^{\circ }$, plus one intermittent step of
  $2.5^{\circ }$ to capture
  $\alpha = 22.5^{\circ }$. This range covers all possible angles of attack for a square prism. As with the cylinder case, we set the natural frequency of the system in the IL direction to be twice that of the CF direction:
  $f_{nIL} = 2 \times f_{nCF}$.
First, we consider the general response of the square prism for varying angles of attack, and in the following sections, we will discuss more details of different types of response that we have observed. Figure 6 presents trajectories of the square prism response for different angles of attack and over the range of reduced velocities tested here. The complete trajectories are presented in a colour range from yellow to green and phase-averaged representations of the trajectories are given in red or black. The yellow to green colour range represents the ratio of the top 10 % of the response,  $A^*_{10}$, to the r.m.s. amplitude,
  $A^*_{10} / A^*$, thus highlighting the deviation from the mean amplitude that is reported for each trajectory. The phase averaging is conducted via time synchronous averaging, discussed by Bechhoefer & Kingsley (Reference Bechhoefer and Kingsley2009). Cycles are demarcated via local maxima in CF displacement,
  $y/D$, and averaged into
  $f_{s}{\rm \Delta} t$ bins where
  $f_{s}$ is the sampling frequency (500 Hz) and
  ${\rm \Delta} t$ the average time between
  $y/D$ maxima. Trajectories are to scale between the CF direction on the vertical axis and the IL direction on the horizontal axis. In addition, trajectories are coloured by their directionality, with red marking figure-eight trajectories with CCW direction, and black marking single–loop trajectories. No clockwise figure-eight trajectories were observed for any angle of attack or reduced velocity. For larger
  $\alpha$ values (
 $20^{\circ }<\alpha <45^{\circ }$), large-amplitude oscillations are observed for a range of reduced velocities, resembling a lock-in range. For
  $\alpha =45^{\circ }$, CCW figure-eight trajectories are observed for the entire range of oscillations. For other angles of attack in this range (
 $20^{\circ }<\alpha <40^{\circ }$), CCW figure-eight trajectories are observed only at the beginning of the lock-in range, followed by single-loop trajectories (shown in black in the figure), which are the results of a
  $1:1$ frequency ratio between the CF and IL oscillations. For
  $\alpha = 20^{\circ }$, elliptical trajectories are observed at higher reduced velocities. These non-zero amplitude responses at higher reduced velocities are the first signs of the appearance of galloping-type response. The amplitude of these trajectories becomes larger for
  $\alpha = 15^{\circ }$, while the amplitude of VIV response decreases compared with the larger angles of attack. At
  $\alpha = 10^{\circ }$, the VIV response that is observed for larger angles in the range of
  $6 \leq U^* \leq 10$ is not observed anymore, but non-zero amplitude responses at higher reduced velocities, starting at
  $U^* \approx 12$, still exist. For
  $\alpha =0^{\circ }$ and
  $\alpha =5^{\circ }$, the non-zero amplitudes of oscillations are again observed at lower reduced velocities, when a VIV response is expected, although with a much smaller amplitude of oscillations compared with the oscillations observed in the VIV range of the higher angles of attack. The amplitudes of these oscillations increase with increasing reduced velocity, reaching values of up to
  $0.8D$ at the highest reduced velocities tested.

Figure 6. The phase averaged and complete trajectories of the prism at each  $\alpha$ and for different reduced velocities,
  $U^*$. Each phase average is taken over approximately 140 cycles. Samples of the observed trajectories over one cycle of their oscillations are also shown. The complete trajectories are coloured by the ratio of the top 10 % to overall r.m.s. amplitude,
  $A^*_{10} / A^*$, such that deviations from the mean amplitude are highlighted.
Based on the observation of the trajectory plots, it becomes apparent that the prism undergoes VIV for larger angles of attack ( $20^{\circ }<\alpha <45^{\circ }$). When the structure is placed completely symmetric with respect to the incoming flow (
 $\alpha =45^{\circ }$), the observed trajectory is a symmetric figure-eight. As the structure's orientation becomes more asymmetric, the trajectory also becomes more asymmetric and the figure-eight trajectories become teardrop and the
  $2:1$ ratio of oscillation frequencies become
  $1:1$ as the angle of attack becomes smaller and smaller. For
  $\alpha =20^{\circ }$, the last signs of an isolated lock-in range are observed, as well as the first signs of non-negligible oscillations at higher reduced velocities. These oscillations seem to be the first signs of the galloping response that becomes more clearly visible at higher reduced velocities of the lower angles of attack. At
  $\alpha =10^{\circ }$, the amplitude of oscillations within the reduced velocity range where lock-in was observed before becomes negligible, but oscillations at higher reduced velocities still exist, although with very small amplitudes. At the smallest angles of attack of
  $\alpha =5^{\circ }$ and
  $\alpha =0^{\circ }$, once oscillations start, their amplitude keeps increasing with increasing reduced velocity, until it reaches values of around
  $0.8D$ at the maximum reduced velocity tested here. This monotonic increase of the amplitude of oscillations with increasing reduced velocity suggests that the observed response at these higher reduced velocities is indeed galloping.
The amplitude plots of figure 7(a,b) clarify the overall behaviour of the prism. It is clear from figure 7(a) that there is a lock-in range at angles of attack larger than  $\alpha =15^{\circ }$. The width of the lock-in range decreases for smaller angles of attack, and the lock-in range becomes indistinguishable for the angle of attack of
  $\alpha =10^{\circ }$, as the amplitudes of oscillations become very small. For angles of attack of
  $\alpha =20^{\circ }$ down to
  $\alpha =10^{\circ }$, an increase in the IL amplitude of oscillations is observed at higher reduced velocities. This corresponds to the range of reduced velocities where elliptical trajectories are observed. For
  $\alpha =0^{\circ }$ and
  $\alpha =5^{\circ }$, it is clear in the CF amplitude plots that the amplitudes increase monotonically with increasing reduced velocity. For these angles, the amplitudes of oscillations in the IL direction initially increase, and then stay more or less constant for higher reduced velocities. Nemes et al. (Reference Nemes, Zhao, Lo Jacono and Sheridan2012) also observed VIV at larger angles of attack of
  $\alpha =25^{\circ }$ to
  $45^{\circ }$, and galloping at lower angles of attack of
  $\alpha =0^{\circ }$ to
  $7.5^{\circ }$. In between these two regions, they observed a transition region from VIV response to galloping response for
  $\alpha =7.5^{\circ }$ to
  $25^{\circ }$. In this region, Nemes et al. (Reference Nemes, Zhao, Lo Jacono and Sheridan2012) and Zhao et al. (Reference Zhao, Leontini, Lo Jacono and Sheridan2014) observed a range of oscillations in the response of a 1DOF square prism with an amplitude larger than that observed in the VIV response, but at a range of reduced velocities different from those for which VIV was observed, and they referred to it as the ‘higher branch’. In this range, two cycles of vortex shedding occurred during each cycle of oscillations. Zhao et al. (Reference Zhao, Cheng and Zhou2013) also observed this higher branch in their numerical results of VIV of a 2DOF square prism. Later, Zhao et al. (Reference Zhao, Leontini, Jacono and Sheridan2019) found that this higher branch is observed only for mass ratios smaller than 3.5. In the present 2DOF case, we do not observe this large-amplitude response within the transition region, because the mass ratio of our system in this study is 4.52, which is larger than the critical mass ratio reported by Zhao et al. (Reference Zhao, Leontini, Jacono and Sheridan2019), while the mass ratios in systems discussed by Zhao et al. (Reference Zhao, Leontini, Lo Jacono and Sheridan2014) and Zhao et al. (Reference Zhao, Cheng and Zhou2013) were smaller than the critical value. Instead, in the present results, we observe a relatively large amplitude for the IL oscillations in this region, including the highest IL amplitude that we have observed in this system. This suggests that in the transition region, while the CF amplitude decreases and approaches zero, the prism still oscillates in the IL direction.

Figure 7. (a,b) The oscillation amplitudes in the CF and IL directions, (c,d) the r.m.s. values of the CF and IL force coefficients time histories, (e,f) the mean displacement in the CF and IL directions and (d) the ratio of the IL to the CF amplitudes, versus  $U^*$ and
  $\alpha$.
The lock-in range is also visible in the r.m.s. of the CF and IL forces (figure 7c,d). The magnitudes of the fluctuating CF forces increase as the lock-in range starts, they reach a peak value and then decrease and reach zero at the end of the lock-in range. For  $\alpha =10^{\circ }$ and
  $\alpha =15^{\circ }$, where the amplitude of oscillations is very small compared with the other angles of attack, the fluctuating flow forces in the CF and IL directions are very small as well. There is a slight increase in the magnitude of the fluctuating CF and IL forces for
  $\alpha =0^{\circ }$ and
  $\alpha =5^{\circ }$, where galloping is observed, but these values are still much smaller than those observed in the VIV response of the prism, despite larger-amplitude oscillations observed in the galloping response. This is expected in a galloping region, because oscillations are not due to the fluctuating flow forces, but the mean values of the flow forces.
In the CF direction, the mean displacement is negligible for a wide range of  $\alpha$ and
  $U^*$ parameters, however, it becomes relatively large for larger reduced velocities (
 $U^*>10$) in the transition region (figure 7e). In this range, the mean CF displacement reaches values of approximately
  $0.2D$, which is approximately equal to the mean displacement observed in the IL direction for this range. The mean displacement in the IL direction increases monotonically with increasing reduced velocity for all angles of attack (figure 7f). The range with the large CF mean displacement also corresponds to the range for which an elliptical trajectory is observed, and where the IL amplitudes of oscillations are the largest.
Figure 7(g) shows the ratio of the IL amplitude to the CF amplitude for all angles of attack to give a quantitative view of how the IL amplitude compares with the CF amplitude. For higher angles of attack, where figure-eight and teardrop trajectories are observed, the IL amplitude reaches up to 20 % of the CF amplitude. For these angles, and at higher reduced velocities, it seems that the IL amplitude becomes relatively larger, however, this is for the case with negligible oscillations in both directions. The maximum ratio of the IL to the CF amplitude is observed for cases where an elliptical trajectory is observed at higher reduced velocities of  $\alpha = 10^{\circ }$,
  $15^{\circ }$ and
  $20^{\circ }$, reaching values of around 1, as expected for an elliptical trajectory. Again some very large IL to CF amplitude ratios are observed for smaller reduced velocities at
  $\alpha = 0^{\circ }$,
  $5^{\circ }$ and
  $\alpha = 10^{\circ }$, which are for very small amplitudes of oscillations in both directions. At the beginning of the galloping response, i.e. for
  ${U^*=8\text {--}10}$ at
  $\alpha = 0^{\circ }$ and
  $5^{\circ }$, the ratio reaches values of around 40 %.
This pattern of transitioning from a VIV response to a galloping response as the angle of attack is changed can also be identified in the frequency contents of the fluctuating forces that act on the structure (figure 8). For larger angles of attack, where VIV is observed, the peak of the CF force frequency is at  $f^* \approx 1$. The IL force frequency contains two peaks: a larger peak at
  $f^* \approx 2$ and another smaller peak at
  $f^* \approx 1$. This suggests a mainly
  $2:1$ frequency ratio between the IL and CF forces. As the angle of attack is decreased, the passive asymmetry in the system results in a contribution of the first harmonic force in the IL direction for an extended range of reduced velocities. Besides, within the lock-in range, the peak of the first harmonic frequency in the IL forces becomes comparable with the peak of the second harmonic as the angle of attack is decreased, suggesting a transition from a figure-eight trajectory to a teardrop trajectory. For angles of attack of
  $\alpha \leq 20$, the peak of the first harmonic force frequency in the CF direction is at a normalized frequency of
  $f^*\approx 0.65$ for the entire range of oscillations. The peak frequency in the IL direction, however, is initially at twice that of the CF frequency for
  $U^*<7$, then the peak jumps to four times the CF frequency, for
  $7< U^*<11$ where a four-lobe trajectory is observed in the response of the system, and at higher reduced velocities,
  $U^*>11$, the peak of the IL force frequency goes back to twice the CF frequency.

Figure 8. Spectral contents of the CF and IL force coefficients,  $f_{C_{CF}}$ and
  $f_{C_{IL}}$, of the prism at each angle of attack,
  $\alpha$, and for different reduced velocities,
  $U^*$. Lines representing the estimated shedding frequency from a non-oscillating prism based on the Strouhal law are drawn based on Strouhal values from the averaged literature data set in Gurian & Modarres-Sadeghi (Reference Gurian and Modarres-Sadeghi2021). The top five spectral peaks are shown for each velocity bin as scattered data, with colour scaling with their magnitude, and size scaling with the magnitude relative to the average of the peaks at that reduced velocity bin.
The estimated frequency of vortex shedding from a stationary square prism, placed at various angles of attack, and found following the Strouhal law, is also shown in figure 8 as  $St$ in the CF direction and
  $2St$ in the IL direction. The Strouhal numbers are from Gurian & Modarres-Sadeghi (Reference Gurian and Modarres-Sadeghi2021), where a summary of all Strouhal number measurements from different sources is provided. Based on this summary, the Strouhal number stays more or less constant at around 0.17 for angles of attack larger than 15
 $^\circ$, and decreases almost linearly for smaller angles of attack to 0.12 for 0
 $^\circ$. This suggests an estimated
  $U^*$ for the onset of VIV of approximately 6 for angles of attack larger than 15
 $^\circ$, and increasing linearly to approximately 8 for 0
 $^\circ$. This delay in the onset of oscillations is also observed in the amplitude plots of figure 7(a,b).
To summarize the trends in the CF and IL forces for varying  $\alpha$, three reduced velocities are chosen for investigation:
  $U^{*} = 5.1$, close to the onset of oscillations;
  $U^{*} = 8.2$ close to the peak amplitude response within the lock-in range; and
  $U^{*} = 14.3$ the maximum reduced velocity reported. Each case is shown in figure 9, with the CF force coefficient fast Fourier transform (FFT) on the left and the IL force coefficient FFT on the right. For each reduced velocity, these plots are made by finding the FFTs of the force time histories at each angle of attack and placing them next to each other.

Figure 9. Frequency contents of the CF and IL force coefficients versus the angle of attack, for three values of reduced velocities: (a,b)  $U^*=5.1$; (c,d)
  $U^*=8.2$; (e,f)
  $U^*=14.3$.
For  $U^{*} = 8.2$ (figure 9c,d), the lock-in range is very clear for
  $20^{\circ } < \alpha < 45^{\circ }$ with horizontal lines at the first, second, third and fourth harmonics of the response. It is interesting to observe minimal but existing contributions of even the fourth harmonic in the response. The clear contributions of the higher harmonics disappear for the range of
  $0^{\circ } < \alpha < 20^{\circ }$, where oscillations at this reduced velocity are minimal. Although there are still some contributions of the second harmonics in the IL direction for this range.
At the lower reduced velocity of  $U^{*} = 5.1$ (figure 9a,b), the main observed frequency throughout the angles of attack is the first harmonic frequency. There is a slight increase in the first harmonic frequency for increasing angles of attack, most likely because of the changes in the added mass of the square prism as it experiences very small-amplitude oscillations. Contributions of the second harmonics are observed in the IL direction for larger angles of attack. At these angles of attack, lock-in begins at this reduced velocity,
  $U^{*} = 5.1$, with a figure-eight trajectory.
At the higher reduced velocity of  $U^{*} = 14.3$ (figure 9e,f), it is clear that oscillations occur only for
  $\alpha < 20^{\circ }$. For
  $\alpha = 10\text {--}20^{\circ }$, the elliptical trajectory that is observed in the response results in a
  $1:1$ ratio in the CF–IL forcing frequency. For the range where galloping has been observed,
  $\alpha < 10^{\circ }$, the CF oscillations are at
  $f^*=0.65$, and the IL oscillations are at
  $f^*=2 \times 0.65 = 1.30$. The third harmonic components of the frequency are also observed in the CF oscillations at
  $f^*=3 \times 0.65 = 1.95$.
5. Square prism VIV
For larger alpha values, a distinct lock-in range is observed. Here we consider the case of  $\alpha =45^{\circ }$ (figure 10) as an example of this range of angles of attack. For
  $\alpha =45^{\circ }$, the lock-in range starts at
  $U^* \approx 4$ and extends all the way to
  $U^* \approx 14$. Lock-in starts with oscillations mainly in the CF direction, resulting in vertical trajectories for
  ${4< U^*<5.1}$. This is also clear in the frequency contents of the displacement and fluctuating force, with their main peaks at the first harmonic in this range of reduced velocities. The IL oscillations start at
  $U^*=5.8$, resulting in figure-eight trajectories for a range of
  $5.8< U^*<9.5$. In this range, a strong contribution of the second harmonic is observed in the displacement and fluctuating force frequencies in the IL direction. First harmonic frequencies are also observed in the IL fluctuating force, but they are not the main contributors (their magnitudes are smaller than the second harmonic frequencies). In the same range of reduced velocities, third (and to a lesser degree, second) harmonic components are observed in the CF direction's fluctuating force frequencies. These higher harmonic components had been previously observed to become more visible when CCW figure-eight oscillations are observed in the VIV response of a 2DOF cylinder (Dahl et al. Reference Dahl, Hover and Triantafyllou2006). For higher reduced velocities, again the IL oscillations become negligible and oscillations are mainly in the CF direction for the remainder of the lock-in range. The magnitude of the CF frequencies observed in this range is very small because the amplitude of oscillations is smaller than the rest of the lock-in range.

Figure 10. The VIV of a square prism at  $\alpha = 45^{\circ }$: (a) the response trajectory; (b) the CF and (c) IL amplitudes of oscillations; the frequency of oscillations in (d) the CF and (e) IL directions; and the force frequency contents in (f) the CF and (g) IL directions.
For  $U^*<5.1$, when the oscillations are mainly in the CF direction, 2S vortex shedding is observed in the wake. Figure 11(a) shows a snapshot of the wake at a reduced velocity of
  ${\it U^*} = {\rm 5.1}$, as an example. Movie 1 corresponds to the wake at this reduced velocity. As observed in the movie, when the square prism oscillates upward, a shear layer separates from the edge that leads the transverse motion of the square (edge D). This shear layer then extends along side c and goes beyond edge C, as the prism reaches its maximum amplitude in the upward direction, and is shed in the form of a single vortex, when the prism starts its return cycle. The tip of the shear layer that had passed the downstream edge (edge C) is also cut by the downstream edge, and forms a weak vortex that dissipates in the wake. This process repeats itself in every half-cycle, resulting in shedding of one single vortex from each side over one period of oscillation: a 2S shedding pattern.

Figure 11. The wake of the square prism at  $\alpha =45^{\circ }$ for (a)
  $U^*=5.1$ and (b)
  $U^*=6.9$, exhibiting 2S and 2P sheddings, respectively. See the supplementary movies (movies 1 and 2) available at https://doi.org/10.1017/jfm.2021.352 for movies of the wake at these two reduced velocities.
In the range where the prism follows a figure-eight trajectory, 2P shedding (two pairs of vortices shed in each cycle of oscillations) is observed. An example for  ${\it U^*} = {\rm 6.9}$ is shown in figure 11(b). Movie 2 corresponds to the wake at this reduced velocity. In this case, the shear layer that is separated from edge D, forms a vortex on side c. Then, a second vortex is formed simultaneously as a result of separation of the second shear layer from the other side. This second shear layer separates from edge B, travels all the way along side b, bends around the downstream edge (edge C) and sheds a vortex on side c – the same side from which the first vortex had already been shed, thus trailing it in the wake, and resulting in the formation of a pair of vortices in each half-cycle. Over one complete cycle of oscillations, two pairs of vortices are observed, resulting in a 2P shedding pattern. A 2P shedding is also observed for low-mass ratio cylinders at their peak response amplitudes within the upper branch (Jauvtis & Williamson Reference Jauvtis and Williamson2004; Williamson & Jauvtis Reference Williamson and Jauvtis2004; Dahl et al. Reference Dahl, Hover and Triantafyllou2007).
Figure 12 gives 12 snapshots of the wake of the square prism at  $U^*=6.9$, for which a 2P shedding is observed. From these snapshots, it is clear that when the prism reaches the upper end of its vertical displacement, a pair of vortices of the similar strength is observed in the lower half of the wake (snapshots 4 to 6), and when the prism reaches the lower end of its vertical displacement, a pair of vortices is observed in the upper half of the wake (snapshots 10 to 12). The two pairs of vortices that are observed in one cycle of oscillations are of the same size, indicating a symmetric behaviour of the system. This symmetric behaviour corresponds to the symmetric figure-eight trajectory (symmetric with respect to the horizontal plane that goes through the centre of the square at zero flow velocity) that are observed at this reduced velocity, which is expected from a prism that is placed at a symmetric angle with respect to the incoming flow.

Figure 12. Twelve snapshots of the wake of the square prism at  $\alpha =45^{\circ }$ and
  $U^*=6.9$ during one cycle of oscillations, obtained using the BIV technique, exhibiting the sequence of the 2P shedding in the wake of the prism.
At higher flow velocities, where the trajectories become mainly vertical again and the amplitude of the CF oscillations decreases, again 2S shedding is observed. The wake at this range of reduced velocities is less organized than the initial range where the 2S shedding was observed, mainly because the dimensional flow velocity, and as a result the Reynolds number, are larger for larger reduced velocities.
6. The response for the most asymmetric prism orientation
As the angle of attack decreases from  $\alpha = 45^{\circ }$, the figure-eight trajectories that are observed within the lock-in range become asymmetric teardrop and elliptical trajectories. Here, we consider the case of
  $\alpha =22.5^{\circ }$ as an example for this range.
In figure 13(a), displacement trajectories at  $\alpha =22.5^{\circ }$ are shown for all reduced velocities. The response starts at
  $U^* = 5.8$, and teardrop trajectories are observed (albeit an upside down teardrop!). Initially a small upper lobe is observed in the teardrop trajectories, which makes them resemble a very asymmetric figure-eight. This is also visible in the force frequencies of the response up to a reduced velocity of
  $U^* = 10$, where besides the first harmonic contributions in both the IL and CF directions, due to the mainly single loop, teardrop trajectories, second harmonic frequencies are observed in the IL direction, due to the small upper lobe in the trajectory. This second harmonic contribution decreases and finally disappears at higher reduced velocities, as the upper lobe disappears in the trajectory and a single-loop elliptical trajectory is observed.

Figure 13. The VIV of a square prism at  $\alpha = 22.5^{\circ }$: (a) the response trajectory; (b) the CF and (c) IL amplitudes of oscillations; the frequency of oscillations in (d) the CF and (e) IL directions; and the force frequency contents in (f) the CF and (g) IL directions.
At reduced velocities below lock-in, 2S shedding is observed in which one vortex is shed from each side of the square prism in each cycle. A shear layer separates from edge B, travels along side b and sheds in the wake. This is then followed by a shear layer separating from edge A, travelling along side d and shedding in the wake. A sample is shown in figure 14(a) and movie 3.

Figure 14. The wake of the square prism at  $\alpha = 22.5^{\circ }$: (a) a 2S shedding at
  $U^*=4.5$; (b,c) an asymmetric shedding with two vortices on one side and one on the other side at
  $U^*=5.8$; and (d,e) a pair of vortices resulting in a jet and a
  $1:1$ response frequency at
  $U^*=8.1$. See the supplementary materials (movies 3, 4 and 5) for movies of these three reduced velocities.
As an example of the wake in the lock-in range, at  $U^*=5.8$ (figure 14b,c, and movie 4), as the prism starts its cycle upward, a shear layer is separated from edge B, and is immediately shed in the wake, close to side b. At the same time, a second shear layer is separated from edge A. This shear layer then moves along side d, and as it is still moving on side d, it rolls into a relatively small vortex. This vortex then continues to travel along side d, goes around edge D, and sheds from side c, as the prism starts its return half-cycle, going downward (negative CF) and in the upstream direction (negative IL). During the downward half-cycle, another shear layer is separated from edge B, moves along side b, goes around edge C, and sheds from side c, when the prism reaches its maximum IL amplitude and starts moving downstream. This shedding is very similar to the shedding of the second vortex, but the third vortex is relatively smaller. As a result asymmetric shedding is observed in which two vortices are shed from one side (side c) and one is shed from the other (side b) in one cycle of oscillations.
As an example of the wake for a response with a  $1:1$ frequency ratio, at
  $U^*=8.1$ (figure 14d,e and movie 5), the same three shear layers are observed again. As the prism starts its cycle upward, the first shear layer is separated from edge B and sheds immediately from side b. The shear layer that separates from edge A starts at the beginning of the first half-cycle, rolls into a vortex along side d, bends around edge D and this time sheds very close to edge C, soon after the first vortex is shed, at the beginning of the cycle, resulting in a pair of vortices in the wake. During the return half-cycle, a second shear layer separates from edge A, rolls into a vortex along side d, bends around edge D, and sheds from side c. This vortex is much smaller than the other two vortices that form the pair of vortices, and hard to visualize in many of the cases, because it is washed downstream by the second vortex as it rolls down side c. The overall image of the wake over each cycle is a pair of counter-rotating vortices, the upper one rotating in the clockwise direction, and the lower one in the counterclockwise direction, resulting in a jet that acts at an angle on the square prism, and causes the prism to move in the opposite direction. This shedding mechanism explains the
  $1:1$ ratio of the oscillation frequencies in the IL and CF directions, since the force of this jet acts with the same frequency (the oscillation frequency) in both directions.
Figure 15 represents 12 snapshots of the wake of the square at  $\alpha =22.5^{\circ }$ and
  ${U^*=8.1}$. These snapshots show how a jet is formed in one cycle of oscillations. This jet is clearly observed in snapshots 3 to 5. When the jet is formed, the prism is forced to move upward and downstream. The prism reaches its maximum CF displacement, turns, and starts its downward motion. The small vortex that is shed at the end of the downward motion of the prism is also observed in snapshot 12. This asymmetry in the wake corresponds to the asymmetric, teardrop trajectory that is observed is this case.

Figure 15. Twelve snapshots of the wake of the square prism at  $\alpha =22.5^{\circ }$ and
  $U^*=8.1$ during one cycle of oscillations, obtained using the BIV technique, exhibiting the asymmetric wake that results in a teardrop trajectory.
7. The transition to galloping
For angles of attack of  $\alpha = 15^{\circ }$ and
  $\alpha = 10^{\circ }$, the amplitude of oscillation is much smaller than that for the larger angles of attack. There is a low-amplitude lock-in range for
  $\alpha = 15^\circ$, followed immediately by elliptical trajectories at higher reduced velocities. The lock-in range disappears at
  $\alpha =10^\circ$, and the only observed oscillations are the small-amplitude oscillations at higher reduced velocities. For
  $\alpha =10^\circ$, when oscillations start, their amplitude increases slightly with reduced velocity, but never reaches the same maximum values as the previous angles of attack. While slight increase in the CF and IL amplitudes are observed with increasing reduced velocity, the CF amplitudes stay at values smaller than 0.25D for the entire range of reduced velocities tested. For higher reduced velocities (i.e.
  $U^*>11$) the CF amplitudes occasionally, and for some cycles of oscillations, reach values of even larger than
  $0.5D$. But these relatively large-amplitude cycles are not sustained for more than one or two cycles at a time. These seem to be signs of the development of a permanent high-amplitude galloping response, which will be observed eventually for smaller angles of attack. A sample of these erratic eruptions of relatively large-amplitude responses is shown in figure 16 for the prism at
  $\alpha = 10^{\circ }$ and
  ${\it U^*} = 14$.

Figure 16. A sample case of the response for the prism at  $\alpha = 10^{\circ }$ and
  ${\it U^*} = {\rm 14}$: (a) displacement trajectories; (b,c) time histories of the CF and IL displacements; and (d,e) their corresponding PSD plots.
No repeatable pattern is observed in the shedding of vortices in this range of angles of attack either. Shear layers separate from edges A and B and interact with sides b and d resulting in formation of smaller vortices on the sides b, c and d, but not with a repeatable pattern. And no synchronization between the shedding of these vortices and oscillation frequency of the prism is observed for these angles of attack.
8. The galloping prism
For angles of attack of  $\alpha = 5^{\circ }$ and
  $\alpha = 0^{\circ }$ galloping is observed at higher reduced velocities (figure 7a,b). Figure 17 shows the response of the prism at
  $\alpha =0^{\circ }$. It is clear that the amplitude of oscillations in the CF increases by increasing reduced velocity, starting at a reduced velocity of
  $U^*=5.5$. A region of constant amplitude is observed in the CF response for
  $U^*=6.5\text {--}8.5$. This region could be related to the region of synchronization between the shedding frequency and the oscillation frequency, as is observed in a typical VIV response. Although non-zero IL amplitudes are observed in this range, their magnitude is very small, and the oscillations are mainly in the CF direction. Zhao et al. (Reference Zhao, Leontini, Lo Jacono and Sheridan2014) had observed a similar 1:1 synchronization in the response of a 1DOF square prism placed in flow at zero degrees, and they attributed this synchronization, and the resulting deviation from the typical galloping response, to the observed kink in the amplitude plots of the galloping of a 1DOF prism at zero degrees, reported by Bearman et al. (Reference Bearman, Gartshore, Maull and Parkinson1987). Here, the VIV-like synchronization is observed for a wider range of reduced velocities compared with that reported by Zhao et al. (Reference Zhao, Leontini, Lo Jacono and Sheridan2014), likely due to the existence of the degree of freedom in the IL direction, which typically extends the lock-in ranges of the VIV responses (Dahl et al. Reference Dahl, Hover and Triantafyllou2006).

Figure 17. Galloping of the square prism at  $\alpha =0^{\circ }$: (a) the response trajectories; (b) the CF and (c) IL amplitudes of oscillations, the frequency of oscillations in (d) the CF and (e) IL directions; and the force frequency contents in (f) the CF and (g) IL directions.
Unlike the typical VIV response, which would end at the end of the lock-in range, the amplitude of response of the square prism at  $\alpha = 0^\circ$ continues to increase for higher reduced velocities, indicating that the observed response at these higher reduced velocities is not the VIV response anymore, but galloping. A linear increase in the amplitude of the CF response is observed for
  $U^*=8.5\text {--}12$. This increase in the CF amplitude is accompanied by an initial increase in the IL response up to
  $U^*=10$ followed by a decrease from
  $U^*=10$ to
  $U^*=12$. This range of reduced velocities,
  $U^*=8\text {--}12$, corresponds to large contributions of the force frequencies at two times the fundamental frequency, while the CF forces are mainly at one half of the natural frequency. This makes the ratio between the IL and CF frequencies a
  $4:1$ ratio, resulting in trajectories with four lobes in one cycle of oscillations. In figure 18, a sample trajectory and its corresponding time histories and PSD plots of a case with a four-lobe response are shown. The peak frequencies are at
  $f^* \approx 0.5$ and
  $f^* \approx 2$ for the CF and IL displacements, respectively, which result in a four-lobe trajectory. Sample cases of isolated trajectories clarify the details of the four-lobe response.

Figure 18. A sample case of the response for the prism at  $\alpha =0^{\circ }$ and
  ${\it U^*} = 10$: (a) the displacement trajectories (grey) and select example cycles (coloured); (b,c) sample time histories of the CF and IL displacements; (d,e) PSDs of the CF and IL displacements (dimensionless time
  ${\it t^*} = t f_{nCF}$); and (f–j) an isolated set of the response trajectories from the continuous cycles.
At reduced velocities larger than  $U^*=12$, there is a change in the slope of the increase in the CF amplitude – the rate of its increase decreases, as the IL amplitude continues to increase with reduced velocity (figure 17). A
  $2:1$ ratio between the IL and CF force frequency is observed again. Zhao et al. (Reference Zhao, Leontini, Lo Jacono and Sheridan2014) observed another synchronization (this time
  $3:1$) between the shedding frequency and the oscillation frequency in a similar range of reduced velocities and they related this synchronization to the observed kink (and, therefore, deviation from the typical galloping response) in their measured amplitude plots in a 1DOF system. Here, we also observe a VIV-like synchronization, as the amplitude of response does not increase much in the CF direction and deviates from its linear increase due to galloping. The CF amplitude does not stay constant in this range and increases only slightly, mainly due to the linear increase in the IL amplitude in this range. The increase in the IL amplitude in this range resembles its increase in the galloping range of
  $U^*=8\text {--}10$, and perhaps in this range (
 $U^*=12\text {--}14.5$) too, galloping is the predominant response in the IL direction, since the IL degree of freedom could not synchronize to any shedding frequency in the wake. Then it is this galloping in the IL direction that leads to a slight increase in the CF amplitude during this range of synchronization.
In the wake of the prism, for the lower reduced velocities, two shear layers separate from edges A and B, and create vortices that travel on sides b and d, respectively, act on side c (the downstream side) of the square, and are shed (figure 19a,b and movie 6). As a result, two single vortices are shed during each cycle of oscillations. In the range of  ${\it U^*} = 8\text {--}12$, although the shedding pattern is predominantly similar to the lower reduced velocities (figure 19c,d and movie 7), some symmetric vortices are also observed in the wake during some cycles of the response. These symmetric sheddings are mainly due to the fact that in this range of reduced velocities, a significant IL displacement exists as the prism crosses the midpoint of its CF path. Samples of these two types of shedding in the wake are shown in the BIV results of figures 20 and 21 for
  $\alpha =0^{\circ }$ and
  $U^*=9.4$. In figure 20, snapshots of the wake show how two asymmetric vortices are shed during a portion of one cycle of oscillations, and as a result, the frequency of their shedding is not equal to the frequency of oscillations – a typical feature for a galloping structure. Figure 21 shows snapshots of formation of a symmetric pair of vortices that is shed in the wake during a different portion of the prism's trajectory, when the square travels mainly in the IL direction. At higher reduced velocities, no clear synchronization between the shedding of vortices and the prism oscillations is observed, as expected for galloping structures, in which the shedding of vortices is a result of the presence of the bluff body in flow, and not the cause of oscillations.

Figure 19. The wake of the square prism with  $\alpha =0^{\circ }$ and at (a,b)
  $U^*=5.7$ and (c,d)
  $U^*=9.4$. See the supplementary materials (movies 6 and 7) for movies of these two reduced velocities.

Figure 20. Six snapshots of the wake of the square prism at  $\alpha =0^{\circ }$ and
  $U^*=9.4$ during a part of a cycle of oscillations, obtained using the BIV technique, exhibiting an asymmetric shedding of two vortices in the wake.

Figure 21. Six snapshots of the wake of the square prism at  $\alpha =0^{\circ }$ and
  $U^*=9.4$ during a part of a cycle of oscillations, obtained using the BIV technique, exhibiting symmetric shedding of a pair of vortices in the wake.
9. Conclusions
We have studied the flow-induced response of a square prism free to oscillate in the CF and IL directions and placed at different angles of attack with respect to the incoming flow. We have conducted this study based on a series of experiments in a recirculating water tunnel, in which we measured displacements and flow forces that act on the prism and simultaneously conducted hydrogen bubble flow visualizations, and BIV measurements. We have also presented results for the response of a 2DOF cylinder placed in flow to validate our experimental set-up through comparing our observations for the response of a cylinder with previous studies. For both the cylinder and the square prism, we set a  $2:1$ ratio for the natural frequencies of the structure in the IL and CF directions to enable the system to undergo a dual resonance, i.e. simultaneous synchronizations of the fluctuating flow forces in the CF direction with the CF natural frequency, and the fluctuating flow forces in the IL direction with the IL natural frequency.
We have shown that for larger angles of attack, the prism undergoes VIV, and a lock-in range is observed. When the prism is placed perfectly symmetric with respect to the incoming flow (i.e.  $\alpha =45^\circ$) it follows a figure-eight trajectory within the lock-in range. As the perfect symmetry is lost by placing the prism at angles smaller than
  $\alpha =45^\circ$, the trajectory deviates from a perfect figure-eight to single-loop teardrop trajectory. The wake also changes from the case where 2S and 2P shedding patterns are observed in the wake for a symmetric case, to the case where two vortices are shed from one side and one vortex from the opposite side for
  $\alpha =22.5^\circ$. As the teardrop and elliptical trajectories take over the motion's trajectory, a jet in the wake is observed in a direction inclined to the incoming flow, which results in exerting forces with equal frequencies in both the IL and CF directions. The lock-in range becomes smaller as the angle of attack is decreased. For
  $\alpha =20^\circ$, after the lock-in range, there is a range of no oscillations, followed by a range of small-amplitude oscillations at higher reduced velocities. These oscillations seem to be the beginning of the galloping response that is observed for the smallest angles of attack. Then at
  $\alpha =15^\circ$, there is no gap between the end of the lock-in range and the onset of galloping-type oscillations: the oscillations at higher reduced velocities start immediately after the lock-in range. For the angle of attack of
  $\alpha =10^\circ$, the lock-in range disappears, but the elliptical trajectories are still observed at higher reduced velocities.
For angles of attack of  $\alpha =5^\circ$ and
  $\alpha =0^\circ$, with increasing reduced velocities, oscillations start at some point and they never stop for higher values of reduced velocities. At these angles of attack, VIV is observed for lower reduced velocities, where frequency synchronization between the shedding frequency and the natural frequency of the structure exists. Then, instead of observing amplitudes that go toward zero at the end of the lock-in range, the amplitude of oscillations increases as the galloping response becomes the dominant response of the system. At higher reduced velocities, these galloping responses result in four-lobe trajectories, which are the result of a
  $4:1$ ratio between the IL and CF oscillation frequencies. As the reduced velocities are increased even further, a deviation from the linear increase in the amplitude of response is observed again, which corresponds to another synchronization between the system's natural frequency and the forcing frequency, resulting in another range of figure-eight trajectories with a
  $2:1$ ratio between the IL and CF frequencies.
The wake of the square prism consists mainly of asymmetric shedding of vortices during its VIV response at larger angles of attack and lower reduced velocities. Symmetric shedding, however, is also observed in the wake of the prism during its galloping response at smaller angles of attack and larger reduced velocities, in portions of its trajectory where significant IL oscillations exist. In a series of experiments to study the response of a square prism free to oscillate only in the IL direction, Gurian & Modarres-Sadeghi (Reference Gurian and Modarres-Sadeghi2021) observed symmetric shedding at angles of attack close to zero. Any deviation from zero angle of attack results in deviations from a symmetric shedding in a 1DOF IL square. The symmetric shedding that is observed in the present 2DOF system is also more significant in the galloping response observed at an angle of attack of zero.
Supplementary movies
Supplementary movies are available at https://doi.org/10.1017/jfm.2021.352.
Declaration of interests
The authors report no conflict of interest.


