1 The Problem
Survey respondents reporting on their own behaviors and attitudes informs our understanding of turnout (Wolfinger and Rosenstone Reference Wolfinger and Rosenstone1980), partisanship (Campbell, Miller, and Converse Reference Campbell, Miller and Converse1960) and political activism (Verba, Schlozman, and Brady Reference Verba, Schlozman and Brady1995). But can survey measurements be trusted?
As made explicit in the Total Survey Error framework (Weisberg Reference Weisberg2009), there are several sources of survey bias. For survey measures of political behaviors and attitudes, nonresponse bias, misreporting and survey conditioning may all play a role. Decomposing overall bias into these various sources is vital to understanding what surveys are actually measuring and designing surveys so as to reduce or remove these biases.
From its origins in 1952, the American National Election Study (ANES) has overestimated voter turnout by sizable margins. The difference between the ANES’ survey-based estimate of voter turnout and estimates based on official statistics was 11 points in 1952 and grew reasonably steadily thereafter, reaching 24 points in 1996 (Burden Reference Burden2000, Figure 1).
The ANES overestimate of turnout persisted in 2012. Using official vote tallies and careful counts of eligible voters, McDonald (Reference McDonald2013) reports 2012 voter turnout as 58.2% of the voting-eligible population (VEP) and 53.6% of the voting age population (VAP). The 2012 ANES was administered using two survey modes—in-person interviewing and self-complete, web surveys—yielding self-reported turnout estimates of 71.0% and 73.2%, respectively.Footnote 1
The ANES sampling frame excludes noncitizens, so ANES turnout estimates ought to correspond to the VEP rate rather than the lower voting age population VAP rates. The in-person arm of ANES has a slight degree of undercoverage of the voting-eligible populationFootnote
2
, but this can hardly account for the large discrepancy between the ANES turnout estimate and the estimated VEP rate.Footnote
3
Nor can sampling error be the culprit. ANES sample sizes are large enough to produce 95% credible intervals of about
![]() $\pm 2.6$
percentage points around the turnout point estimate. The only available conclusion is that ANES estimates of turnout are biased upwards by about 13 to 19 percentage points in 2012, a bias of over 10 standard errors.
$\pm 2.6$
percentage points around the turnout point estimate. The only available conclusion is that ANES estimates of turnout are biased upwards by about 13 to 19 percentage points in 2012, a bias of over 10 standard errors.
This bias is troubling given that ANES is a long-standing, well resourced and high quality survey research project. The face-to-face component of ANES utilizes rigorous sampling methods, implemented by teams of highly qualified and experienced sampling statisticians, with field operations conducted by carefully managed, trained personnel. Accordingly, ANES is widely regarded as a benchmark, a near-canonical record of the American electorate. That the world’s “gold standard” election survey (e.g., Aldrich and McGraw Reference Aldrich and McGraw2011) carries such a large and enduring bias with respect to such a fundamental political behavior clearly warrants investigation.
Getting the turnout estimate right is not merely a matter of prestige. As a survey that measures political attitudes in an election year, ANES is used to assess the prevalence of attitudes or characteristics among voters. To understand the differences between Romney and Obama voters, one needs to know who actually turned out to vote for the two candidates. One obvious benchmark is whether the ANES gets the two-party vote share correct. Among self-reported voters choosing Obama or Romney, 53.2% report voting for Obama, 1.2 percentage points above the true result of 52%, or about one standard error. But among validated voters (see Table 2), 51.9% supported Obama.Footnote 4 While this improvement might be due to sampling variability alone, it is an indication that turnout validation might lead to more accurate results with respect to other survey items.
The unusual amount of control and visibility that is built into the administration of the ANES generates data that is typically not gathered in phone or Internet surveys. We use this information in decomposing the ANES overestimate of voter turnout. First, we match ANES respondents and sample households against multiple national databases of registered voters and commercial records.Footnote 5 These databases let us validate respondents’ self-reports of turnout and to compare responder households to nonresponder households, informing our estimate of nonresponse bias. We exploit the random selection of a single respondent in multiple-person households to identify the intent-to-treat effect of being the selected respondent, conditional on living in a rostered household. For the first time, we are able to rigorously estimate the causal effect of being an ANES respondent on voter turnout, long thought to be a possible side effect of taking the survey and contributing to the resulting overestimate of voter turnout.
To our knowledge, no modern research effort has managed to decompose these different sources of turnout bias in a single survey. While the individual components of the bias in the turnout estimate have been estimated by previous studies, it has not been possible to compare their relative magnitudes. Exploiting particular features of the ANES survey design, we separate these distinct sources of bias for the first time.
2 Hypotheses
We investigate the following three determinants of the overestimate of turnout in the 2012 ANES.
2.1 Over-reporting
Social desirability—the tendency of research subjects to present a false or exaggerated self-presentation when asked about socially desirable (or undesirable) attitudes or behaviorsFootnote 6 —leads some respondents to report being registered to vote and turning out to vote when in fact they are not.
Over-reporting is the most studied driver of the ANES overestimate of turnout, facilitated by ANES’ vote validation studies in 1964 (Clausen Reference Clausen1968) and in seven election years between 1976 and 1990, checking respondents’ self-reports of registration and turnout against official reports compiled by state and local election officials; see Traugott (Reference Traugott1989).Footnote 7 Belli, Traugott, and Beckmann (Reference Belli, Traugott and Beckmann2001) pool the ANES vote validation studies, reporting an average over-report of 10.2 percentage points, and an average under-report of 0.7 percentage points. A large literature focuses on the determinants of over-reporting, and how rates of over-reporting vary across demographic groupsFootnote 8 but that variation is not our focus here.
ANES uses question-wording and response options that attempt to reduce the risk of the respondent providing a socially desirable over-report (e.g., Abelson, Loftus, and Greenwald Reference Abelson, Loftus, Greenwald and Tanur1992; Belli et al. Reference Belli, Traugott, Young and McGonagle1999).Footnote 9 In the 2012 ANES, respondents were first asked about their voter registration via a question about the address at which they are registered, with “not currently registered” as one of the response options. Only respondents who report being registered are asked if they voted.Footnote 10
Until recently, vote validation was extremely labor intensive, especially for a survey project with almost complete national coverage like ANES. But the advent of national databases on voter registration and turnout has made it much easier to validate self-reports from survey respondents (Ansolabehere and Hersh Reference Ansolabehere and Hersh2010). Moreover, the responses from the ANES registration battery (e.g., asking for alternate versions of the respondent’s name and place of registration) help us locate respondents in these national databases.
2.2 Nonresponse bias
Although face-to-face ANES 2012 respondents are located and contacted via random sampling, sampled individuals can choose to take the survey or not. Nonresponse bias with respect to voter turnout will arise if respondents (or, compliers, and we use the terms interchangeably) are more likely to turn out than nonrespondents (noncompliers). This is entirely plausible: compliers may well agree to participate in the survey for essentially the same reasons that make them more likely to turn out to vote than noncompliers.Footnote 11
Nonresponse bias can also result from the process by which interviewers are able to find respondents, say, if ease-of-contact with respondents is correlated with registration and turnout. Factors predicting contact include living in easily reached households: e.g., stand alone, single household dwellings are usually easier to reach than apartments; having just one place of residence; working regular hours close to the sampled dwelling or otherwise spending significant periods of time at the sampled dwelling (e.g., retirees), and the number of people residing at the household.Footnote 12 These characteristics tend to describe a population of easier-to-contact surveys responders that is more likely to be registered to vote and to turn out than nonresponders.
In addition, the two-wave, pre/post-election design of the ANES may exacerbate nonresponse bias via sample attrition. The interval between the two interviews gives nonresponse mechanisms a second opportunity to intervene. Attrition from the post-election wave of ANES is well predicted by interest in politics (Olson and Witt Reference Olson and Witt2011), implying that respondents agreeing to the post-election interview are likely to have higher rates of turnout than the full sample.
Clausen’s seminal (Reference Clausen1968) study of the 1964 ANES includes an admittedly imprecise estimate of the effect of nonresponse, restricted to pre-election wave respondents who do not respond to the post-election study. Had they been interviewed, Clausen estimates that post-election nonrespondents would have reported a turnout rate 10 percentage points below the rate of post-election respondents. Brehm (Reference Brehm1993, 135–139) concludes that as much as 18 percentage points of the turnout overestimate in the 1986 ANES study might be due to nonresponse bias. Burden (Reference Burden2000) notes that the gap between ANES turnout estimates and official estimates has grown as ANES response rates have fallen, conjecturing that nonresponse bias is a growing component of the turnout overestimate.
2.3 ANES is a GOTV treatment
Another intriguing possibility is that taking the ANES survey is itself a GOTV treatment, with respondents being stimulated to register and turnout at higher rates than we would have observed otherwise. This “stimulus hypothesis” (Clausen Reference Clausen1968) is part of the folklore of ANES: the (presumably facetious) description of ANES as “the most expensive voter mobilization project in American history” is usually attributed to Warren Miller.
There is some plausibility to this argument. For many respondents, the ANES pre-election in-person interview—well over an hour long—would be the most intense and one-sided conversations about politics they have ever experienced. Stimulating interest in politics and voter turnout could well be an unintended side effect. Hawthorne and interviewer-demand effects are likely at work too (e.g., Persson Reference Persson2014), perhaps particularly given that respondents are told ANES will be seeking a post-election interview.
A line of literature in psychology examines the effect of self-prediction on subsequent behaviors and has spurred GOTV studies (e.g., Greenwald et al. Reference Greenwald, Carnot, Beach and Young1987; Smith, Gerber, and Orlich Reference Smith, Gerber and Orlich2003; Nickerson and Rogers Reference Nickerson and Rogers2010). Green and Gerber (Reference Green and Gerber2008) conclude that in-person canvassing is an especially efficacious GOTV treatment. Thus, given the ANES survey content (many questions about the upcoming election, the candidates, and voting intentions) and the intrusive nature of the ANES in-person interview, we should expect to see participation in the ANES boost turnout.
3 The ANES 2012 in-Person Survey
Our analysis focuses on the face-to-face component of the 2012 ANES.Footnote 13 Completed, in-person interviews were obtained in 2,054 households, or 28.1% of the 7,298 sampled households. All sampled households were mailed an advance letter. An initial screening interview generates a roster of adult, U.S. citizens residing at the household; a respondent is randomly selected for interviewing in households with more than one eligible respondent. The compliance status of sample households varies. Most households generating a refusal refused screening and rostering. In a small fraction of cases the field interviewer recorded that the sampled dwelling was vacant or did not exist. The distinction among these types of refusals is relevant when we estimate the causal effects of study participation, below. Further details on sampling procedures for the in-person arm of the study appear in the Appendix.
Respondents were asked for the name by which they are registered to vote (asked in the pre-election interview and repeated on the post-election interview, if necessary) and critically, the name to whom the respondent incentive payment should be mailed. Virtually all of the ANES face-to-face respondents provided their name or a usable version of it (2,006 out of 2,054), but 48 elected to provide only their initials to the interviewer. In households where no interview was conducted ANES did not acquire names or registration details. Details on the various forms of nonresponse and noncontact appear in the Appendix.
4 Matching Respondents to Voter Files
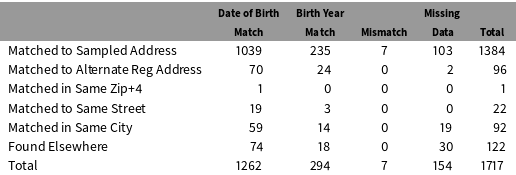
For compliers (respondents), validating self-reports of registration and turnout is greatly facilitated by having their name, a residential address from the USPS CDS file (the sample address), and responses to questions about the name under which they are registered, where they are registered, when they were born and so on. This information from compliers was sent to voter file vendors for matching. Matches were obtained for 1,717 of the 2,054 ANES face-to-face respondents in the databases of these vendors (83.6%), or 1,693 of the 2,006 respondents providing a usable version of their name (84.4%).
Because our voter file vendors have access to all of the voter file records for the country (and in the case of two of the vendors, nonvoter file records from commercial data houses as well), we are able to match ANES respondents even when birthdate or address is mismatched or missing. We summarize the ways that we match the ANES respondents in Table 1. Only cases where the name on the record from our list vendor matches the name the respondent gave to ANES are treated as matches, though rough matches (like matching Kim to Kimberly) are allowed.Footnote 14
In some cases, state voter files only report the age of a voter, but not their complete date of birth. In those cases, we classified a match as a “Birth Year Match” if the age from the voter file was within 2 years of the age implied by the respondent’s self-reported date of birth. Unfortunately, in some cases no age or date of birth information was available either from the respondent or (more commonly) from the voter files. Those cases are reported as missing.
In a surprising number of instances (237 or 11.5% of respondent matches), the respondent was found at an address other than the sampled address or an alternate registration address provided by the respondent. However, we are typically able to verify that the match was correct because of a date of birth match or a birth year match. In cases with missing birth date or year (156 matched cases), we accept the vendor’s match, even in the absence of an address match (50 matched cases). Voter file vendors retain individuals’ address histories (Ansolabehere and Hersh Reference Ansolabehere and Hersh2012); this helps them find respondents at addresses other than the sample address, say, in the case of respondents who move between the ANES interview and before we sent our data to the voter file vendors for matching (the first batch of matches was obtained in March 2013). Another explanation may be old registration records: e.g., if the respondent moved to the sample address without updating their voter registration information and forgot to provide the information to ANES, we might be matching them at an old address.
One final possibility is that ANES field interviewers are conducting interviews with people who do not reside at the sampled address. While we cannot categorically rule out this possibility, the small number of people found at another address but in the same zip+4 (1 respondent) or on the same street (22 respondents) suggests that the ANES rarely interviews neighbors when they cannot get an interview at the sampled address. This phenomenon is not geographically concentrated nor more common at the end of the pre-election field period, which suggests that it is not the result of desperation for completed interviews or a particularly negligent or fraudulent interviewer.
5 Validating Respondents’ Self-Reports of Turnout
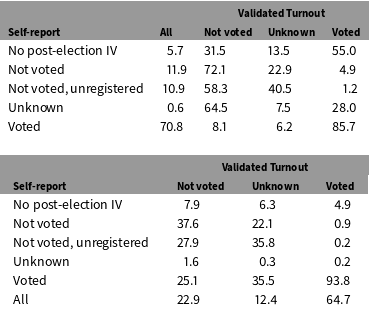
Table 2 shows the distribution of validated turnout conditional on reported turnout (top table) and the distribution of reported turnout conditional on validated turnout (lower table). These estimates are generated with ANES poststratification weights applied, so as to let us interpret these estimates as population estimates and to assess the magnitude of the over-reporting as source of bias in the ANES turnout estimate. Of the 71% of respondents reporting that they turned out, we can validate turnout for 85.2%. Known over-reporters, respondents that claim to have voted when their voter file records show no vote, constitute 8.7% of the 71% claiming to have turned out, or 6.2% of the overall (weighted) data.Footnote 15 For just 6.1% of the 71% of respondents claiming to have voted can we not find a matching record among the voter files.
Table 1. Type of match among ANES 2012 respondents. The name of the voter or commercial record always matches the name given to ANES by the respondent.
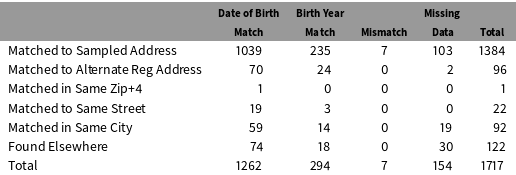
Table 2. Validated turnout (columns) and reported turnout (rows), 2012 U.S. general election, ANES 2012 face-to-face respondents. Weights applied. The top table shows the distribution of validated turnout conditional on reported turnout (the row entries sum to 100, absent rounding error, with the column labeled “All” showing the marginal distribution of the self-reports of turnout). “Unknown” self-reports arise from refusals and “don’t know” responses. The lower table shows the distribution of reported turnout conditional on validated turnout; the columns sum to 100, absent rounding error, with the row labeled “All” showing the marginal distribution of validated turnout.

Most respondents skipping the post-election wave of the study generate missing data with respect to a turnout self-report (top row of Table 2). But over half of these respondents (56.1%) are found to have voted.
We also verify that reports of not voting are generally correct. Respondents reporting not voting (11.8%) and of those not asked about voting (because they reported not being registered, 10.8%) are generally validated nonvoters; we verify this self-report for this group of respondents about two-thirds of the time. In a handful of cases we find a record of the respondent turning out in 2012 when the respondent claims to have not voted: these under-reporters constitute 0.7% of the (weighted) data and comprise just 12 respondents.Footnote 16 Over-reporting is more than twenty times as prevalent as under-reporting. The difference between weighted, verified over-reporting and under-reporting is 6.2–0.7 or 5.5 percentage points, which accounts for a hefty proportion of the ANES overestimate of voter turnout.
Among respondents who we match to a voter registration record, we can validate the corresponding turnout self-report in 93.2% of cases (a weighted percentage). This is similar to the 93.5% rate of “consistent” self-reports of turnout in the subset of the ANES 2008–09 panel study, matched by Berent, Krosnick, and Lupia (Reference Berent, Krosnick and Lupia2016) to voter files in six states.
Overall, the weighted, validated turnout rate for the 2012 ANES face-to-face study is 64.6% (lower right of Table 2), much closer to the VEP estimate of 58.2% reported by McDonald than the self-reported rate of 71%, and not too far from the 61.8% CPS estimate. But the validated turnout rate of 64.6% assumes that all respondents we were unable to match did not turn out. The most likely explanation for a voter failing to match to a voter file is that the respondent is not registered to vote, but a failure to generate accurate identifying data on the part of the survey or state election officials could also be to blame. As Berent, Krosnick, and Lupia (Reference Berent, Krosnick and Lupia2016) highlight, errors in the voter files or in information provided by respondents can cause a failure to match a respondent to their registration record, negatively biasing the validated turnout rate. Since turnout in this group of unmatched respondents is (almost surely) not zero, then the validated turnout rate must be revised upwards. Only 35.5% of this group claims to have turned out and most report either not voting (22.1%) or being unregistered (35.8%), but nonetheless turnout is nonzero for unmatched respondents. The “headline,” weighted, validated turnout rate of 64.6% reported in the lower right of Table 2 is a lower bound on the true, weighted turnout rate of ANES face-to-face respondents, which is probably another 4.3 percentage points higher, or 68.9%.Footnote 17 Relative to the McDonald estimate of 58.2%, this still leaves almost 11 points of bias to be accounted for.
5.1 Validation with stringent matching
As discussed in Table 1, some ANES respondents were matched to a voter file record different from their residential or registration addresses. In Table 2, we treated these respondents as having been validly matched, and proceeded to validate their turnout self-reports against their voter file record. Respondents that could not be matched to a commercial voter file record were treated as unknown.
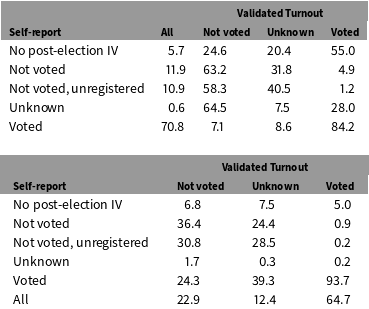
Table 3. Validated turnout (columns) and reported turnout (rows), 2012 U.S. general election, ANES 2012 face-to-face respondents. Weights applied. Respondents that were matched to an address other than their residential or registration address are assigned to the unknown column. The top table shows the distribution of validated turnout conditional on reported turnout (the row entries sum to 100, absent rounding error, with the column labeled “All” showing the marginal distribution of the self-reports of turnout. “Unknown” self-reports arise from refusals and “don’t know” responses. The lower table shows the distribution of reported turnout conditional on validated turnout; the columns sum to 100, absent rounding error, with the row labeled “All” showing the marginal distribution of validated turnout.

In this section, we reproduce Table 2, but this time, we move the 237 respondents that were matched to a different address to the unknown column. This leaves only the address-matched respondents, for whom we are most confident in our match, in the two known validation columns. Table 3 shows that the over-reporting rate decreased modestly, by about 1 percentage point, with those over-reporters moving to the unknown column, while the under-reporting rate remained unchanged.
This change might suggest that the non-address-matched respondents have more false positive matches (since a higher proportion of them have a mismatch between their self-reported and validated turnout behavior). But it could also be the case that respondents that have a more complicated registration status (being registered at an address other than the one at which they live) are more likely to over-report voting. In either case, the over-report rate is still substantial, indicating that over-reporting is a substantial contributor to the overestimate of voter turnout on the 2012 ANES, even among those respondents for whom we have the best voter file match.
6 Nonresponse Bias: Differences between Compliers and Noncompliers
We now consider nonresponse bias, the bias in the ANES turnout estimated induced by higher rates of nonresponse amongst nonvoters. Like voting, participating in the ANES is costly, involving time and disruption of daily routines. ANES tries to mitigate this problem by repeated attempts to make contact with sampled households, offering flexibility with scheduling interviews and offering monetary incentives. Nonetheless, there remain differences in turnout between ANES respondents and noncompliers even on presurvey indicators, such as turnout in previous elections.
For this analysis, we employ records from voter file vendors spanning compliers, people in complier households and people in noncomplying households.Footnote 18
Ideally, one would estimate nonresponse bias by comparing respondents to the individual in nonresponding household who would have been selected to take the survey. Unfortunately, the false listing of individuals on administrative files no longer in residence at an address (“deadwood”) makes it difficult to identify who the hypothetically chosen individual would be. We address this problem by performing our analysis at the level of the address, so that any deadwood records appear in both complier and noncomplier households. Further, we note that there is a slight imbalance in the number of people listed at each address, with an average of 2.2 people per address in noncomplier households and 2.5 people per address in complier households. To correct for this, we run our comparisons on a matched dataset, matching complier households to noncomplier households of the same size, so that the amount of deadwood is roughly the same on both sides of the comparison. We also limit our analysis to households where three or fewer people are listed, so that large households, which are very likely to contain deadwood, are excluded from the analysis. Finally, we exclude cases where an ANES interviewer identified the household as ineligible for an interview.Footnote 19
We compute average rates of voter registration and turnout for even-year, general elections from 2006 through 2012 by household. We limit our analysis to main sample cases (households that were not part of the minority oversamples) because in the minority oversample tracts, noncomplying households may not be black or Hispanic, making them ineligible for the survey.
One concern in this analysis is that differences between complier and noncompliers may be driven by differences in the quality of their administrative records, rather than actual differences in behavior. Ideally, we would limit our analysis to people in noncomplier households who might actually take the survey. But since it is impossible to know who actually lives in a noncomplier household (because in most cases they were not rostered), we settle for using data about the household as it exists on commercial voter files. We use the commercial voter file data for both complier and noncomplier households so that we are balanced with respect to our comparisons. Further, all differences are computed on a subsample that has been balanced on household size, so that the complier and noncomplier groups both have the same distribution of the number of voter file records across households. This balance should reduce or eliminate differences in the number of deadwood records included in the analysis. To account for uncertainty induced by our use of a matching algorithm, we report adjusted standard errors (Abadie and Imbens Reference Abadie and Imbens2006).
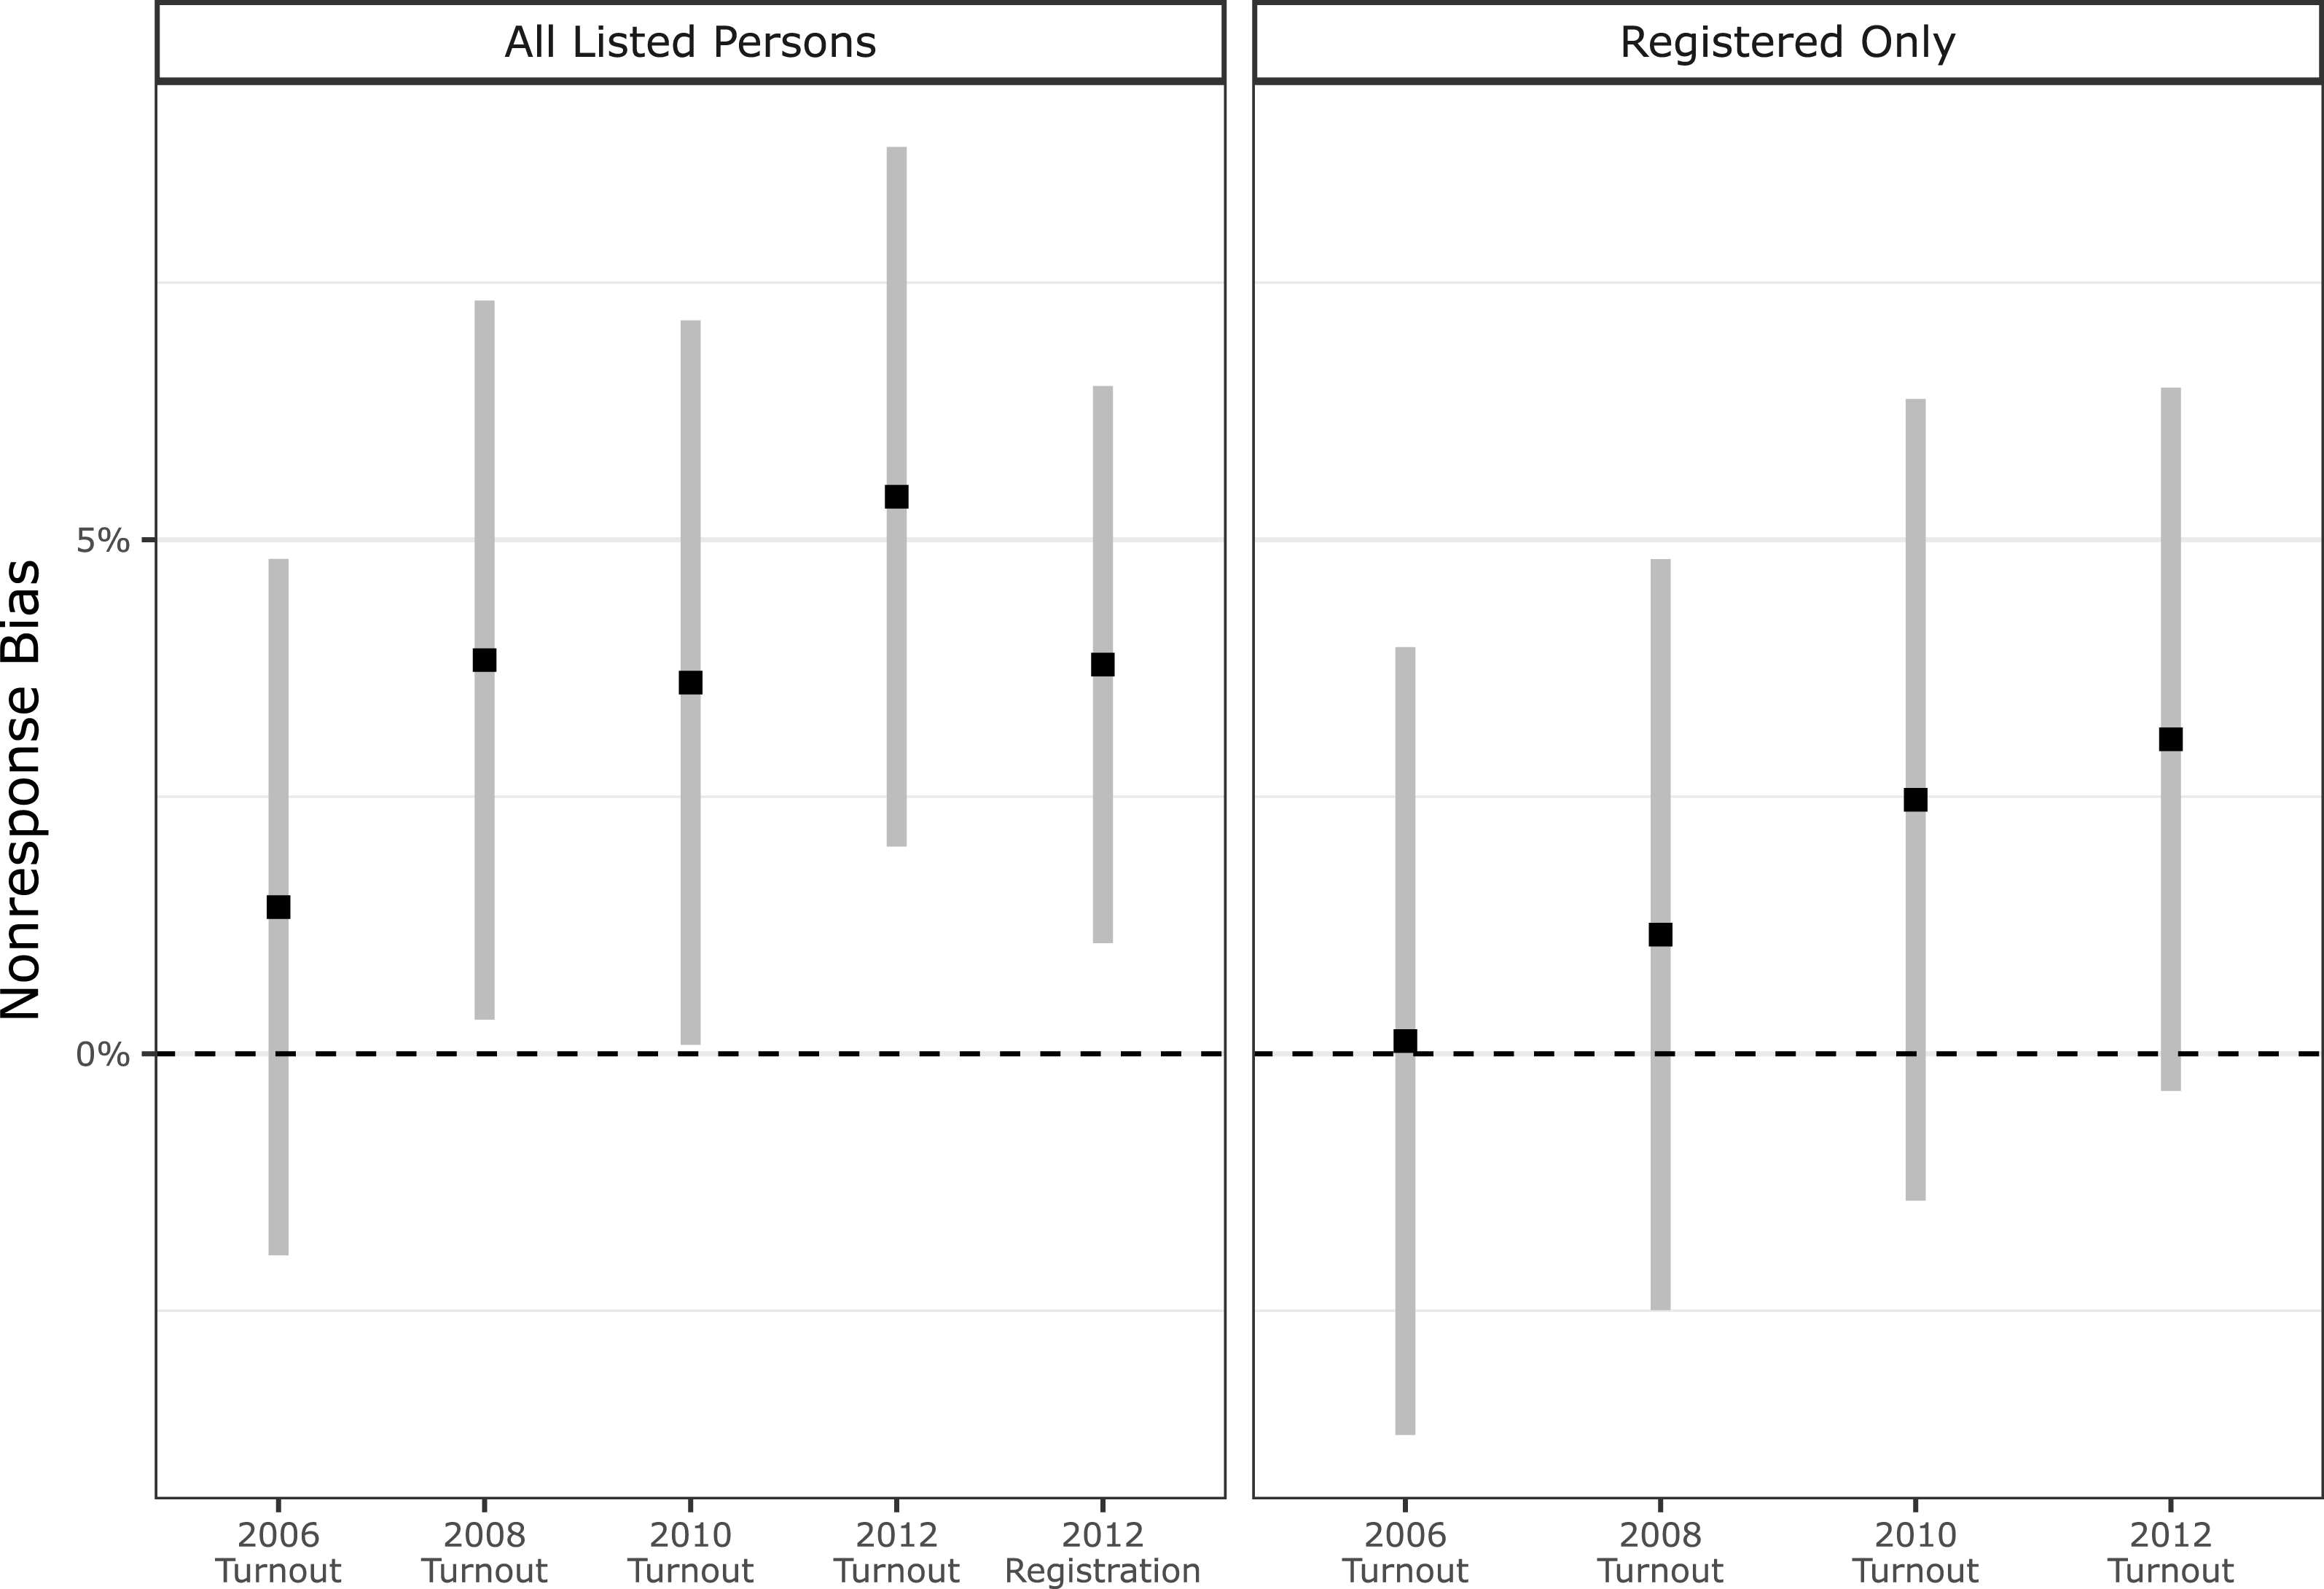
Figure 1 shows that in the two later presurvey elections, 2008 and 2010, complier and noncomplier households show a roughly 3.5 percentage point difference in turnout (distinguishable from zero at conventional levels of statistical significance). Since presidential election turnout patterns will be more similar to each other than to turnout patterns in midterm elections, the 2008 election is our best guide to nonresponse bias in 2012. From this, we infer that the differences in turnout rates absent any 2012-election-specific effects would be about 3.5 percentage points (
![]() $\pm$
3.5 p.p.).
$\pm$
3.5 p.p.).
Moving to the 2012 election, the difference in turnout rates is about 2 percentage points larger in 2012 than in 2008. This difference suggests that additional forces may be driving higher rates of turnout for compliers relative to noncompliers in the 2012 election. One possibility is that compliers are especially interested in the 2012 election, relative to earlier elections. That is, there may be some portion of the complier population that would have voted at noncomplier rates in 2012, were it not for the fact that they were especially stimulated by the 2012 election. Given that both the 2008 and 2012 general elections featured contests between Barack Obama and Republican nominees associated with the establishment wing of the party, it seems unlikely that nearly 2% of compliers could be stimulated relative to 2008 levels of turnout. Instead, the stimulus of the survey itself seems the most likely explanation for the growth in complier turnout.
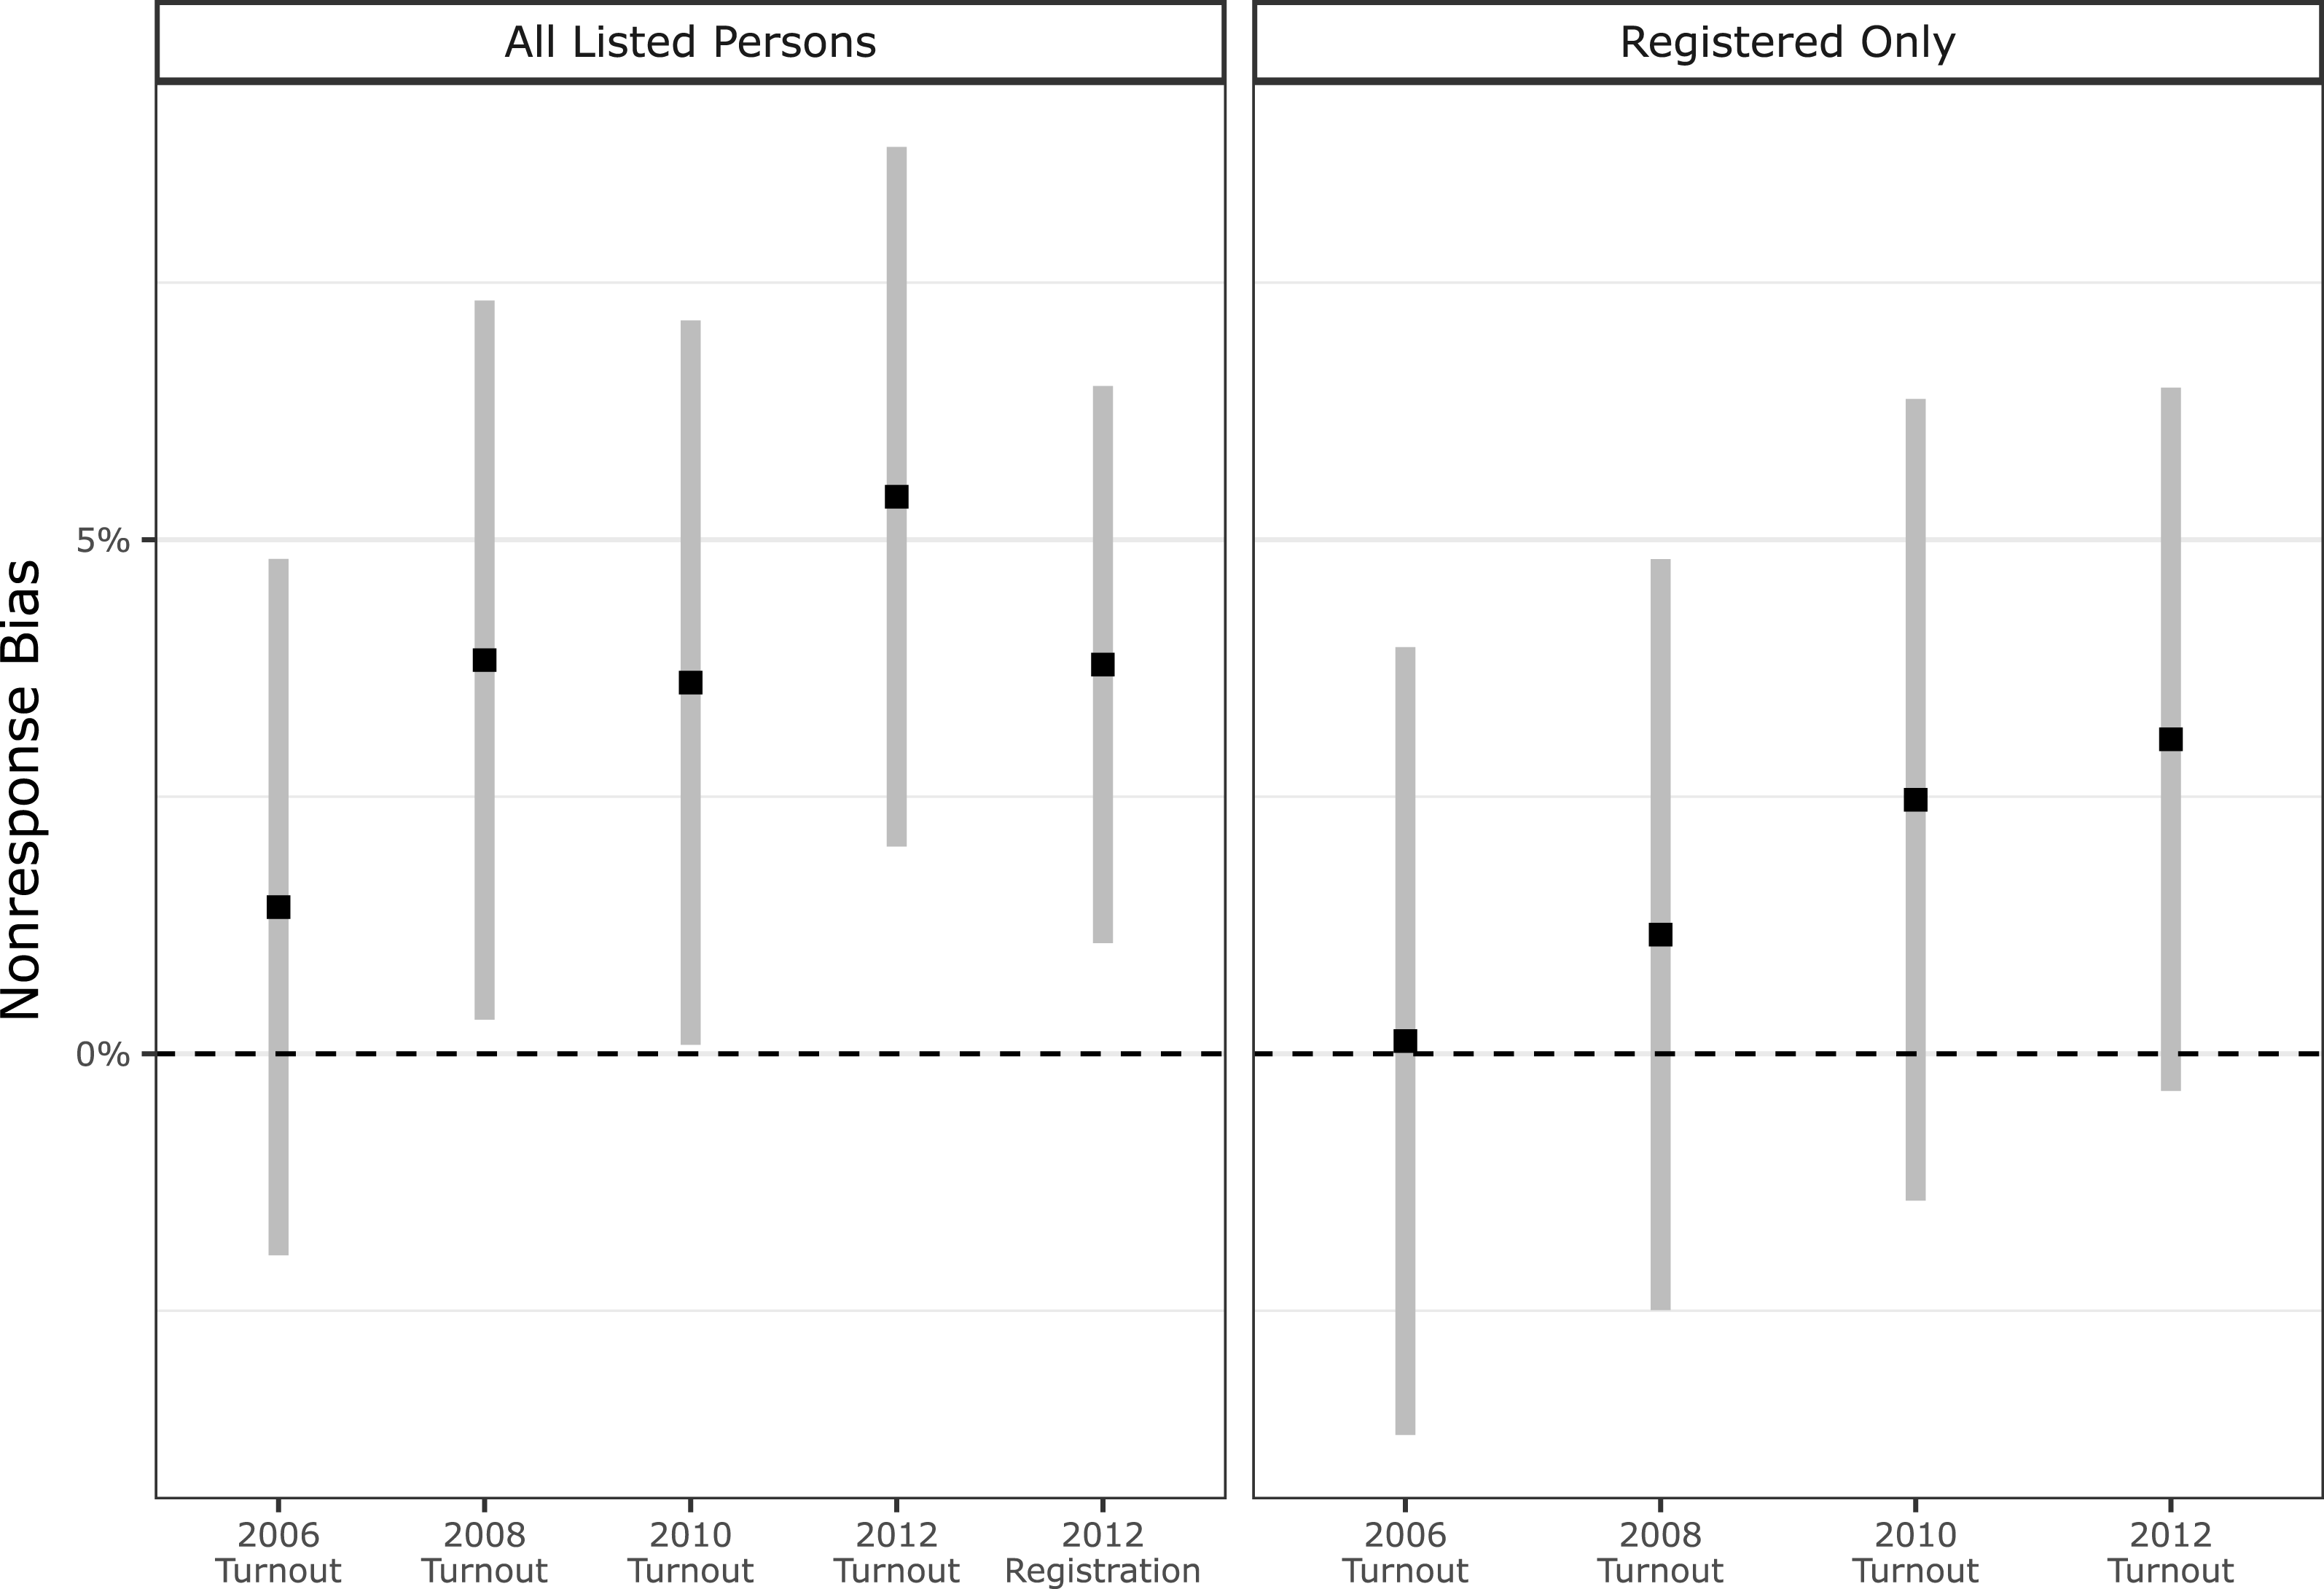
Figure 1. Estimates of the difference in turnout and registration between people in complier households and noncomplier households for main sample cases only. Estimates are also broken out looking at registered voters only. Among registered voters, no statistically significant differences exist in the pretreatment elections. Shaded vertical bars indicate 95% confidence intervals.
How does this nonresponse bias arise? An interesting hint is the 3.5 point difference in registration rates between complying and noncomplying households. This difference suggests that unregistered people are less likely to participate in the survey.
The panel on the right of Figure 1 shows differences in turnout rates in our matched sample conditional on being registered. For pre-2012 elections, there are much smaller differences between the complier and noncomplier groups, with statistically significant differences only manifesting in the 2012 election, where turnout occurred after recruitment by ANES. This suggests that the differences in turnout for earlier elections are largely attributable to a failure to recruit survey takers from the unregistered population.
To summarize, nonresponse bias is responsible for roughly 3.5 percentage points of the bias observed in the ANES estimate of 2012 turnout. A key driver of this bias lies in failing to get enough unregistered people to take the ANES survey. Solutions would include checking the registration status of individuals thought to reside at sampled households ahead of field operations, and tailoring recruitment strategies and field efforts accordingly or stratifying the ANES sample on the registration status of sampled households. As is so often the case with surveys, it is far easier and more elegant to deal with likely sources of bias at the design and sampling stages of the survey, versus engaging in the laborious forensic exercise reported here.
7 The Causal Effect of Survey Participation
We estimate the effect of survey participation on turnout by exploiting the random selection of individuals within sampled households, allowing us to estimate an intent-to-treat effect of taking the ANES survey. Individuals are chosen for an ANES interview in a multistage process, culminating in random within-household selection in households that are successfully rostered and have more than one eligible individual residing at the household (American National Election Studies 2014, 29).Footnote 20 No within-household selection is necessary in households with just one eligible respondent. Interviews were not conducted with any other member of the household. Once a person was randomly selected from within the household, field interviewers were usually successful in completing an interview. Of 2,608 individuals selected for interviewing, 2,054 completed the ANES pre-election interview.
This procedure lets us identify the causal effect of being selected for an ANES interview on turnout, conditional on (a) being in a household with more than one eligible adult citizen and (b) multiple members of the household being found on a commercial voter file. Since the causal effect is estimated by comparing the turnout of a selected member of a household to another member of their same household, the estimated effect is net of any within-household spillovers. If living in a household with a survey respondent makes one more likely to vote, then our treatment effect estimate will be low relative to the overall ANES bias attributable to mobilization.
In rostering sampled households, field interviewers attempt to obtain the names, ages and gender of the household’s adult residents. Matching respondents (who supply a full name and date of birth) are much more straightforward than matching individuals with the extremely limited set of personally identifying information obtained from household rostering. Usually only first names were recorded, but sometimes initials or signifiers like “husband” and “adult male” were reported. Using the list of people known to live at that address from a commercial voter file (as it existed at the start of the survey field period, in early September 2012), we selected the best match for each rostered person. In cases where there was no good match or the match was thought to be unreliable, no match was recorded and the case was discarded. Of the 1,484 enumerated households that contained more than one eligible person, matches to commercial voter files for two or more persons were made in 687 households. 1,510 people were matched, of which 1,448 matched on name, age and address, 31 matched on their initials and address and the remaining 31 cases were matched on their gender and/or age and address.
Not all persons randomly selected for an interview comply. Of the 687 matched, multiple-person households in this analysis, the randomly chosen household member took the survey (the treatment) in 531 households, yielding a compliance rate of 77.3%. In this context, noncompliance (not taking the survey after successful contact, household rostering and within-household random selection) is typically a “hard refusal” (76 households) or the randomly selected household member being “not available” (63 households).
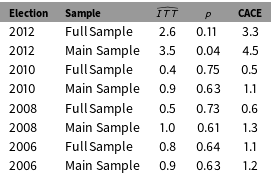
In Table 4, we compare the observed difference in turnout of the sampled individual to that of a different randomly selected person in their household. We compute this difference over 1,000 randomizations of the control householder and compute an average intent-to-treat (
![]() $ITT$
) effect as the average difference in turnout rates between the selected person and the randomly selected control case. Note that in households with only two rostered adults, the same control case is chosen in each iteration. To characterize the null distribution of this procedure, we used the same approach, but this time completely randomizing selection to the survey over 1,000 iterations. In this randomization inference procedure, sometimes the selected person will be chosen as the control case and nonselected individuals will be selected to be the treatment case. We use this null distribution to compute a
$ITT$
) effect as the average difference in turnout rates between the selected person and the randomly selected control case. Note that in households with only two rostered adults, the same control case is chosen in each iteration. To characterize the null distribution of this procedure, we used the same approach, but this time completely randomizing selection to the survey over 1,000 iterations. In this randomization inference procedure, sometimes the selected person will be chosen as the control case and nonselected individuals will be selected to be the treatment case. We use this null distribution to compute a
![]() $p$
-value for the intent-to-treat effect. We also report a complier-average causal effect, which is simply the intent-to-treat effect divided by the compliance rate among householders matched to a voter file. The compliance rate was
$p$
-value for the intent-to-treat effect. We also report a complier-average causal effect, which is simply the intent-to-treat effect divided by the compliance rate among householders matched to a voter file. The compliance rate was
![]() $77\%$
for both the main sample and full sample cases.
$77\%$
for both the main sample and full sample cases.
Table 4. Statistics for each election on both the full sample and main sample only.
![]() $p$
-values refer to the estimated intent-to-treat effects and come from a two-tailed test. The complier-average causal effect (CACE) is merely the intent-to-treat effect divided by the compliance rate, 0.77.
$p$
-values refer to the estimated intent-to-treat effects and come from a two-tailed test. The complier-average causal effect (CACE) is merely the intent-to-treat effect divided by the compliance rate, 0.77.

The estimated treatment effects with respect to 2012 turnout are large. The average treatment effect for compliers is 3.3% for the full set of cases, rising to 4.5% among main sample cases only.
![]() $\widehat{ITT}$
is distinguishable from zero at the 0.05 level for main sample cases; for the full sample, the intent-to-treat effect is significant at the 0.05 level for a one-tailed test only, placing zero weight on the possibility that the survey would have a demobilizing effect. The placebo effects are all close to 0; we fail to reject the null of zero effects in the three placebo elections (
$\widehat{ITT}$
is distinguishable from zero at the 0.05 level for main sample cases; for the full sample, the intent-to-treat effect is significant at the 0.05 level for a one-tailed test only, placing zero weight on the possibility that the survey would have a demobilizing effect. The placebo effects are all close to 0; we fail to reject the null of zero effects in the three placebo elections (
![]() $p=0.84$
for the full sample cases). The observed pattern of treatment effects fits with the assumption that turnout in the placebo/pre-2012 elections is unrelated to selection for an interview. While we are primarily concerned with the treatment effect of taking the survey on all ANES households, it might be more appropriate to analyze only the main sample households, since in the minority oversample tracts, white residents would be ineligible to take the survey while minority residents of the same house would be eligible, confounding our estimate of the treatment effect.
$p=0.84$
for the full sample cases). The observed pattern of treatment effects fits with the assumption that turnout in the placebo/pre-2012 elections is unrelated to selection for an interview. While we are primarily concerned with the treatment effect of taking the survey on all ANES households, it might be more appropriate to analyze only the main sample households, since in the minority oversample tracts, white residents would be ineligible to take the survey while minority residents of the same house would be eligible, confounding our estimate of the treatment effect.
These estimates comport with turnout effects observed in field experiments designed to stimulate mobilization (Arceneaux and Nickerson Reference Arceneaux and Nickerson2009). But, again, what is the nature of the effect? One possibility is that we are observing a classic Hawthorne effect: respondents see that their political behavior is being studied by ANES, and alter their behavior to comply with social norms favoring voting. Another possibility is that respondents feel social pressure from the particular interviewer rather than the study per se. Others might incorrectly believe that turning out is a prerequisite for being eligible for the post-election survey and the accompanying incentive payment. Disambiguating these possibilities will require a design and instrumentation not presently utilized by ANES.
We stress that caution is warranted in accepting the estimates from this within-household analysis. We did not match all enumerated individuals and unmatched individuals are less likely to have voted, because they may not be registered at their current address. However, the direction of the bias that excluding these unmatched individuals induce is ambiguous. Recall that the ITT effect is measured as a difference between the rates of voting for those selected for an interview and those not selected. Excluding unmatched individuals raises our estimate of both voting rates, since the unmatched are less likely to have voted. Since the bias for both quantities is positive and difficult to quantify, the bias of their difference is unknown.
8 Conclusion
Three distinct mechanisms account for the bias in the ANES estimate of turnout: over-reporting, nonresponse bias and treatment effects, summarized in Table 5. Over-reporting is the single largest source of bias in the 2012 ANES face-to-face survey, responsible for 5.5 percentage points of bias in the ANES turnout estimate after accounting for 0.7 percentage points of under-reporting. Nonresponse bias and the treatment effect of taking the survey have smaller but still considerable effects of roughly 3.5 and 4.5 percentage points each. Together, our estimates account for 13 percentage points of bias in the turnout estimate from the 2012 face-to-face components of ANES.
Table 5. This table summarizes our estimates of the three sources of bias in the ANES turnout estimate. Though each of these estimates is subject to uncertainty, the best estimates of each component combine to explain a 13.5 percentage point bias in the ANES turnout estimate, within the expected range of 13 to 17 percentage points.

By estimating these quantities in the same survey, we are able to characterize for the first time how much each source of bias impacts the overall estimate. Happily, the largest source of bias, over-reporting, is also the easiest source of bias to eliminate through better measurement. By matching to voter files, respondents’ self-reports of their turnout behavior can be compared against official records. This comparison makes clear that while the vast majority of respondents correctly report their own behavior, a few report voting when they did not.
There are several, important consequences of the overestimate phenomenon that we do not explore here. For instance, if voter turnout is either over-reported, overestimated due to nonresponse bias, or stimulated by survey participation, then it is quite likely that other political behaviors and attitudes are similarly affected. Examples include voter registration, engagement with candidates and campaigns, political interest and political efficacy. Note that for some of the variables we lack corresponding population benchmarks or microdata that could be used for validating or adjusting respondent self-reports.
While producing decompositions of biases in those measures will be difficult, this paper lays out a guide by which bias decompositions could be computed. Validating self-reports of campaign contact seems particularly promising. Information about campaign contacts has become increasingly centralized by the parties and commercial data warehouses like Catalist (Issenberg Reference Issenberg2012). Thus in principle, validation data should be available. From there, the same set of matching procedures and comparisons could be run, and a decomposition of the bias of self-reported campaign contact could be produced.
Finally, our analysis has implications for the conduct of election surveys. The kind of data collection we have performed, taking sample addresses and respondent information to voter file vendors and using multiple matching methods to identify respondents, should be standard practice and integrated into the design and implementation of surveys, especially public use, canonical election surveys like ANES. Second, we ought to consider sampling designs that use the information on voter files, say stratifying the ANES sample by whether sampled households contain registered or active voters or not, or are of indeterminate status; this was part of the sampling plan for the self-complete/Internet arm of the 2016 ANES. In face-to-face interviewing, field operations and interviewer effort could be more efficiently deployed to ensure that these households yield complete interviews, helping to reduce nonresponse bias (e.g., Czajka Reference Czajka2013).
Supplementary material
For supplementary material accompanying this paper, please visit https://doi.org/10.1017/pan.2018.36.


