Introduction
Recently, Kampf et al. (Reference Kampf, Alves, Kasatkin and Skoda2019) obtained formal approval by the International Mineralogical Association (IMA) Commission on New Minerals, Nomenclature and Classification (CNMNC) for a nomenclature system for jahnsite-group minerals, originally proposed by Moore and Ito (Reference Moore and Ito1978). The general formula for these minerals is XM1(M2)2(M3)2(H2O)8(OH)2(PO4)4, where minerals with M3 = Fe3+ form the jahnsite subgroup and those with M3 = Al3+ form the whiteite subgroup. Within the two subgroups, different species are distinguished by the dominant cations in the X, M1 and M2 sites, represented by a suffix -(XM1M2) in the mineral name. It has been generally observed that the mean sizes of these cations are in the order X > M1 > M2, (Moore and Ito, Reference Moore and Ito1978; Kampf et al., Reference Kampf, Alves, Kasatkin and Skoda2019) and this observation has been used to define and name new species where site assignments cannot be made unambiguously from crystal structure refinements (Grey et al., Reference Grey, Keck, Kampf, MacRae, Cashion and Glenn2020). To date, 12 jahnsite-subgroup members have been officially approved by the IMA but only seven whiteite-subgroup members have been approved. We report here the characterisation of an eighth member of the whiteite subgroup, whiteite-(MnMnMn), from the Foote Lithium Company mine, North Carolina, USA. The mineral and name were approved by the IMA-CNMNC (IMA2021-049, Grey et al., Reference Grey, Smit, Kampf, Mumme, Macrae, Riboldi-Tunnicliffe, Boer and Glenn2021). Four co-type specimens from the Foote mine are housed in the mineralogical collections of the Natural History Museum of Los Angeles County, catalogue numbers 74374, 76149, 76150 and 76151. The specimen number 74374 is also the holotype for jasonsmithite (Kampf et al., Reference Kampf, Celestian and Nash2021).
Occurrence and paragenesis
Whiteite-(MnMnMn) was found by one of the authors (JBS) in small vugs of a float boulder on the East dump of the Foote Lithium Company mine, Kings Mountain district, Cleveland County, North Carolina, USA (35°12’40”N, 81°21’20”W). The boulder had been excavated from an upper, partially oxidised and altered part of the pegmatite, where ground water had penetrated the pegmatite along natural fractures and leached primary and secondary minerals such as fluorapatite and fairfieldite. The diverse suite of tertiary phosphate mineralisation formed in cavities left behind by the leached primary fluorapatite, and along the aforementioned natural fractures. The pegmatite matrix comprises albite, columbite-(Fe), ferrisicklerite, fluorapatite, muscovite, quartz, sphalerite and spodumene. The associated minerals, in order of formation, are eosphorite, hureaulite, fairfieldite, jasonsmithite, mangangordonite and whiteite-(CaMnMn), with whiteite-(MnMnMn) being the last to form. Its common presence as orthogonally oriented laths on whiteite-(CaMnMn), suggests a dissolution/epitaxial recrystallisation paragenesis. The Foote Lithium Company mine is the type locality for 15 other minerals, including jasonsmithite, which was found in the same boulder as whiteite-(MnMnMn) (Kampf et al., Reference Kampf, Celestian and Nash2021).
Physical and optical properties
Whiteite-(MnMnMn) forms sugary aggregates of blade-like crystals (Fig. 1) and epitaxial overgrowths on whiteite-(CaMnMn). The blades are in orthogonal orientation (Fig. 2). They have widths of up to 20 μm, and lengths of up to 100 μm. The blades are flattened on {001} and elongated along [010]. A crystal structure analysis showed the presence of twinning by 180° rotation about [100]. The crystals are colourless to very pale brown, with a white streak. The calculated density is 2.82 g⋅cm–3 for the empirical formula and single-crystal unit-cell volume.
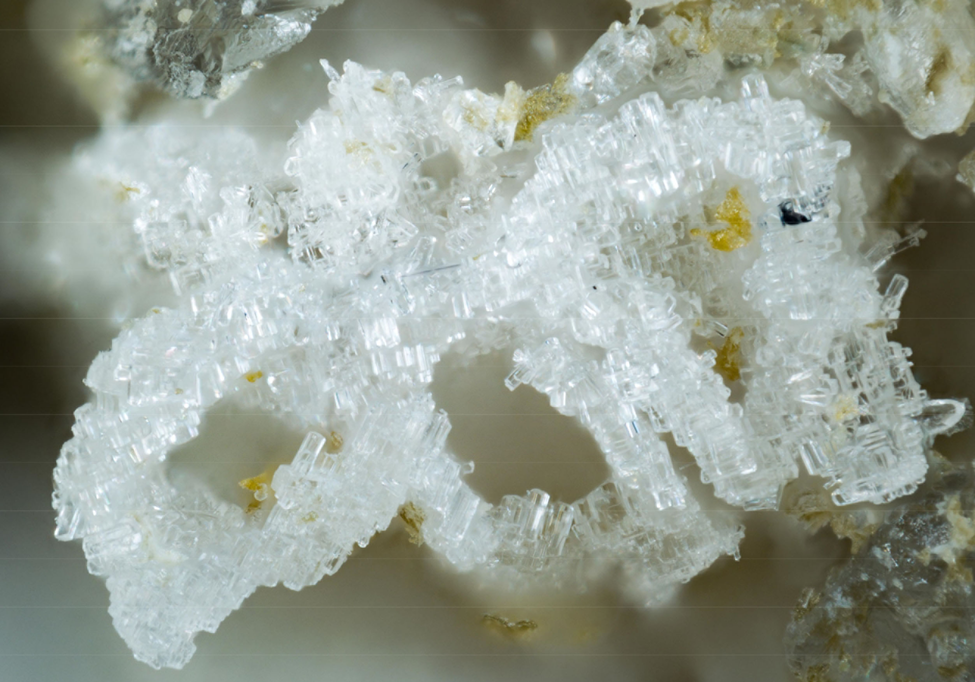
Fig. 1. Whiteite-(MnMnMn) from the Foote mine. Field of view is 1.3 mm. JBS personal collection specimen 7246F.

Fig. 2. Back-scattered electron image of whiteite-(MnMnMn) crystals showing orthogonal orientation. Natural History Museum of Los Angeles County specimen 76151.
Optically, whiteite-(MnMnMn) crystals are biaxial (‒), with α = 1.599(2), β = 1.605(2) and γ = 1.609(2) (white light). The calculated 2V is 78.2°. Dispersion and pleochroism were not observed. The optical orientation is X = b. Because of the very small size of the crystals, conoscopic observation was not possible. Nor was it possible to mount a crystal for extinction measurements. Therefore, 2V could not be measured. A Gladstone–Dale calculation gave a compatibility index of 0.056 (good) based on the empirical formula and the calculated density (Mandarino, Reference Mandarino1981).
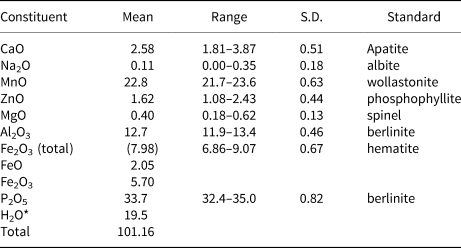
Chemical composition
Crystals of whiteite-(MnMnMn) in the aggregate shown in Fig. 2 were analysed using wavelength-dispersive spectrometry on a JEOL JXA 8500F Hyperprobe operated at an accelerating voltage of 15 kV and a beam current of 2.6 nA. The beam was defocused to 10 μm. Analytical results (average of analyses on 18 crystals) are given in Table 1. There was insufficient material for direct determination of H2O, so it was based upon the crystal structure analysis. The stoichiometric amount of H2O (2 H2O + 0.5 OH per atom of P) was included in the matrix correction.
Table 1. Analytical data (wt.%) for whiteite-(MnMnMn).

*Based on the crystal structure (O = 26)
S.D. – standard deviation
The empirical formula based on 26 O2– anions, with Fe2+/Fe3+ determined from the structure analysis is (Mn2+0.59Ca0.38Na0.03)Σ1.00Mn1.00(Mn2+1.04Fe3+0.58Fe2+0.23Zn0.16Mg0.08)Σ2.09Al2.04(PO4)3.89(OH)3.18(H2O)7.26.
The simplified formula is (Mn,Ca,Na)Mn(Mn,Fe3+,Fe2+,Zn,Mg)Al2(PO4)4(OH)2⋅8H2O. The ideal end-member formula is Mn2+Mn2+Mn2+2Al2(PO4)4(OH)2⋅8H2O, which requires MnO 34.12, Al2O3 12.26, P2O5 34.13, H2O 19.49, total 100 wt.%.
Crystallography
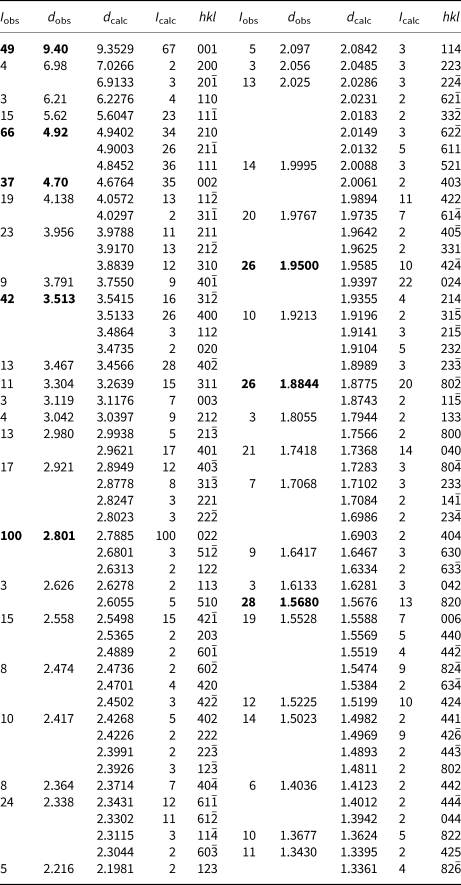
Powder X-ray diffraction data were obtained using a Rigaku R-AXIS Rapid II curved imaging plate microdiffractometer, with monochromatised MoKα radiation. Observed d values and intensities were derived by profile fitting using JADE Pro software (Materials Data inc.) Data (in Å for MoKα) are given in Table 2. Unit cell parameters refined from the powder data using JADE 2010 with whole pattern fitting are a = 15.023(15) Å, b = 6.949(15) Å, c = 10.013(14) Å, β = 110.79(3)° and V = 977(3) Å3, with Z = 2.
Table 2. Powder X-ray diffraction data (d in Å) for whiteite-(MnMnMn). Only calculated lines with I >1.5 are listed.

The strongest lines are given in bold.
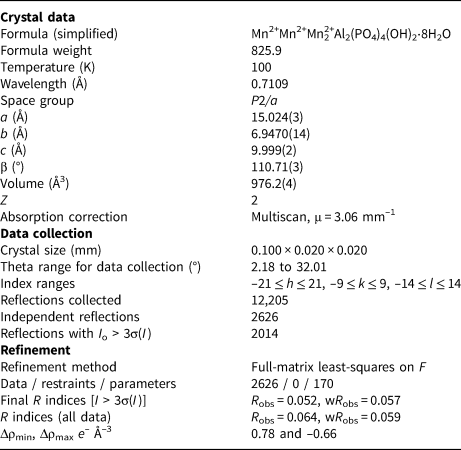
A single-crystal diffraction dataset was collected initially using a laboratory Rigaku Xtal.LAB Synergy diffractometer at the School of Chemistry, University of Melbourne. Although the structure was able to be solved with the laboratory data, the minute size of the whiteite-(MnMnMn) crystals limited the number of observable reflections that could be collected therefore a data collection was carried out subsequently at the Australian Synchrotron, where the higher beam flux resulted in a doubling of the number of observable reflections. Despite the weaker data obtained using the laboratory diffractometer, it is interesting to note that the resulting mean polyhedral bond distances agreed with those obtained using the synchrotron data to within the measured standard deviations.
A blade measuring 0.10 mm × 0.02 mm × 0.02 mm was used for the single-crystal data collection made at the macromolecular beam line MX2 of the Australian Synchrotron (Aragao et al., Reference Aragao, Aishima, Cherukuvada, Clarken, Clift, Cowieson, Ericsson, Gee, Macedo, Mudie, Panjikar, Price, Riboldi-Tunnicliffe, Rostan, Williamson and Caradoc-Davies2018). Data were collected using a Dectris Eiger 16M detector and monochromatic radiation with a wavelength of 0.7109 Å. The crystal was maintained at 100 K in an open-flow nitrogen cryostream. Refined unit cell parameters are given in Table 3.
Table 3. Crystal data and structure refinement for whiteite-(MnMnMn).

The refinement of the crystal structure using JANA2006 (Petříček et al., Reference Petříček, Dušek and Palatinus2014) was initiated using the published coordinates for whiteite-(CaMnMn) (Grey et al., Reference Grey, Mumme, Neville, Wilson and Birch2010). The amount of Ca from the electron microprobe (EMP) analyses was located with Mn in the X site and the Mn scattering curve was used for sites M1, M2A and M2B. Twinning by 180° rotation about a was implemented. Refinement with anisotropic displacement parameters for all atoms converged at wR obs = 0.057 for 2014 reflections with I > 3σ(I). Details of the data collection and refinement are given in Table 3. The refined coordinates, equivalent isotropic displacement parameters and bond valence sum (BVS) values (Gagné and Hawthorne, Reference Gagné and Hawthorne2015) from the single crystal refinement are reported in Table 4. Selected interatomic distances are reported in Table 5. The crystallographic information file has been deposited with the Principal Editor of Mineralogical Magazine and is available as Supplementary material (see below).
Table 4. Atom coordinates, equivalent isotropic displacement parameters (Å2) and bond-valence sums (BVS) for whiteite-(MnMnMn).
Table 5. Polyhedral bond lengths [Å] for whiteite-(MnMnMn).
Although the H atoms were not located during the structure refinement, the BVS in Table 4 show clearly the presence of one hydroxyl, O9, and four independent H2O, O10 to O13.
Discussion
A projection of the structure along [010] is shown in Fig. 3. The interatomic distances in Table 5, and the calculated BVS values in Table 4 are consistent with full occupancy of M1 by Mn2+ and of M3A and M3B by Al, with a mix of 0.4Ca + 0.6 Mn2+ for the X site. Combining these occupancies with the EMP analyses gives a composition for the M2A + M2B sites of (Mn0.99Fe0.78Zn0.15Mg0.08). The BVS values for the M2 sites were used to calculate the oxidation state of the iron, giving the overall composition for M2 as (Mn2+0.99Fe3+0.58Fe2+0.23Zn0.15Mg0.08). With Mn dominant in the X, M1 and M2 sites the ideal end-member formula is Mn2+Mn2+Mn2+2Al2(PO4)4(OH)2⋅8H2O.
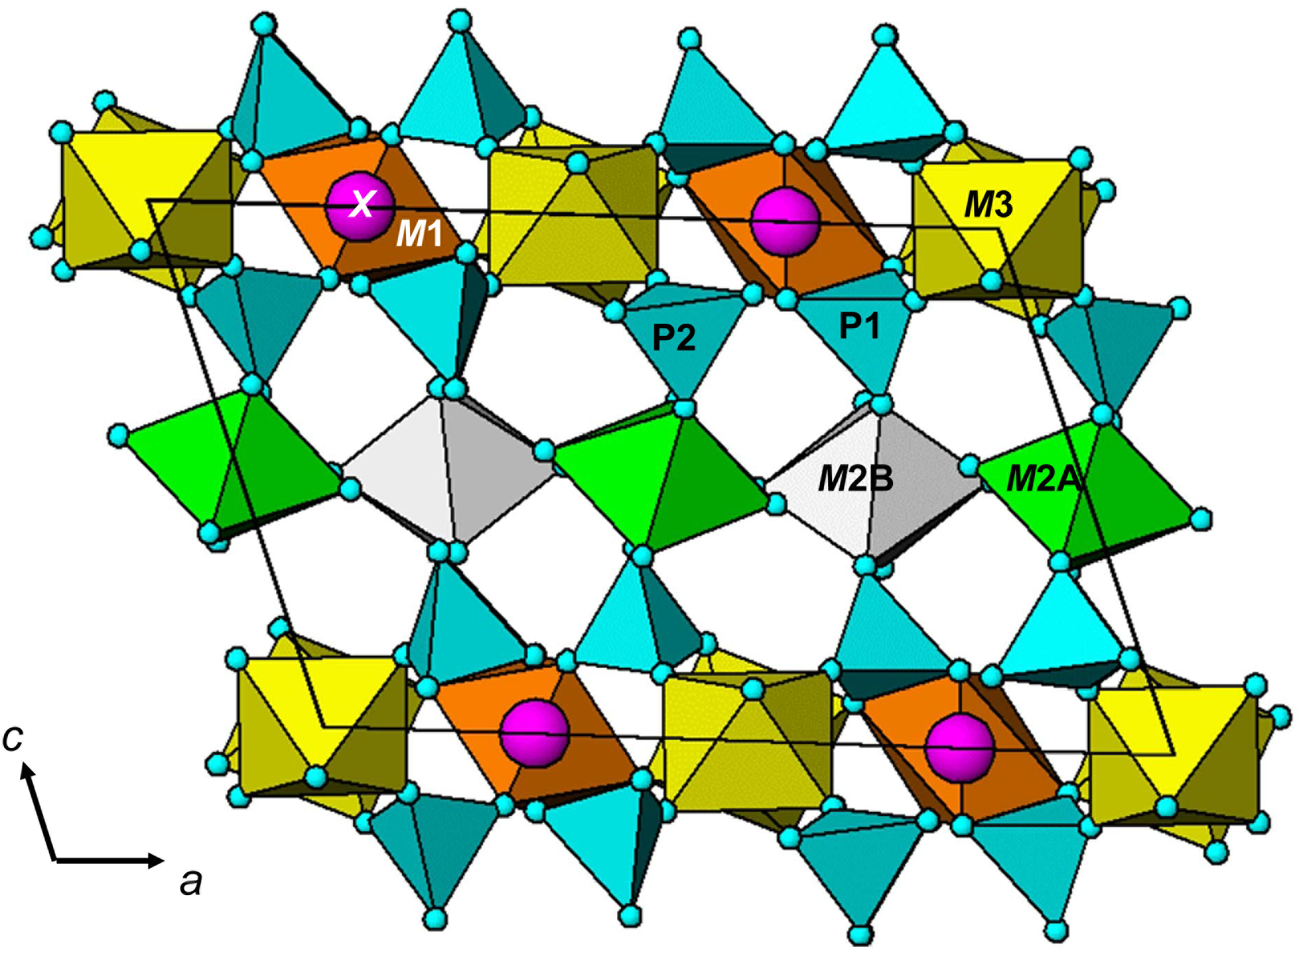
Fig. 3. [010] projection of the structure of whiteite-(MnMnMn) using ATOMS (Dowty, Reference Dowty2006).
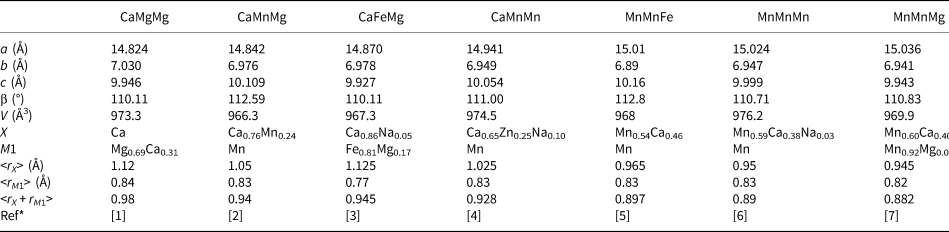
For jahnsite-subgroup minerals, we have reported previously an unusual negative correlation between the mean ionic radius (r) of the X + M1 cations and the unit-cell parameter a (Grey et al., Reference Grey, Keck, Kampf, MacRae, Cashion and Glenn2020). That is, with increasing size of the cations substituting at the X and M1 sites, the unit cell contracts along [100]. We have applied the same procedure to whiteite-subgroup minerals using the data reported in Table 6. The results are plotted in Fig. 4, where they are compared with the previously published results for jahnsite-subgroup minerals. The linear trendlines (R 2 ≈ 0.90) have similar negative slopes for both subgroups, with the line for whiteite-subgroup minerals being displaced to lower a values, reflecting the smaller cations occupying the M3 sites (Al3+ versus Fe3+) that separate the X and M1 cations along [100].
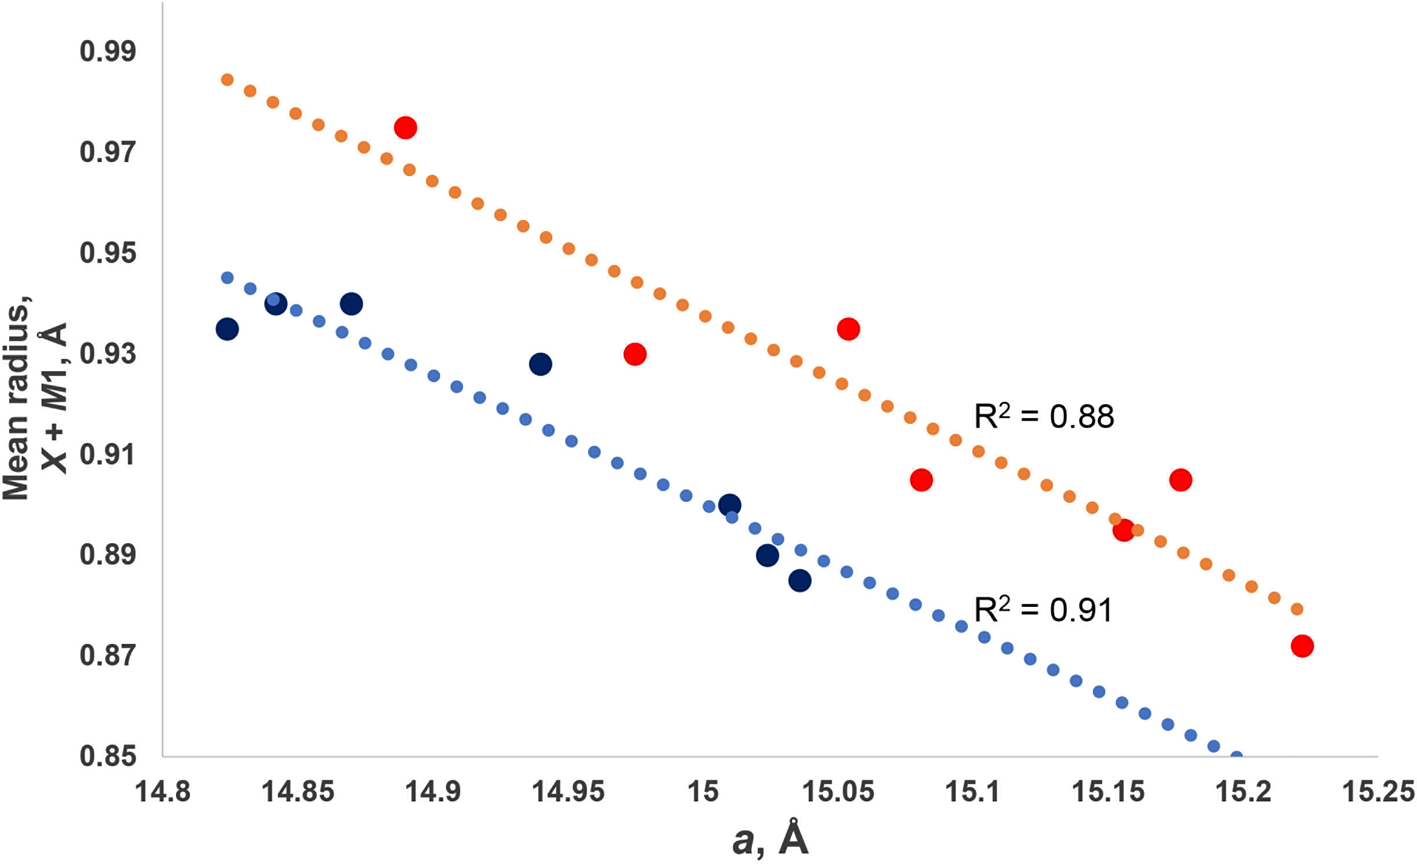
Fig. 4. Plots of mean ionic radius for X + M1 site cations vs. a. The upper plot is for jahnsite-subgroup species (from Grey et al., Reference Grey, Keck, Kampf, MacRae, Cashion and Glenn2020) and lower plot is for whiteite-subgroup species (data in Table 6).
Table 6. Crystallochemical data for whiteite-subgroup minerals.

*[1] Kampf et al. (Reference Kampf, Adams and Nash2016); [2] Grice et al. (Reference Grice, Dunn and Ramik1989); [3] Capitelli et al. (Reference Capitelli, Chita, Cavallo, Bellatreccia and Della Ventura2011); [4] Grey et al. (Reference Grey, Mumme, Neville, Wilson and Birch2010); [5] Marzoni et al. (Reference Marzoni Fecia Di Cossato, Orlandi and Vezzalini1989); [6] this study; [7] Elliott and Willis (Reference Elliott and Willis2019).
The negative correlation between a and <rX + rM 1> was explained in terms of rotations of the M3 centred octahedra about [010] to change the coordination number of the X and M1 cations from 6 for small cations towards 8 for large cations (Grey et al., Reference Grey, Keck, Kampf, MacRae, Cashion and Glenn2020). This is illustrated in Fig. 5, which shows the X and M site cations and associated coordinating polyhedra. For a large cation occupying the X (or M1) site, the M3A-centred octahedra are aligned with their basal edges almost parallel with a, and the X cation is 8-coordinated to 4 octahedral-edge anions (2 × O3 + 2 × O7) and 4 phosphate anions. When a small cation occupies the M1 (or X) site, the M3B-centred octahedra rotate about [010] to shorten bonds to two of the octahedral-edge anions (O4 in Fig. 5b) and lengthen the other pair (O8 in Fig. 5b), resulting in octahedral coordination. The octahedral rotation results in the projected width of the M3 octahedra onto [100] increasing from an octahedral edge distance (=√2 M3–O) for no rotation towards an octahedral body diagonal distance (= 2 M3–O) for 45° rotation. This lengthening of the projected width of the rotated M3 octahedra with decreasing size of M1 (or X) results in the observed increase in a, giving the negative correlation shown in Fig. 4.
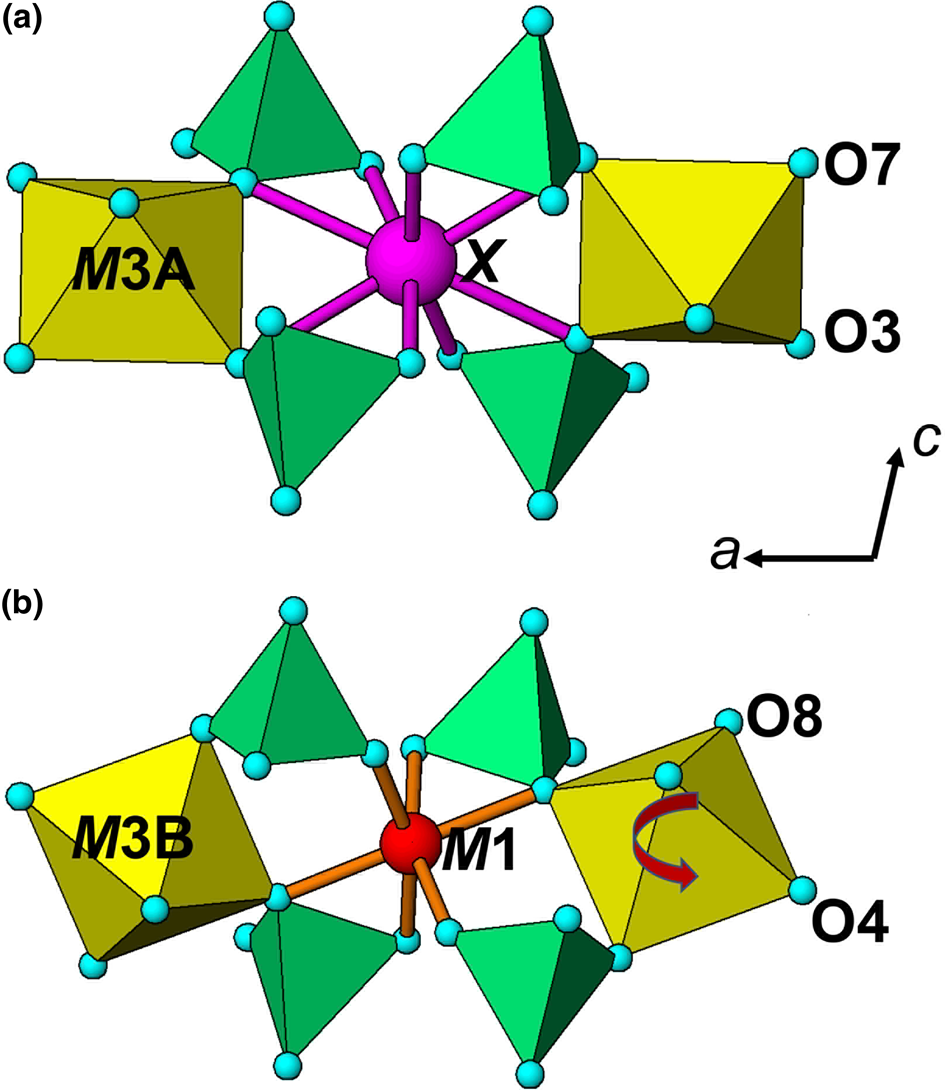
Fig. 5. Coordination environment for (a) the X-site cation, at y = 0 and (b) for the M1-site cation, at y = 0.5.
It is important to note that the octahedra centred at sites M3A and M3B are linked by corner-connection along [010] and can rotate independently. This underpins a wide compositional diversity in jahnsite-group minerals, with cations of disparate sizes occupying the X and M1 sites, and with appropriate rotations of the M3A- and M3B-centred octahedra to meet the coordination requirements of the X and M1 site atoms. The rotations of the two independent M3 octahedra are of opposite sense, and they vary between 0° and 22°. The latter large rotation occurs for M3B in jahnsite-(NaFeMg) to give octahedral coordination about the small cation Fe3+ at the M1 site, while the M3A octahedron rotates only 3° to give square antiprismatic coordination about Na+ at the X site (Kampf et al., Reference Kampf, Steele and Loomis2008).
Of the whiteite-subgroup minerals for which single-crystal site refinements have been published, whiteite-(CaMgMg) has the largest mean ionic radius for the X + M1 sites (Kampf et al., Reference Kampf, Adams and Nash2016). For this mineral, the M3A octahedron is rotated about [010] by ~2°, giving eight Ca–O distances in the range 2.35 to 2.71 Å, whereas the M3B octahedron is rotated by 18°, giving six Mg–O distances in the range 2.09 to 2.22 Å. Whiteite-(MnMnMn) has the M3A octahedron rotated by 8° giving six Mn–O distances for the X site in the range 2.21 to 2.44 Å with two further Mn–O distances much longer at 3.04 Å. The M3B octahedron is rotated by 18°, giving six Mn–O at the M1 site in the range 2.12 to 2.27 Å. The overall greater rotation of M3 octahedra in whiteite-(MnMnMn) compared with whiteite-(CaMgMg) due to smaller mean X plus M1 cations is manifested in an increase in a from 14.824(2) to 15.024(3) Å.
The tendency in jahnsite-group minerals for the coordination number of the X-site cation to increase from six to eight as the size of the X-site cation increases, with a concomitant decrease in the unit-cell size along a is analogous to the effect of applying external pressure. It can be described as a chemical pressure effect. This effect in jahnsite-group minerals is controlled indirectly by the substituting cation size, via the intermediary of M3-centred octahedral rotations, and has an analogue in negative thermal expansion (Grima et al., Reference Grima, Zammit and Gatt2006). In the jahnsite-group minerals, it is increasing cation size, rather than heating, that induces octahedral rotations and brings about anisotropic contraction of the unit cell parameters.
Supplementary material
To view supplementary material for this article, please visit https://doi.org/10.1180/mgm.2021.75
Acknowledgements
This research was undertaken in part using the MX2 beamline at the Australian Synchrotron, part of ANSTO, and made use of the Australian Cancer Research Foundation (ACRF) detector. We thank Cameron Davidson for the preparation of samples for EMP analyses.