


From 2006 to 2015, 2 historic events took place that had a significant impact upon the northeastern United States. In 2008, the United States entered an economic recession, resulting in the loss of 5.5 million jobs and an average increase in annual cost to US households of $5,800.Reference Swagel 1 In 2012, Hurricane Sandy made landfall in the northeast, resulting in damages costing $68.3 billion. 2 Although there has been research on the mental health impact of each event, to our knowledge no research has yet examined their potentially incremental effects on mental health outcomes in people directly impacted by these events in tandem. In the current paper, we address this question by mapping trajectories of depression in older adults living in the northeastern coastal region from before the economic recession to after Hurricane Sandy. We also examine the association of the depression trajectories with the onset of posttraumatic stress disorder (PTSD) symptoms following Sandy and with community, economic, and criminal justice indicators.
Several studies and a systematic reviewReference Frasquilho, Matos and Salonna 3 have highlighted the detrimental effects of economic adversity on psychological distress,Reference McLoyd 4 suicide rates,Reference Reeves, Stuckler and McKee 5 substance misuse,Reference Dee 6 anxiety, and depression.Reference Gili, Roca and Basu 7 The longer-term impacts of economic adversity may also manifest in the form of incremental increases in suicide and alcohol abuse.Reference Stuckler, Basu and Suhrcke 8 Research assessing the impact of natural disasters on people directly experiencing them has highlighted similar mental health deficits. Mass disaster events such as hurricanes have been shown to lead to increased onset of PTSD, anxiety, and depression,Reference Van Griensven, Chakkraband and Thienkrua 9 – Reference Schwartz, Sison and Kerath 15 as well as incremental effects among individuals with a history previous traumatic experiences.Reference Lowe, Sampson and Gruebner 16
Research examining the impact of macroeconomic changes upon health outcomes has suggested that the impact of such events can be best understood through changes in economic indicators, which in turn can lead to increases in crime and negative mental health outcomes over time.Reference Burgard, Ailshire and Kalousova 17 Specifically, researchers have found that macroeconomic changes, such as increases in the number of housing foreclosures, were related to increases in rates of depression among older adults.Reference Cagney, Browning and Iveniuk 18 Additionally, in a nationally representative sample, a rise in the unemployment rate has been implicated in a reduction of health-related quality of life over time.Reference Dávalos and French 19 Research examining the impact of unemployment rates on crime rates, which is often controversial, has indicated a weak but significant relationship between these 2 indicators.Reference Andresen 20 - Reference Raphael and Winter-Ebmer 22
Recent research has demonstrated, however, that the mental health impacts of major life stressors, including natural disasters and personal and structural economic failures, are not uniform across populationsReference Bonanno, Brewin and Kaniasty 10 , Reference Bonanno, Wortman and Lehman 23 - Reference Norris, Tracy and Galea 28 (see reviews by Bonanno et alReference Bonanno, Westphal and Mancini 29 , Reference Bonanno, Romero and Klein 30 ). Rather, by utilizing prospective, population-based samples and latent growth modeling techniques, these studies have identified a number of replicable, longitudinal patterns of adjustment. The majority of people exposed to major stressors show a resilient trajectory characterized by sustained low symptom levels both before and after the stressor event. These studies have also repeatedly identified a significant proportion of individuals that experience a trajectory of enduring symptom elevations following the stressor event,Reference Bonanno 31 which is consistent with results of traditionally designed studies. Intriguingly, a growing number of studies have identified another pattern, characterized by symptom levels that are elevated prior to the stressor event and markedly reduced after the onset of the stressor.Reference Bonanno, Wortman and Lehman 23 , Reference Galatzer-Levy and Bonanno 26 , Reference Burton, Galatzer-Levy and Bonanno 32 - Reference Zhu, Galatzer-Levy and Bonanno 37 Explanations for this counterintuitive pattern have been largely speculative. However, improvement trajectory has recently been linked to increases in social support and interpersonal resources as a result of a high-profile tragedy.Reference Mancini, Bowen and O’Neal 35
The consistency with which these and other outcome trajectories have been observed raises the compelling but unexamined question of what patterns might be revealed as a result of multiple stressor events; more specifically, whether repeated events might produce trajectories that suggest additive mental health impacts over time (eg, incremental increases in symptoms following a second stressor). The available data support this possibility. Recently, among a sample of individuals who experienced multiple life-threatening health stressors (eg, cancer and cardiovascular disease) within a 2-year period, individuals who became depressed following these stressors experienced more severe and more enduring depression than those who experienced only a single stressor.Reference Morin, Galatzer-Levy and Maccallum 38 Following Hurricane Sandy, individuals living in communities with high unemployment and disaster-related damage were shown to be at increased risk of depression and PTSD.Reference Lowe, Sampson and Gruebner 16 , Reference Lowe, Sampson and Gruebner 39 Individuals exposed to Hurricane Sandy who had also been exposed to the 9/11 terrorist attack had higher Hurricane Sandy–related PTSD symptoms than did individuals who had not been exposed to the 9/11 attack.Reference Caramanica, Brackbill and Stellman 40
When examining the impact of potentially traumatic events upon the mental health of older adults in a study of a nationally representative sample of older adults, researchers found a 4.5% lifetime prevalence of PTSD and a 5.5% lifetime prevalence of partial PTSD.Reference Pietrzak, Goldstein and Southwick 41 Additionally, researchers examining a community sample after a traumatic event found a near-term prevalence of PTSD of 1% and a subthreshold level of PTSD symptomology in 13% of individuals.Reference Van Zelst, de Beurs and Beekman 42 Specifically, research examining the impact of hurricanes upon the mental health of older adults has found that, while this population reports fewer PTSD, mood, and anxiety symptoms following a hurricane, it is the economic impact of the hurricane that predicts the level of psychological distress older adults experience.Reference Acierno, Ruggiero and Kilpatrick 43
The temporal proximity of the 2008 economic crisis (the Great Recession) and the 2012 hurricane in the northeastern United States provides an ideal context to examine potential incremental impacts of stressor events. To test this possibility, in the current study, we examined trajectories of depression in individuals living in the New Jersey from 2 years prior to the 2008 economic downturn to 12 months after Hurricane Sandy. Furthermore, we explored the additional influence that county-level crime rates and economic markers might have upon both the depression trajectories and the trajectories’ relationship to PTSD symptoms after the hurricane.
METHODS
Participants and Procedure
The self-reported data were taken from the Ongoing Research on Aging in New Jersey: Bettering Opportunities for Wellness in Life (ORANJ BOWL) panel, a longitudinal study that assessed neighborhood and household characteristics, social support, symptoms of depression and PTSD, affect, and health-related wellbeing among older adults from 50 to 74 years old (Mage=60.67, SD=6.86) in New Jersey at 3 time points from 2006 to 2015.Reference Wilson-Genderson, Pruchno and Heid 44 We were able to include data from 1172 individuals with complete depression data at the 3 specified time points. To account for the change in community characteristics, we collected community data at the county level via publicly available state and federal government surveillance statistics on population, income, labor, and unemployment and crime rates. Community data were matched to the participant census track location based on the last known residential address at each given time point and aggregated to the county level. The Teachers College, Columbia University Institutional Review Board approved all study activities (for more details about recruitment refer to Puchno et al, 2010).Reference Pruchno, Wilson-Genderson and Rose 45
Measures
Demographic Characteristics
Individual’s race/ethnicity, highest level of education, age, and gender were collected at each time point.
Social Support
A 5-item scale asked participants to rate their degree of perceived social support from “none of the time” (1) to “all of the time” (5). Questions included items such as “How often do you feel that someone is available to give you good advice about a problem?” Responses on this measure were summed to create a total perceived social support score, with higher scores indicating greater perceived support. This measure has been previously shown to have sound psychometric properties.Reference Carpiano 46
Depression Symptoms
The 10-item Center for Epidemiological Studies Depression (CES-D 10) scaleReference Radloff 47 was administered at each time point. This scale, which asks participants to rate symptoms of depression in the past week on a 4-point Likert scale, has shown good reliability and validity in psychiatric populations and among older adults.Reference Björgvinsson, Kertz and Bigda-Peyton 48 , Reference Andresen, Malmgren and Carter 49 Previous research using this scale has indicated that a score less than or equal to 10 on this scale indicates minimal depression symptoms.Reference Andresen, Malmgren and Carter 49
Positive and Negative Affect
A 10-item version of The Positive and Negative Affect Schedule (PANAS) was administered at each assessment period.Reference Watson, Clark and Tellegen 50 , Reference Thompson 51 The PANAS has been shown to have good internal consistency.Reference Thompson 51
Successful Aging
A single item assessed successful aging at each time point by asking participants to rate “how would you rate your life these days?” from 0 (worst possible life) to 10 (best possible life), with a higher score indicating successful aging. This measure has been previously validated in an older adult population and has indicated sound psychometric properties.Reference Pruchno, Wilson-Genderson and Rose 45 , Reference Pruchno, Wilson-Genderson and Cartwright 52
Posttraumatic Stress Disorder Symptoms
The PTSD Symptom Scale Self-Report (PSS-SR) was administered within 12 months following Hurricane Sandy. This measure assessed trauma-related symptoms related to Hurricane Sandy, with a higher score indicating greater levels of posttraumatic stress related to the hurricane. The PSS-SR has been shown to have high reliability and validity in previous studies.Reference Foa, Riggs and Dancu 53 , Reference Coffey, Dansky and Falsetti 54
Community Crime Statistics
Data on crime rates and prevalence of specific crimes related to racial/gender bias, domestic violence, vagrancy, prostitution, drug abuse, motor vehicle theft, arson, burglary, aggravated assault, robbery, rape, and murder were extracted from the State of New Jersey, Division of State Police Uniform Crime Reporting Unit. 55 County-specific crime rates, as indicated by the number of crimes per 1000 inhabitants, and the number of arrests made for the above mentioned crimes were extracted and matched with the year when the participants completed their ORANJ BOWL assessment (2006-2008 and 2011-2015).
Labor Statistics
The unemployment rate, per capita income, and active labor force for each county in New Jersey for the years of assessment (2006-2008 and 2011-2015) were extracted from the US Department of Commerce Bureau of Economic Analysis 56 and State of New Jersey Department of Labor and Workforce Development. 57 From these measures, the seasonally adjusted unemployment rate and active labor force were extracted in thousands of persons. Per capita income is denoted by the average income per person in their respective county after accounting for the number of people residing in the given county.
Hurricane Sandy Exposure
Information for the FEMA (Federal Emergency Management Agency) Disaster Declaration (DR-4086, Oct 2012) was used to designate counties that were physically impacted by Hurricane Sandy. 58 This information was corroborated by examining the “Place Report”Reference Abramson, Van Alst and Merdjanoff 59 on the impact of Hurricane Sandy upon housing and community outcomes in a representative sample of New York and New Jersey residents in the most severely affected counties. Additionally, a 7-item self-report measure (eg, “Did you sustain physical injuries during Hurricane Sandy?” and “Did your home sustain damage from Hurricane Sandy?”) of hurricane exposure was administered to the participants as part of the trauma questionnaire to assess for individual-level exposure to and impact from the hurricane. As such, using both the FEMA and “Place Report,” we aimed to account for across and within county–level variability in exposure to and impact of Hurricane Sandy by assigning individuals to either exposure or no exposure groups based on their last known address at the time of Hurricane Sandy. To account for the individual-level exposure and impact of Hurricane Sandy, we used the responses to the self-report measure, for which higher scores indicated greater exposure to and impact of the hurricane. These variables were used to control for the county and individual levels of exposure to Hurricane Sandy.
Statistical Analysis
Trajectories of change in depression severity before the Great Recession (2006-2008; T1), before Hurricane Sandy (2011-2012; T2), and after Hurricane Sandy (2013-2014; T3) were mapped with latent growth mixture modeling on Mplus 6.12.Reference Muthén 60 We used a robust maximum likelihood estimation to account for missing data across time points.Reference Enders 61 , Reference Muthén, Kaplan and Hollis 62 To assess trajectory fit in the unconditional model, we compared models with varying numbers of latent classes upon Aikaike information criteria (AIC), Bayesian information criteria (BIC), sample size–adjusted Bayesian information criteria, entropy values, and Lo-Mendell-Rubin tests. The final model was selected based on model fit statistics, theoretical coherence, and interpretability.Reference Muthén 63 In all models, the slope parameter was fixed at 0 to aid model convergence. To examine predictors of class membership, we first explored theoretically relevant variables in univariate analyses and then included potentially meaningful covariates in the conditional model (Individual: age [T1], gender [T1], education [T1], race [T1], social support [T1], PTSD experience [T3], PTSD symptoms [T3]; Community [T1-T3]: average income, unemployment rate, crime rate). We also included 3 time-varying covariates to better isolate the unique impact of the economic downturn between T1 and T2 and the impact of Hurricane Sandy between T2 and T3. The time-varying covariates were community unemployment rate, community crime rate, and successful aging measured at each of the 3 time points. We retained covariates in the model if they allowed model convergence and significantly predicted class membership. To assess the independent impact of multiple potentially traumatic events on class membership, we assessed the distal impact of PTSD symptomology upon depression outcomes at the final time point outside the conditional model defined above. Because of missing data on certain covariates in the conditional analysis, our sample size changes from 1497 in the unconditional model to 1172 in the conditional model. The individuals for whom covariate data were missing were not significantly different than those with covariate data in gender, age, depression scores, Hurricane Sandy exposure, or PTSD symptoms.
Results
Demographic Characteristics of Study Sample
A total of 1172 individuals (415 male and 757 female) were included in the study. Of the total sample, most individuals were Caucasian (92.7%) and had postsecondary education (65.5%). The average age was 60.67 years (SD, 6.86). Among the 980 individuals in the resilient group, the majority were female (61.1%), Caucasian (94.8%), and had postsecondary education (68.47%). The average age in the resilient group was 60.65 (SD, 6.85). Among the 108 individuals in the depressed-improved group, the majority were female (83.3%) and Caucasian (95.1%), and approximately half had postsecondary education (50.93%). The average age in the depressed-improved group was 60.74 (SD, 6.77). Among 84 individuals in the incremental depression group, the majority were female (80.9%) and Caucasian (91.6%), and half had postsecondary education (50%). The average age in the incremental depression group was 61.20 (SD, 6.90). For additional information regarding sociodemographic characteristics, refer to Table 1.
Table 1 Descriptive Characteristics of the Study Sample
Abbreviations: T1, before the Great Recession (2006-2008); T2, before Hurricane Sandy (2011-2012); T3, after Hurricane Sandy (2013-2014).
At baseline, demographic characteristics significantly differed between the 3 groups in gender [F(2, 1169)=16.18; P=.000] and educational attainment [F(2, 1169)=11.656; P=.000). Specifically, post-hoc Tukey’s tests revealed that there were significantly more males in the resilient group (61.1%; 95% confidence interval [CI], 58.1%-64.2%) than there were in the depressed-improved (83.3%; 95% CI, 76.2%-90.5%) and incremental depression (80.9%; 95% CI, 72.4%-89.5%) groups. The post-hoc Tukey’s test for educational attainment revealed that those in the resilient group (86.5%; 95% CI, 65.6%-71.4%) were more likely to have postsecondary education than those in the depressed-improved (50.9%; 95% CI, 41.4%-60.5%) and incremental depression (50%; 95% CI, 39.1%-60.9%) groups.
Unconditional Model
We observed incremental improvement in several model fit indices (BIC/AIC) as the number of classes was increased from 1 to 4 (Table 2). Entropy remained relatively constant across class solutions. Crucially, however, the 4-class solution yielded a nonsignificant Lo-Mendell-Rubin adjusted test statistic, which indexes relative improvement compared to the previous class solution. Furthermore, inspection of the resulting trajectories indicated that the 4-class solution was derived by splitting a previous class into 2 parallel trajectories.Reference Jung and Wickrama 64 The 3-class solution also appeared to have the highest level of interpretability and theoretical utility.Reference Bonanno 31 , Reference Muthén 63 Together, these considerations strongly supported the 3-class model as the optimal unconditional model solution.
Table 2 Fit Indices for 1- to 4-Class Unconditional Growth Mixture Models of Depression Symptoms (N=1497)
Abbreviations: AIC, Akaike information criterion; BIC, Bayesian information criterion; SSBIC, sample-size adjusted Bayesian information criterion; LRT, Lo-Mendell-Rubin test.
The most common trajectory in the unconditional model, observed in the majority of participants (86%), was a resilient pattern with a low intercept (b, 7.614; SE, 0.115, P<.001) and a nonsignificant, flat linear slope over time (b, 0.040; SE, 0.043; P=.358). Importantly, we also observed an incremental depression (6.6%) trajectory that captured the hypothesized incremental impacts of multiple stressor events. This group had a relatively low intercept (b, 9.603; SE, 0.677; P<.001) and a significant, positive linear slope over time (b, 2.335; SE, 0.274; P<.001). More specifically, as can be seen in Figure 1, this group evidenced a significant increase in depression from the baseline assessment, prior to the Great Recession, to the second assessment several years after the onset of the Great Recession, t(87)=9.98 (P<.001), and then a further significant increase in depression following Hurricane Sandy, t(86)=3.81 (P<.001). Finally, we observed a depressed-improving trajectory (7.3%) with a high intercept (b, 16.464; SE, 0.803; P<.001) and a significant, negative linear slope (b, −.664; SE, 0.306; P<.001). Individuals in this group had high levels of depression symptomology prior to the Great Recession, a significant reduction in symptomology following the Great Recession, t(101)=6.39 (P<.001), and a continued reduction in depression symptomology following Hurricane Sandy, t(101)=5.14 (P<.001).
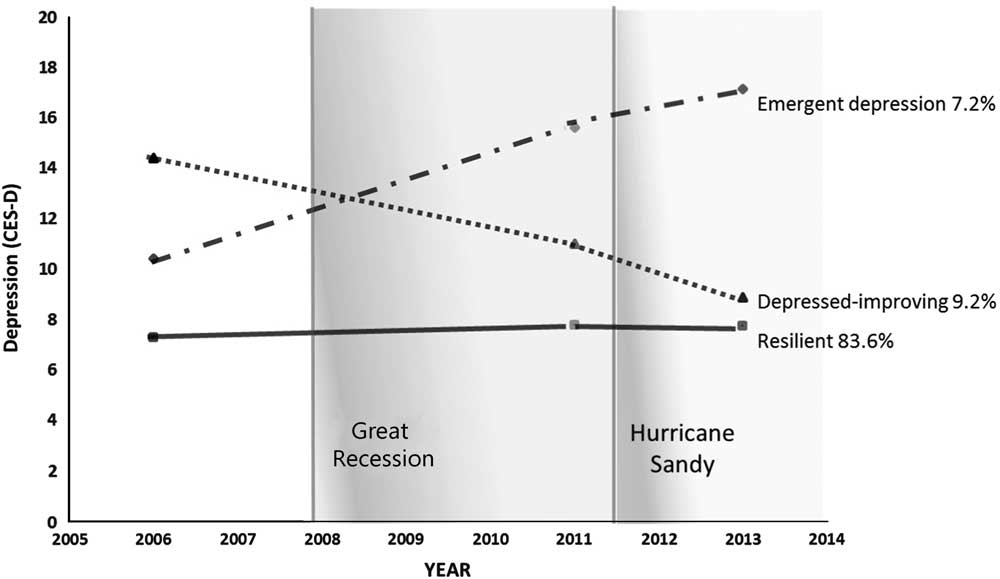
Figure 1 Trajectories of Depression (3 Classes)
Conditional Model
We examined a number of individual- and community-level variables as possible predictors of trajectory membership. Baseline covariates included in the conditional model were positive affect, negative affect, gender, education level, and social support. Compared to the resilient class, those in the incremental depression and depressed-improved classes were more likely to have attained less education, less likely to have social support, and more likely to endorse negative affect at baseline (Table 3). Positive affect did not differentiate the classes.
Table 3 Logistic Regression Estimates for Covariate Predictors of Class Membership at Baseline
a P<.01; b P<.001.
We also considered 3 time-varying covariates (measured at each time point) representing community unemployment rate, crime rate, and successful aging events. These covariates significantly impacted time-dependent depression symptomology and were thus retained in the model as control variables for time-relevant depressive symptomology.
The full conditional model retained the basic shape and prevalence of trajectories as the unconditional model. There were only slight model differences. In the conditional model, the sample size was reduced to 1172 from the unconditional sample size of 1497 because of missing data on covariates included in the conditional model. Importantly, although the slope of the incremental depression group was slightly less steep in the conditional model, the increase in depression from baseline to after the Great Recession for this group remained significant, t(83)=10.56 (P<.001), and the increase continued to be significant after Hurricane Sandy, t(83)=2.23 (P<.05).
PTSD following Hurricane Sandy
We tested whether the prospective depression trajectories predicted PTSD symptoms, measured after Hurricane Sandy, using the full conditional model to control for baseline covariates (positive affect, negative affect, gender, and education level) and time-varying covariates (community unemployment rate, crime rate, and successful aging events) included in that model. Results indicated that those in the incremental depression class, above and beyond the effects of time, individual, or community level variables, were significantly more likely to endorse PTSD symptomology after Hurricane Sandy than those in the resilient (t(83)=−8.166, P<.001) or depressed-improving (t(99)=−3.418, P=.001) classes.
Community Variables
To further characterize the trajectories, we conducted additional post-hoc MANOVA and repeated measures ANOVA on other potentially relevant community variables to test for effects of time, class, and interactions between time and class. The MANOVA showed a significant impact of motor vehicle theft at baseline (T1) on class membership [F(2, 1172)=7.412; P=.001; partial η2=0.013]. Post-hoc Tukey tests revealed that the depressed-improved group lived in communities with higher motor vehicle thefts at baseline compared to the resilient group (P=.001) and incremental depression groups (P=.005).
Following the Great Recession (T2) there was a significant impact of the number of arrests for rapes [F(2, 1172)=5.832; P=.003; partial η2=0.010], criminal restraints [F(2, 1172)=5.35; P=.005; partial η2=0.009], and criminal sexual contact [F(2, 1172)=3.750; P=.024; partial η2=0.006) on class membership. The post-hoc Tukey test revealed that those in the depressed-improved class lived in communities with higher rates of arrest for rape and criminal sexual contact than did those in the incremental group but not than those in the resilient group. Additionally, those in the depressed-improved class also lived in communities with higher rates of criminal restraints compared to both the resilient (P=.004) and incremental (P=.040) groups.
During the period after Hurricane Sandy (T3), the rates of arrests for criminal restraint [F(2, 1172)=4.557; P=.011; partial η2=0.008) and criminal sexual contact [F(2, 1172)=4.642; P=.010; partial η2=0.008] had an impact on class membership. The post-hoc Tukey test revealed that individuals in the depressed-improved class lived in communities with higher rates of criminal restraint and criminal sexual contact–based arrests than did individuals in the resilient and incremental depression groups.
Finally, we examined the impact of community labor force as measured by the number of individuals who were unemployed. A repeated measures ANOVA found that there was a significant impact of time (F(1.053, 1230.867)=2199.732; P<.001), but no significant main effect of class (F(2, 1169)=0.764; P=.466) or interaction between time and class (F(2.106, 1230.867)=.111; P=.904) upon the number of individuals that were unemployed.
DISCUSSION
There has been a dearth of research examining the potentially incremental impact of multiple stressful events upon mental health outcomes over time. In this study, we prospectively examined trajectories of depression among older adults who experienced the Great Recession followed by Hurricane Sandy in 2012. We found 3 unique trajectories of depression. Importantly, one of these trajectories, the incremental depression pattern, provided preliminary evidence of incremental impacts from the 2 stressor events. Individuals in this group were not depressed prior to the Great Recession but showed a marked increase in depression symptoms following the Great Recession and then a further incremental increase in depression following Hurricane Sandy. Those in the incremental depression group were also at a greater risk for PTSD following Hurricane Sandy. These results suggest that the persistence of depressive symptoms following the Great Recession magnified the experience of the Hurricane. Indeed, this was the only group to show a clear mental health impact of the hurricane and the only group to show elevated PTSD symptoms following the hurricane. These results extend previous findings indicating that multiple stressors incrementally increase depression reactions and that previous elevation in PTSD symptoms increases risk for developing PTSD following another traumatic event.Reference Morin, Galatzer-Levy and Maccallum 38 , Reference Caramanica, Brackbill and Stellman 40 , Reference Breslau, Peterson and Schultz 65
We observed a depressed-improved pattern that also extended outcomes from previous studies. Individuals in this group had elevated depression prior to the Great Recession of 2008 but lower depression after the Great Recession and a further reduction in depression following Hurricane Sandy. Indeed, after the hurricane these individuals were reporting depression symptoms similar to those in the resilient group. Previous research has suggested that this pattern of improvement can be attributed at least in part to increased social support.Reference Mancini, Bowen and O’Neal 35 Having attained these results after accounting for the impact of social support, our results suggest that there are likely other factors such as social cohesion and neighborhood attachmentReference Sampson, Morenoff and Gannon-Rowley 66 that could explain such improvements in trends. Previous research examining the impact of social cohesion upon the development of psychopathology following a natural disaster had implicated community-level cohesion as a protective factor against the onset of depressive symptoms above and beyond the effects of the baseline depression and level of exposure to the disaster, suggesting that it is the ability to activate social networks following a disaster that may serve to reduce its impact upon mental health outcomes.Reference Hikichi, Aida and Tsuboya 67 Additionally, research examining the impact of social cohesion and neighborhood attachment in the current sample has found that greater social cohesion resulted in a reduced impact of Hurricane Sandy.Reference Heid, Pruchno and Cartwright 13
Finally, a majority of our sample experiencing little or no depressive symptoms at baseline and showed little change over time (CESD-10 scores ≥10)Reference Andresen, Malmgren and Carter 49 , which suggests a stable resilience trajectory.Reference Bonanno, Westphal and Mancini 29 , Reference Bonanno 31 The fact that the resilience trajectory was observed with a high prevalence in our study is compatible with previous research showing the prevalence of the resilience trajectory to be similar among individuals experiencing multiple life-threatening stressors within a 2-year period.Reference Morin, Galatzer-Levy and Maccallum 38 Additionally, research examining the impact of natural disasters upon the mental health of older adults has shown that they are more likely to report fewer depressive, anxious, or PTSD symptoms following a natural disaster.Reference Acierno, Ruggiero and Kilpatrick 43
By accounting for the context within which these individuals reside, our findings also highlighted the importance of community characteristics. We found that those in the depressed-improved class lived in areas with higher rates of community crime–related arrests for motor vehicle theft, rape, criminal sexual contact, and criminal restraints over time. Specifically, we see that violent, sex-based crimes are consistently on the rise in the communities where the depressed-improved individuals reside. At a county level, these trends preliminarily suggest that there may be a relationship between increased rates of violent sex–based crimes over time and the impact that may have upon individual’s sensitivity to such events. These results reflect previous findings that have shown that increases in depression symptoms are associated with neighborhood violence and its effect on experiences of violence and perceptions of neighborhood safety.Reference Curry, Latkin and Davey-Rothwell 68 , Reference Wilson-Genderson and Pruchno 69 Furthermore, longitudinal research has highlighted that it is only those that experience multiple crimes that have negative mental health outcomes over time, suggesting that while those in the depressed-improved group may reside in areas with higher rates of crime, they may not be direct victims of these crimes over time.Reference Norris and Kaniasty 70 These results are underscored by nonsignificant interactions between time and class that suggest that the increases in crime were common across all regions and classes. Further evidence from a precinct or zip code level analysis would be necessary to draw more concrete conclusions.
The results of this study highlight important targets and avenues for individual- and policy-level interventions. With the understanding that a majority of individual typically do not experience a traumatic response or worsening depression to multiple traumatic events, efforts to provide targeted psychological interventions should focus on those that are at highest risk for worsening depression symptoms. Our findings that only those in the incremental depression group later endorsed PTSD symptoms suggest that this group would be an ideal target for individualized interventions. Furthermore, the community-level variables used in this study already serve as viable indicators of economic and criminal policy change, and can thus be used to identify geographical regions where institutional support and aid funds can be allocated to serve the needs of those most at risk for worsening mental health responses to multiple crises.
CONCLUSIONS
As this study was limited to older adults living in New Jersey, we are cautious about generalizing these findings to younger groups or to those living in regions beyond the northeastern United States. Additionally, as we only accounted for traumatic experiences post-Hurricane Sandy, we are unable to account for the impact, severity, or history of previous traumatic events as well as the direct potentially traumatic impact of the Great Recession. As a single-item measure for successful aging was used to assess for the impact of stressful life events, the degree to which this measure can account for the participant’s experiences at each event is limited. Furthermore, given that our community variables were collected and aggregated at the county level, it is possible that we failed to capture more nuanced community impacts overall. Another limitation is that we were unable to assess the impact of social support across all time points. Previous research has highlighted the importance of changes in social support in moderating stressful life events,Reference Mancini, Bowen and O’Neal 35 and thus our results should be taken in light of this fact.
Despite these limitations, the findings of this study add an important piece to our understanding of the incremental impact of multiple major stressors. Future research might extend these findings by examining the impact of community characteristics using more nuanced approaches such as hierarchal modeling. It would also be advantageous to examine these patterns in different populations and different age groups as well as with more varied types of stressor events.
Funding
Thanks to the Rowan University School of Osteopathic Medicine for funding that enabled establishment of the ORANJ BOWL (Ongoing Research on Aging in New Jersey: Bettering Opportunities for Wellness in Life) research panel and collection of baseline data, the University of Medicine and Dentistry of New Jersey Foundation for funding time 3 data collection, and the Assistant Secretary for Preparedness and Response (1 HITEP130008-01-00) and the Rockefeller Foundation (2012_RLC 304; PI: George Bonanno) for funding time 4 data collection.


