


I. INTRODUCTION
Potassium chromate (K2CrO4) is a product extracted from chromite ore through many hydrometallurgical processes (Zheng et al., Reference Zheng, Zhang, Li, Qi, Li and Xu2006). It has been used for producing chrome oxide (Cr2O3), which was followed by numerous applications such as green pigments (Liang et al., Reference Liang, Zhang, Luo, Luo, Li, Xu and Zhang2014), nano-composite batteries (Abbas et al., Reference Abbas, Ahmad, Rehman, Rana, Khan, Hussain and Nam2016), catalysts (Mahmoud, Reference Mahmoud2016), gas sensors (Park et al., Reference Park, Kim, Sun, Choi, Lee and Lee2015), magnetic materials (Anandan and Rajendran, Reference Anandan and Rajendran2014), and solar energy materials (Khamlich and Maaza, Reference Khamlich and Maaza2015).
The hydrogen reduction of K2CrO4 to form Cr(III) compounds is the chief step during the preparation process of Cr2O3. In the past, the valence state changes of chromium (Cr) and the corresponding reduction products during the hydrogen reduction of K2CrO4 have not been thoroughly researched.
It is well known that potassium and Cr are known to form a number of crystallographically well-defined K x CrO y compounds, such as K3CrO4 (Johnson, Reference Johnson, Hepler, Bamberger and Richardson1978), K3CrO8 (Cage et al., Reference Cage, Weekley, Brunel and Dalal1999), KCr3O8 (Vidya et al., Reference Vidya, Ravindran, Kjekshus and Fjellvåg2006), and KCrO2 (Zafar Ali et al., Reference Zafar Ali, Nuss and Jansen2013). The reduction products of K2CrO4 may contain many Cr5+, Cr4+, and Cr3+ compounds. Among them, Cr6+ and Cr3+ are the most stable states, with stable electronic configurations of d 3 and d 0, respectively (Weckhuysen et al., Reference Weckhuysen, Wachs and Schoonheydt1997). While the Cr5+ and Cr4+ are less stable, the reaction in air involves the disproportionation reaction of Cr5+, which would produce 1/3 of Cr3+ and 2/3 of Cr6+.
Primitive works have indicated that the reduction products contain amorphous CrOOH and KCrO2, while there is not sufficient evidence to support the generation of KCrO2 (Bai et al., Reference Bai, Xu, Zhang and Li2006; Li et al., Reference Li, Xu, Zheng, Zhang, Li and Bai2008). Because the unstable KCrO2, Cr5+ and Cr4+ compounds are extremely sensitive to the air and humidity, they are immediately oxidized in the atmospheric environment (Delmas et al., Reference Delmas, Devalette, Fouassier and Hagenmuller1975). Therefore, the KCrO2 and complicated reduction products could not be identified using conventional methods.
The development of in situ high-temperature X-ray diffraction (XRD) and in situ Fourier transform infrared spectroscopy (FTIR) technology make the structural analyses in a dry and inert atmosphere possible (Sakaki et al., Reference Sakaki, Terashita, Tsunokake, Nakamura and Akiba2011; Kubis et al., Reference Kubis, Baumann, Barsch, Selent, Sawall, Ludwig, Neymeyr, Hess, Franke and Börner2014). To elucidate the reduction mechanism of K2CrO4 and the existence of various K x CrO y compounds, in situ high-temperature XRD was employed to detect crystalline phases, and in situ FTIR was used to measure the amorphous phase. We sought to elucidate the changes of the crystal structure and the composition of products during the reduction process. In addition, the effects of the reduction rate were also studied, including reduction temperature and time.
II. EXPERIMENTS
A. Materials
The K2CrO4 (A.R.) used in this work was manufactured via the KOH hydrometallurgical process (Zheng et al., Reference Zheng, Zhang, Li, Qi, Li and Xu2006). The purity of the reduction gas (99.9%, v/v) was composed of 3.55% hydrogen and 96.45% helium.
B. In situ XRD
In situ XRD experiments were carried out using a SmartLab X-ray diffractometer equipped with a secondary monochromator (CuKα1 radiation). The in situ cell consisted of a XRK-900 Anton Paar high-temperature reactor chamber (volume of 400 ml), which was mounted onto a goniometer and connected to a gas-feed system (He and H2).
The content of hydrogen was limited to 4% to avoid the risk of an explosion. K2CrO4 was reduced by a mixture of gas (3.55% hydrogen and 96.45% helium) from 30 to 700 °C. The pressure of the mixture gas was 1 atm, and the flow rate was 300 mL min−1. The temperature was measured using a thermocouple contacting with the sample holder. The ambient temperature was controlled using a TCU 750 temperature controller, allowing the maximum temperature of 750 °C. From 30 to 400 °C, the temperature was increased at a rate of 10 °C min−1, and from 400 to 700 °C, the temperature was increased at a rate of 1 °C min−1. The holding time was 10 min before every test. A machinable “Macor” glass ceramic was used as a sample holder. A very small nickel (Ni) boat was placed on the top of the Macor to preventing the Macor contact with the molten reduction product KOH. The appropriate z-alignment of the XRK 900 was ensured after changing each sample. The 2θ range was also tested before every experiment.
General XRD patterns were recorded using a Rigaku diffractometer employing CuKα radiation (from 5° to 90° 2θ at steps of 0.02° 2θ, and a counting time of 2 s step−1).
C. In situ FTIR
The in situ FTIR experiments were performed using a Nicolet 6700 FTIR spectrometer equipped with a DTGS detector. The pure K2CrO4 sample that underwent the infrared (IR) analysis were pressed to a self-supporting wafer (60–100 mg). This wafer was then sealed with stainless steel gaskets. The samples were heated to 600 °C in a flowing stream (30 mL min−1) of 3.55% hydrogen and 96.45% helium. From 30 to 600 °C, the temperature was increased at 10 °C min−1. After the signals were stable at each temperature, the IR spectra were obtained. The IR spectra were recorded at a resolution of 3 cm−1 using 250 signal-averaged scans.
III. RESULTS AND DISCUSSION
A. In situ XRD
The first in situ powder XRD experiment was performed using hydrogen as the reducing agent (3.55 vol.% H2 blanched with He, 300 mL min−1). The results are presented in Figure 1.
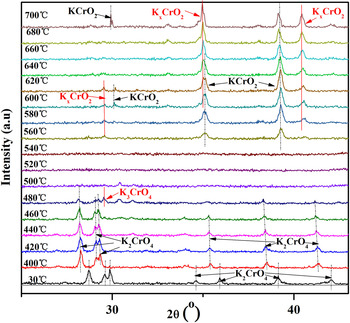
Figure 1. (Color online) Evolution of XRD patterns during the reduction of K2CrO4 from 30 to 700 °C. Characteristic diffraction lines of K2CrO4, K3CrO4, and KCrO2 are indicated.
When the temperature was increased, from 30 to 480 °C, the K2CrO4 was reduced by hydrogen. The diffraction peaks of K2CrO4 gradually decreased, and shifted to lower angles (shown in broken line). This is because with the enhancement of temperatures, the interplanar spacing of K2CrO4 becomes larger. At 480 °C, the K3CrO4 was observed. When the system was further heated to 500 °C, the diffraction peaks of K3CrO4 disappeared, and the amorphous intermediate was observed. Above 560 °C, the formation of KCrO2 was observed. A mixture of KCrO2 and K x CrO2 was obtained at temperatures from 600 to 700 °C.
The crystalline phases were identified via the international center for diffraction data files (K2CrO4, PDF No. 00-15-0365; K3CrO4, PDF No. 00-31-0994; KCrO2, PDF No. 00-46-0262; K x CrO2, PDF No. 04-020-6422; Ni, PDF No. 00-04-0850). The corresponding lattice parameters of different reduction products, including K3CrO4, KCrO2, and K0.7CrO2 are presented in Table I. The XRD patterns of the reduction products at 480, 520, and 660 °C are also presented in Figure S1 (Supporting Information).
Table I. The corresponding lattice parameters of different reduction products from 30 to 700 °C.

The lowest formation temperatures of the K3CrO4, amorphous intermediate and KCrO2 + K x CrO2 were 480, 500, and 600 °C, respectively. Thus, the XRD measurements of the reduction reaction of K2CrO4 under isothermal conditions were also performed at different temperatures.
Figure 2 show the time-resolved XRD data for the isothermal reduction of K2CrO4 at 500 °C (also seen in Figure S2, Supporting Information). These experimental conditions (gas flow rate, 3.55 vol.% H2 and 96.5 vol.% He) were similar to the above experiment. In the first 2 min, Cr6+ is reduced to Cr5+, and K2CrO4 is simultaneously reduced to K3CrO4. Next, K3CrO4 is reduced to forming an amorphous compound. Moreover, the final reduction product was an amorphous intermediate at a low temperature of 500 °C.

Figure 2. (Color online) Evolution of XRD patterns during the reduction of K2CrO4 at 500 °C for 270 min.
Figure 3 shows the data for the isothermal reduction of the K2CrO4 powders at 600 °C. In this experiment, the onset of K3CrO4 and the amorphous intermediate phase transition were also observed. After an “amorphous period” of approximately 30 min, the formation of crystalline phases K x CrO2 and KCrO2 were observed in this stage. The XRD peaks of K3CrO4, KCrO2, and KCrO2 + K x CrO2 during reduction at 600 °C for various durations were also show in Figure S3 (Supporting Information).

Figure 3. (Color online) Evolution of the XRD patterns during the reduction of K2CrO4 at 600 °C for 270 min.
According to the XRD analysis shown in Figure 3, the diffraction peaks of K x CrO2 were well indexed and in good agreement with the standard PDF No. 04-020-6422, indicating that the resultant material was monoclinic K x CrO2 (0.70 ≤ x ≤ 0.77). In addition, K was also observed during the reduction process. The recorded Ni peak is attributed to the nickel (Ni) boat in the XRD detection.
In situ powder XRD measurements for the isothermal reduction of K2CrO4 at 700 °C were also performed, and the results are presented in Figure 4 (also seen in Figure S4, Supporting Information). The reduction of K2CrO4 directly resulted in the formation of KCrO2 and K x CrO2 (0.70 ≤ x ≤ 0.77) at 700 °C. No additional crystalline phases were detected in this temperature range. Taking these results into account, KCrO2 and K x CrO2 (0.70 ≤ x ≤ 0.77) were the final products of the reduction of K2CrO4 at 700 °C.

Figure 4. (Color online) Evolution of XRD patterns during the reduction of K2CrO4 at 700 °C for 240 min.
The in situ XRD experiments under isothermal and temperature-programmed reaction conditions indicated that the entire reduction process consisted of three solid solution regions: K3CrO4, an amorphous intermediate, and KCrO2 + K0.7CrO2. The detail reduction mechanism is discussed; and it was discovered that during the reduction of K2CrO4, a three-step process was obvious:
 $$\eqalign{& {\rm K}_{\rm 2}{\rm Cr}{\rm O}_{\rm 4} \to {\rm K}_{\rm 3}{\rm Cr}{\rm O}_{\rm 4} \to {\rm amorphous}\;{\rm intermediate} \cr & \quad \to {\rm KCr}{\rm O}_{\rm 2}{\rm +} {\rm K}_x{\rm Cr}{\rm O}_{\rm 2}.} $$
During the hydrogen reduction of K2CrO4, diffraction peaks for K3CrO4, KCrO2, and K x CrO2 were discovered for the first time. The oxidation state of Cr5+ was rather unstable. The dark-green K3CrO4 is highly hygroscopic and sensitive, and it is spontaneously oxidized when exposed to air at room temperature. For the typical route to synthesizing K3CrO4, Cr2O3, KOH, and K2CrO4 were used as the raw materials, and the reaction was completed at 700 °C in approximately 8 h (Banks and Jaunarajs, Reference Banks and Jaunarajs1965; Scholder et al., Reference Scholder, Schwochow and Schwarz1968; Bamberger and Richardson, Reference Bamberger and Richardson1975). However, in this work, K3CrO4 was prepared through a simple and low-temperature method.
KCrO2 is a green powder with a magnetic property, and it is extremely sensitive to moisture and oxygen as well (Zafar Ali et al., Reference Zafar Ali, Nuss and Jansen2013). In the past, KCrO2 has been synthesized via an azide/nitrate route (Delmas et al., Reference Delmas, Devalette, Fouassier and Hagenmuller1975; Scheld and Hoppe, Reference Scheld and Hoppe1989; Delmas et al., Reference Delmas, Fouassier, Hagenmuller and Ackerman2007). This method must be executed at high-temperature and dangerous pressures. Using the facile and highly reproducible hydrogen reduction method, KCrO2 was first prepared.
The mechanism of the generation of KCrO2 and K x CrO2 was discovered as well. It was reported that K x CrO2 can be crystallized in two polymorphs, K x CrO2 (0.70 ≤ x ≤ 0.77) and K x CrO2 (0.50 ≤x ≤ 0.60) (Delmas et al., Reference Delmas, Devalette, Fouassier and Hagenmuller1975). K0.7CrO2, PDF No. 04-020-6422, was crystallized in a monoclinic system [A2/m; a = 6.581 Å, b = 2.986 Å, c = 5.062 Å]. While K0.5CrO2, PDF No. 00-028-0745, crystallizes in a rhombohedral system [R3m; a = 2.918 Å, b = 2.918 Å, c = 18.840 Å]. Delmas has reported that the pure KCrO2 evolves metal potassium in vacuum at high temperatures, and the reactions can be described by the following equations (Delmas et al., Reference Delmas, Fouassier, Hagenmuller and Ackerman2007):
 $${\rm KCr}{\rm O}_{\rm 2} = {\rm K}_x{\rm Cr}{\rm O}_{\rm 2} + (1 - x){\rm K} \uparrow (0.70\le x\le 0.77)$$
 $${\rm KCr}{\rm O}_2 = {\rm K}_x{\rm Cr}{\rm O}_{\rm 2} + (1 - x){\rm K} \uparrow (0.50\le x\le 0.60)$$
When the temperature is 700 °C, a potassium-deficient phase with the formula K0.7CrO2 is obtained (Delmas et al., Reference Delmas, Fouassier, Hagenmuller and Ackerman2007). When the temperature is raised to 900 °C, a phase more deficient in potassium K0.5CrO2 is obtained. K0.7CrO2 and K0.5CrO2 are very sensitive to moisture and oxygen. Zhou et al. have also suggested that the electrode of NaCrO2 can be break down into Na0.75CrO2 and Na0.5CrO2 during the battery charging (Zhou et al., Reference Zhou, Ding, Nam, Yu, Bak, Hu, Liu, Bai, Li, Fu and Yang2013), which was in fair agreement with the potassium extraction of KCrO2.
This result demonstrated that the formation of the K0.7CrO2 and metal K was because of the decomposition of the KCrO2 under a dry and helium atmosphere. In addition, some of the reduction products were liable to spontaneously combustible after they were in contact with water, which also proved that the metal K may exist in reduction products.
The onset of the KCrO2 and K x CrO2 (0.70 ≤ x ≤ 0.77) phase transition at 600 °C was also observed, and shown in Figure 5. The peak at 2θ = 39.290° was assigned to d (1 0 4) diffraction of the KCrO2 phase, whereas the peak at 2θ = 40.808° was assigned to d (1 1 1) diffraction of the K0.7CrO2 phase. As shown in Figure 5, both KCrO2 and K0.7CrO2 were present almost simultaneously. The intensity of the two diffraction lines increased with prolonging the times. During the reduction of K2CrO4 at a high temperature, KCrO2 was produced and decomposed spontaneously into K0.7CrO2 and metal K.

Figure 5. (Color online) The phase of KCrO2 and K x CrO2 (0.70 ≤ x ≤ 0.77) increased with prolonging reduction time at 600 °C.
B. In situ FTIR spectroscopy
Some amorphous materials were generated during the reduction reaction. To characterize the amorphous phase, the in situ FTIR studies of hydrogen reduction at different temperatures were also performed.
The experiment was performed using hydrogen (3.55 vol.% H2 in helium) as the reducing agent. The reduction results during 30 to 600 °C are presented in Figure 6(a). The specific changes of the different reduction products at 30–600 °C are presented in Figures 6(b)–(f). The IR spectroscopy of pure K2CrO4, KOH, and CrOOH are presented as the reference samples in Figure 6(g).

Figure 6. (Color online) (a) Evolution of IR spectroscopy during the reduction of K2CrO4 in hydrogen from 30 to 570 °C; (b) The IR spectroscopy of the reduction product at 30 °C; (c) The IR spectroscopy of the reduction product at 400 °C; (d) The IR spectroscopy of the reduction product at 570 °C; (e) The IR spectroscopy of the reduction product at 580 °C; (f) The IR spectroscopy of the reduction product at 600 °C; (g) IR spectroscopy of pure K2CrO4, KOH, and CrOOH; •υ(K2CrO4) = 883, 1228, 1759 cm−1; ■υ(KOH) = 1409 cm−1; ★υ(K3CrO4) = 630–638 cm−1; ▾υ(CrOOH) = 521, 1190, 1735 cm−1.
The three upward bands at 883, 1228, and 1759 cm−1 are assigned to K2CrO4 (Miller and Wilkins, Reference Miller and Wilkins1952; Campbell, Reference Campbell1965). When the reduction temperature was increased from 400 to 560 °C, two downward bands were observed at 505 and 1384 cm−1, which were attributed to the CrIII–O stretching modes (Marshall et al., Reference Marshall, Mitra, Gielisse, Plendl and Mansur1965; Yang et al., Reference Yang, Cheng, Martens and Frost2011) and KOH (Russell, Reference Russell1979), respectively. The experimental phenomena indicate that K2CrO4 (Cr6+) is preferentially reduced to a high activity Cr3+ compound and KOH.
After the reduction temperature is increased to 570 °C, two downward bands were observed at 505 and 1384 cm−1, which attributed to CrIII–O stretching modes and KOH, respectively. A downward band was found at 638–630 cm−1, which is assigned to groups of the CrO4 x− type, where x = 3 (Bailey and Symons, Reference Bailey and Symons1957; Ratnasamy and Leonard, Reference Ratnasamy and Leonard1972). This band was detected as crystalline K3CrO4 in the in situ XRD. However, the band at approximately 850 cm−1 was also assigned to the linearly bonder of υ(CrVI–O) (Muller et al., Reference Muller, White and Roy1969), which indicates that Cr6+ also existed in the reduction product at 570 °C. Therefore, Cr3+, Cr5+, and Cr6+ coexist in the reduction product at this stage.
When the reduction temperature is increased to 580–600 °C, the reduction products clearly show four bands: 536, 1105, 1390, and 1720 cm−1. The strong sharp peak at 539 cm−1 corresponds to the CrIII–O anti-symmetric stretching vibration (Yang et al., Reference Yang, Martens and Frost2010; Yang et al., Reference Yang, Cheng, Martens and Frost2011). The band at approximately 1105 cm−1 corresponds to the linearly bonder of δ(CrIII–O–H) (Russell, Reference Russell1979). These bands are characteristic of CrOOH (Snyder and Ibers, Reference Snyder and Ibers1962; Ratnasamy and Leonard, Reference Ratnasamy and Leonard1972; Bai et al., Reference Bai, Xu, Zhang and Li2006). In addition, the low-intensity band observed at 1720 cm−1 is assigned to the bending modes of non-dissociated water molecules (Pei et al., Reference Pei, Xu and Zhang2009), and the downward band at 1390 cm−1 is assigned to KOH (υ O–H). The FTIR studies discussed above demonstrate that amorphous CrOOH and KOH are the main phase products in the amorphous intermediate solid solution region. Furthermore, the band at approximately 850 cm−1, which would be assigned to the linearly bonder of υ(CrVI–O), was not found, indicating that Cr6+ is completely reduced at 580 °C.
Table II shows different dominant peaks of the reduction products. According to the related peak intensities changes, the high-activity Cr3+ compound and KOH are the main phase products of the primary stage of reduction. With increasing reduction times, crystalline K3CrO4 was generated. At a higher temperature of 600 °C, the K2CrO4 and K3CrO4 were completely reduced to Cr3+ compound, and amorphous CrOOH and KOH are the main phase products in the amorphous intermediate region.
Table II. The IR spectrum of different reduction products during reduction of K2CrO4 from 30 to 600 °C.

C. Reduction mechanism
To summarize the above-discussed in situ XRD and FTIR results, we propose that the hydrogen reduction of K2CrO4 is a very complex process. Increasing the reaction temperatures and times were beneficial for the reduction.
From 30 to 500 °C, according to the experimental results of FTIR, the K2CrO4 was preferentially but incompletely reduced to Cr3+ and KOH. As the reduction proceeded, amorphous Cr3+ compound chemically reacted with KOH and K2CrO4 to form higher oxidation states of Cr. The XRD experimental results showed that the Cr5+ compound was K3CrO4 without the formation of other crystalline phases. Cr3+, Cr5+, and Cr6+ coexisted at this stage.
From 500 to 600 °C, as the reduction proceeded, Cr6+ was completely reduced. XRD results indicated that amorphous intermediate was the final product of the reduction of K2CrO4. Considering the IR spectrum, the main phase products in the amorphous intermediate region were amorphous CrOOH and KOH. The KOH became amorphous molten substances above 406 °C.
Above 600 °C, the formation of KCrO2 was observed. In addition, KCrO2 was the only product formed during the reduction of K2CrO4. None of the other crystallographically compounds were detected. According to previous experimental results, KCrO2 may be formed by the reaction of the newly produced amorphous CrOOH and KOH (Bai et al., Reference Bai, Xu, Zhang and Li2006). In addition, if the reaction time was extended, KCrO2 may be partial decomposed into the K x CrO2 (0.70 ≤ x ≤ 0.77) and K metal phases. At a higher reaction temperature of 700 °C, the formation of KCrO2 and K0.7CrO2 were immediately observed. Therefore, it was concluded that the reduction proceeds following a consecutive mechanism: CrOOH and KOH first react to form KCrO2, and then KCrO2 is decomposed partially but immediately into the K0.7CrO2 and K metal phases. The two reaction fronts coexist simultaneously.
Hence, the reaction can be described by the following processes:
 $$\eqalign{& {\rm K}_{\rm 2}{\rm Cr}{\rm O}_4 \to {\rm amorphous}\;{\rm C}{\rm r}^{3 +} + {\rm K}_{\rm 3}{\rm Cr}{\rm O}_{\rm 4} \to \cr & \quad {\rm amorphous}\;{\rm CrOOH} \to {\rm KCr}{\rm O}_2} $$
In the final heating stage, KCrO2 spontaneous decomposed. The different stages of the reaction are:
 $$\eqalign{& {\rm 7}{\rm K}_{\rm 2}{\rm Cr}{\rm O}_{\rm 4} + {\rm 5}{\rm H}_{\rm 2} \to 4\;{\rm amorphous}\;{\rm C}{\rm r}^{3 +} \;{\rm compound} \; {\rm +} \cr & \quad3{\rm K}_{\rm 3}{\rm Cr}{\rm O}_{\rm 4} + 5/2{\rm H}_{\rm 2}{\rm O}\quad(30\;{\rm to} \; 500\;^{\circ}{\rm C})} $$
 $$\eqalign{& 2{\rm K}_{\rm 2}{\rm Cr}{\rm O}_{\rm 4} + 3{\rm H}_{\rm 2} \to 2\;{\rm amorphous}\;{\rm CrOOH} \cr & \quad \quad \quad \quad \quad \quad \quad + 4{\rm KOH}\quad(500\;{\rm to}\; 600\;^{\circ} {\rm C})} $$
 $${\rm CrOOH + KOH} \to {\rm KCr}{\rm O}_2 + {\rm H}_{\rm 2}{\rm O}\quad( \gt 600\;^{\circ}{\rm C})$$
 $$\eqalign{& {\rm KCr}{\rm O}_{\rm 2} \to {\rm K}_x{\rm Cr}{\rm O}_{\rm 2} + (1 - x){\rm K} \uparrow (0.70\le x\le 0.77) \cr & \quad ( \gt 600\;^{\circ}{\rm C}\;{\rm parallel}\;{\rm reaction})} $$
IV. CONCLUSIONS
Here, we report that the hydrogen reduction of K2CrO4 using in situ high-temperature XRD and in situ FTIR in the protection of the inert atmosphere. The mechanisms involved were interpreted that the hydrogen reduction of K2CrO4 was a consecutive reaction (K2CrO4 → amorphous Cr3+ + K3CrO4 → amorphous CrOOH → KCrO2) with many intermediate products, including K3CrO4, amorphous CrOOH, KCrO2, and K0.7CrO2. The effects of the reduction temperature and time on the control of the reduction products were clarified. Such mechanisms are hard to achieve on the conventional reduction methods. The present finding has both fundamental and practical significance. For example, they suggest a generalized way of simultaneous making very rare K3CrO4, KCrO2, and K0.7CrO2 materials, which have been found to possess unique high-activity and antiferromagnetic virtues in a wide variety of important areas. Besides, this reduction mechanism is also a good reference to the other reduction process of chromate, such as X 2CrO4 phases (X = Na and K).
SUPPLEMENTARY MATERIAL
The supplementary material for this article can be found at https://doi.org/10.1017/S0885715617000690
ACKNOWLEDGMENTS
The authors gratefully acknowledge financial support from the National Natural Science Foundation of China (Grant No. 11204304), the National Basic Research Program (973 Program) of China (Grant No. 2013CB632600), and the National High-tech Research and Development Program of China (Grant No. 2011AA060702).


