


Introduction
Sexual dimorphism is broadly defined as the phenomenon in which the sexes of a species are phenotypically different. Such differences typically become more pronounced with maturity, and are usually manifested in the morphology of the reproductive organs, but may also include variation in the shapes of display (e.g., horns and crests) and feeding structures, in color, in body size, and in behavior. Recent debate has centered on the semantics of sexual dimorphism, with some (Padian and Horner Reference Padian and Horner2011a,Reference Padian and Hornerb, Reference Padian and Horner2013, Reference Padian and Horner2014a,Reference Padian and Hornerb) arguing that the term be limited to describing discrete (presence/absence) features, and others (Knell and Sampson Reference Knell and Sampson2011; Knell et al. Reference Knell, Naish, Tomkins and Hone2013a,Reference Knell, Naish, Tomkins and Honeb; Mendelson and Shaw Reference Mendelson and Shaw2013; Borkovic and Russell Reference Borkovic and Russell2014) arguing for a more inclusive definition that encompasses continuous variation. The latter definition is the more commonly and widely employed (e.g., Cunningham Reference Cunningham1900; Schoener Reference Schoener1967; Hedrick and Temeles Reference Hedrick and Temeles1989; Shine Reference Shine1989; Andersson Reference Andersson1994), so it is used here for strictly pragmatic reasons.
The semantic debate about sexual dimorphism has likewise sparked disagreement concerning what counts as evidence for sexual selection. Assuming a strict definition of sexual dimorphism, only the documentation of discontinuous character states counts toward an argument for sexual selection (Padian and Horner Reference Padian and Horner2011a,Reference Padian and Hornerb, Reference Padian and Horner2013, Reference Padian and Horner2014a,Reference Padian and Hornerb). However, assuming sexual dimorphism sensu lato, the requirements are not nearly so strict, and a simple demonstration of positive allometry may be admissible (Tomkins et al. Reference Tomkins, LeBas, Witton, Martill and Humphries2010; Knell et al. Reference Knell, Naish, Tomkins and Hone2013b; Hone et al. Reference Hone, Wood and Knell2016b). Positive allometry in the absence of dimorphism has been attributed to mutual sexual selection (Hone et al. Reference Hone, Naish and Cuthill2012).
In spite of these prior disputes, what remains uncontroversial is that sexual dimorphism (however defined) typically results from sexual selection. Therefore, the identification of sexual dimorphism in the fossil record can yield important insights into the role that sexual selection has played in the history of life. Sexual dimorphism has, indeed, been attributed to various fossil metazoans, including trilobites (Knell and Fortey Reference Knell and Fortey2005), ammonites (Callomon Reference Callomon1963), mammals (Van Valkenburgh and Sacco Reference Van Valkenburgh and Sacco2002), and birds (Chinsamy et al. Reference Chinsamy, Chiappe, Marugán-Lobón, Chunling and Fengjiao2013; Handley et al. Reference Handley, Chinsamy, Yates and Worthy2016), among others (Westermann Reference Westermann1969). However, recognizing sexual dimorphism in fossil organisms is replete with difficulties, owing to the limitations of a priori sexual identification and issues of ruling out confounding sources of morphological variation. What follows is an investigation into some of the common approaches used to identify sexual dimorphism in the fossil record, using nonavian dinosaurs (hereafter, simply “dinosaurs”) as a study model. Dating back to the early considerations of Nopcsa (Reference Nopcsa1929), dinosaurs have featured prominently in discussions about sexual dimorphism in the fossil record (Chapman et al. Reference Chapman, Weishampel, Hunt and Raskin-Gutman1997; Isles Reference Isles2009; Dodson Reference Dodson2011; Table 1) and serve to highlight the methodological shortcomings underpinning many common approaches. These issues are briefly discussed in the following sections, before a more rigorous approach is presented. This approach reveals just how difficult it can be to detect sexual dimorphism in the fossil record, and highlights the need for more integrative approaches going forward.
Table 1 Purported examples of sexual dimorphism in the fossil record of Dinosauria. Asterisk (*) denotes study formally reevaluated here. Abbreviations: ANOVA, analysis of variance; MANOVA, multivariate analysis of variance; PCA, principal components analysis; PCO, principal coordinates analysis; RMA, reduced major axis regression.

Issues of Sample Size
Sample size matters when attempting to positively identify sexual dimorphism in a fossil species (Rozhdestvensky Reference Rozhdestvensky1965; Plavcan Reference Plavcan1994; Kościński and Pietraszewski Reference Kościński and Pietraszewski2004). Some purported examples of sexual dimorphism in fossil taxa have relied on sample sizes of just two (e.g., Sternberg Reference Sternberg1927; Carpenter et al. Reference Carpenter, Hayashi, Kobayashi, Maryańska, Barsbold, Sato and Obata2011; Persons et al. Reference Persons, Funston, Currie and Norell2015). However, given that no two individuals are exactly alike, it is a truism that two individuals will be dimorphic. Many more alleged examples of sexual dimorphism are based on sample sizes of less than 10 (e.g., Gingerich Reference Gingerich1981; Deng Reference Deng2005; Sanchez et al. Reference Sanchez, Quiralte, Morales, Azanza and Pickford2010; Lü et al. Reference Lü, Unwin, Deeming, Jin, Liu and Ji2011; Table 1), which is insufficient for statistical purposes (Kościński and Pietraszewski Reference Kościński and Pietraszewski2004). To validate the dimorphism hypothesis, a sample must be composed of multiple specimens that consistently express the dimorphic character, ideally more often than would be expected due to chance alone.
Issues of Control
The ability to convincingly demonstrate sexual dimorphism in the fossil record is contingent on the control of confounding sources of variation, including interspecific and individual differences, ontogeny, taphonomic processes and diagenesis, geography, and pathology. However, with few exceptions, this is rarely done, leading to spurious claims of sexual dimorphism. Examples of such claims may include instances of vertebral fusion (Rothschild and Berman Reference Rothschild and Berman1991; Rinehart et al. Reference Rinehart, Lucas, Heckert, Spielmann and Celeskey2009) and variation in vertebral count (Galton Reference Galton1999), both of which are known to vary individually in modern taxa (Danforth Reference Danforth1930; Asher et al. Reference Asher, Lin, Kardjilov and Hautier2011; VanBuren and Reference VanBuren and EvansEvans in press). Claims of sexual dimorphism in ceratopsids (Sternberg Reference Sternberg1927; Lehman Reference Lehman1990) and hadrosaurids (Nopsca Reference Nopcsa1929; Dodson Reference Dodson1975; Hopson Reference Hopson1975; Weishampel Reference Weishampel1981) have been shown to be untenable due to the stratigraphic isolation of the dimorphs, suggesting species differences instead (Ryan and Evans Reference Ryan and Evans2005; Evans Reference Evans2007; Mallon and Holmes Reference Mallon and Holmes2006). Ontogeny is particularly important to consider, because individuals can continue to gain mass even after having reached skeletal maturity, conceivably resulting in size dimorphism (Padian and Horner Reference Padian and Horner2013). Many studies account for ontogeny using a superficial age proxy (e.g., body size, osteological fusion, bone surface texture), but none of these proxies are foolproof (Hone et al. Reference Hone, Farke and Wedel2016a). No study of sexual dimorphism in dinosaurs to date has incorporated skeletochronological age determination; those studies that have determined the skeletochronological age of specimens (e.g, Horner and Padian Reference Horner and Padian2004; Klein and Sander Reference Klein and Sander2007; Woodward et al. Reference Woodward, Freedman Fowler, Farlow and Horner2015) have not identified gross skeletal features that would help to establish the sex to which the specimens belonged.
Issues of Methodology
A problem common to many quantitative studies of fossil taxa is that they inherently assume dimorphism rather than test for it. This is true of some of the most common and widely advocated methods used for detecting sexual dimorphism in anthropology (e.g., means method, coefficient of variation method, assigned resampling method) (Plavcan Reference Plavcan1994), where dimorphism is presupposed on grounds of phylogenetic inference (Bryant and Russell Reference Bryant and Russell1992; Witmer Reference Witmer1995) and the degree to which it is manifested is quantified. Although these methods are not often used outside anthropology, a comparable approach has regularly been adopted within vertebrate paleontology (e.g., Dodson Reference Dodson1976; Cheng et al. Reference Cheng, Holmes, Wu and Alfonso2009; Barden and Maidment Reference Barden and Maidment2011): (1) plot the morphometric data in a histogram or a bivariate space (e.g., log-log or ordination plots); (2) visually inspect the data for evidence of bimodal clustering (possibly with the aid of cluster analysis); (3) if clustering is observed, subject the clusters to some statistical test (e.g., t-test, Mann-Whitney U-test, multivariate analysis of variance [MANOVA]) to confirm their disparity; (4) if significance is achieved, conclude dimorphism. However, this approach is inappropriate as a test of the dimorphism hypothesis because even two arbitrary samples drawn from either tail of a unimodal distribution can differ significantly (Fig. 1). What is needed, then, is to show that the population is best modeled by a bimodal distribution, for which mixture modeling is most suitable (Godfrey et al. Reference Godfrey, Lyon and Sutherland1993; Josephson et al. Reference Josephson, Juell and Rogers1996; Dong Reference Dong1997). Of course, even if the sample is demonstrably dimorphic, there remains further testing to do to rule out nonsexual sources of dimorphism (see earlier section “Issues of Control”).
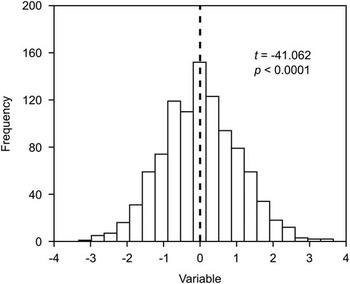
Figure 1 Samples drawn from either side of an arbitrarily divided (dashed line) unimodal distribution (n=1000) can still differ significantly, as demonstrated here using a t-test.
Institutional Abbreviations
DMNS, Denver Museum of Nature and Science, Denver, Colorado, U.S.A.; NHMUK, Natural History Museum, London, United Kingdom; USNM, Smithsonian Institution National Museum of Natural History, Washington, D.C., U.S.A.
Materials and Methods
Data
Of the many studies that posit sexual dimorphism in dinosaurs, only a handful provide the data necessary to rigorously test this hypothesis (Table 1). These data form the basis of the present analysis. The nine surveyed species correspond to various parts of the dinosaur phylogenetic tree, including theropods (Coelophysis bauri, C. rhodesiensis, Allosaurus fragilis, Tyrannosaurus rex), sauropodomorphs (Plateosaurus sp.), stegosaurs (Stegosaurus mjosi, Kentrosaurus aethiopicus), pachycephalosaurs (Stegoceras validum), and ceratopsians (Protoceratops andrewsi). The data are derived from both linear measurements and geometric morphometrics and relate primarily to the skull and appendicular skeleton.
Approach
All of the aforementioned studies include large compilations of linear measurements or landmark data; however, the hypothesized examples of sexual dimorphism are usually based on a subset of these data, such as particular linear variables or ordination scores. When testing these previous hypotheses, it is not enough to simply consider the same specific subset of data treated by the original study, because a failure to support its findings would only demonstrate that sexual dimorphism does not exist as posited by that study. The total data set must also be assessed more generally, should a truly dimorphic signal have gone unrecognized. Therefore, the published data were assessed in both the specific and general senses to more adequately test the hypothesis of sexual dimorphism.
The data were generally log-transformed prior to testing, unless the purported dimorphic signal specifically stemmed from untransformed data, in which case the benefit of the doubt was granted, and the untransformed data set was used. In cases involving bivariate data, the residuals of reduced major axis regression were used. In the general test cases, missing data were imputed using Bayesian principal components analysis (PCA), which functions well with morphological data (Brown et al. Reference Brown, Arbour and Jackson2012). The imputed data set was then subjected to PCA to facilitate study via reduced dimensionality. PCA of the variance–covariance matrix was used when the variables were of the same unit; PCA of the correlation matrix was used when the units differed (Hammer and Harper Reference Hammer and Harper2001). Only those principal components accounting for ≥5% of the total variance were subjected to statistical testing. Although all specimens were included in the regression and ordination calculations, immature specimens (if identified a priori) were excluded from subsequent tests under the premise that sexual dimorphism was most likely to be expressed among mature individuals.
A workflow was designed to test the sexual dimorphism hypothesis in sequential, complementary steps. First, the variable of interest was tested for normality using the commonly employed Shapiro-Wilk (Shapiro and Wilk Reference Shapiro and Wilk1965) and Anderson-Darling (Anderson and Darling Reference Anderson and Darling1952) tests. If nonnormality could not be rejected, the variable was then subjected to Hartigan’s dip test for unimodality (Hartigan and Hartigan Reference Hartigan and Hartigan1985). Dip-test p-values were computed using 10,000 Monte Carlo replicates. Failing rejection of unimodality, the number of normal distributions that best fit the data was determined using mixture analysis paired with the Akaike information criterion (AIC; Akaike Reference Akaike1973) for model selection.
Missing value imputation was performed in R, Version 3.1.2 (R Core Team 2014) using the ‘pcaMethods’ package (Stacklies et al. Reference Stacklies, Redestig, Scholz, Walther and Selbig2007). The normality and unimodality tests were conducted in R, Version 3.1.2 using the ‘nortest’ (Gross and Ligges Reference Gross and Ligges2015) and ‘diptest’ packages (Maechler Reference Maechler2015), respectively. All other analyses were run with PAST, Version 2.17b (Hammer et al. Reference Hammer, Harper and Ryan2001).
Results
Specific Tests
Formal testing of those specific cases of sexual dimorphism reveals no evidence for dimorphism (sexual or otherwise) in any of the nine species examined (Fig. 2). Several species (Plateosaurus sp., Stegoceras validum, Pr. andrewsi, A. fragilis, Stegosaurus mjosi) are characterized by nonnormal distributions that are nevertheless unimodal. More specific details for each species are provided in Supplementary File 1, and the raw data are given in Supplementary File 2.
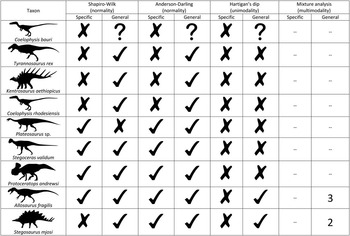
Figure 2 Summary of results. Check mark (✓) indicates passed test (i.e., significantly nonnormal or nonunimodal distribution of morphometric data), X indicates failed test (i.e., not significantly nonnormal or nonunimodal distribution of morphometric data), question mark (?) indicates inability to perform test due to missing morphometric data. Numbers correspond to the number of normal distributions (i.e., groups) that best fit the data (using the Akaike information criterion). Silhouette credits: A. Farke (Protoceratops, Stegosaurus), S. Hartman (Allosaurus, Plateosaurus, Stegoceras, Tyrannosaurus), E. Willoughby (Coelophysis, Kentrosaurus).
General Tests
Most of the surveyed taxa are demonstrably nonnormal in at least one principal component (PC), but few pass Hartigan’s dip test for unimodality (Fig. 2). These results echo those recovered previously for Pr. andrewsi (Maiorino et al. Reference Maiorino, Farke, Kotsakis and Piras2015) and Stegoceras validum (Goodwin Reference Goodwin1990; Schott et al. Reference Schott, Evans, Goodwin, Horner, Brown and Longrich2011). The Coelophysis bauri data set of Rinehart et al. (Reference Rinehart, Lucas, Heckert, Spielmann and Celeskey2009) is too incomplete to facilitate general multivariate analysis. In A. fragilis, only dentary size (approximated by PC 1, which is characteristically loaded positively and subequally by all linear variables) is demonstrably nonunimodal. Mixture modeling reveals that the population is best modeled by three normally distributed groups (AIC=18.2), not two. This finding is consistent with various interpretations, including a population consisting of three cohorts or one consisting of nonadults and sexually dimorphic adults; these competing hypotheses are presently underdetermined by the available data. Notably, other studies of variation in A. fragilis have failed to find evidence for sexual dimorphism (Loewen Reference Loewen2009; Carpenter Reference Carpenter2010).
Scrutiny of Saitta’s (Reference Saitta2015) original PC scores for Stegosaurus mjosi plate shape reveals that only PC 2 is nonnormally distributed. This axis is loaded most heavily by plate inclination. Mixture analysis shows that the distribution of PC 2 is best modeled by two normal curves (AIC=−5.85) of highly disparate standard deviation (0.011 vs. 0.889) and group numbers (~3:1 ratio) (Fig. 3). These findings support the hypothesis of dimorphism in the dermal plates of Stegosaurus mjosi, but there is little reason to think that this dimorphism is sexual in nature. Rather, as shown by Saitta (Reference Saitta2015: Supplemental Fig. S6), plate inclination shifts abruptly posteriorly between plates 8 and 9 in Stegosaurus stenops (Fig. 3), making this within-individual variation the most probable source of the dimorphism in the Stegosaurus mjosi sample.
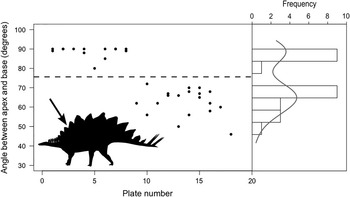
Figure 3 Relationship between plate number and plate angle in Stegosaurus. If the data set of Saitta (Reference Saitta2015) is truly dimorphic, this dimorphism likely represents within-individual variation, as plate angle shifts abruptly between plates 8 and 9 (indicated by arrow) in articulated specimens (NHMUK PV R36730, DMNS 2818, and USNM 4934). Solid gray line indicates kernel density estimate. Modified from Saitta (Reference Saitta2015: Supplemental Fig. S6). Silhouette credit: A. Farke.
Discussion
Kościński and Pietraszewski (Reference Kościński and Pietraszewski2004) documented seven methods for measuring sexual dimorphism in the fossil record; however, many of these methods beg the question in favor of sexual dimorphism by working under the premise that it exists. Only mixture modeling methods are free from this assumption and should be used to study sexual dimorphism in the fossil record (unless there is sufficient warrant from phylogenetic inference that sexual dimorphism should be present). The use of model selection criteria, such as the AIC used here, provides a statistical means to test the sexual dimorphism hypothesis. Such a conservative approach is subject to type II error, but this is preferable to attributing sexual dimorphism to every perceived instance of intraspecific variation in the fossil record, particularly if there is no compelling reason to think it should exist in the first place.
Although there is no support for sexual dimorphism in any of the taxa examined here, it is fallacious to conclude that dinosaurs were therefore not sexually dimorphic. In fact, there may be good reason to suspect they were, given the evidence for sexual dimorphism in crocodylians (Webb and Messel Reference Webb and Messel1978; Allsteadt and Lang Reference Allsteadt and Lang1995; Prieto-Marquez et al. Reference Prieto-Marquez, Gignac and Joshi2007; Platt et al. Reference Platt, Rainwater, Thorbjarnarson, Finger, Anderson and McMurry2009) and birds (e.g., Darwin Reference Darwin1871; Ward Reference Ward1965; Livezey and Humphrey Reference Livezey and Humphrey1984; Goymann et al. Reference Goymann, Makomba, Urasa and Schwabl2015), the closest living relatives of dinosaurs (Bryant and Russell Reference Bryant and Russell1992; Witmer Reference Witmer1995). It is only true that sexual dimorphism has not yet been unambiguously demonstrated in dinosaurs or in many other fossil vertebrates. Such a signal, if it exists, is undoubtedly masked by the obfuscating effects of time-averaging, preservational biases, diagenetic processes, and small sample sizes. Bonnan et al. (Reference Bonnan, Farlow and Masters2008) demonstrated that ontogeny and individual variation likewise mask sexual dimorphism in the femur shape of Alligator mississippiensis (American alligator).
This raises the question: To what extent can we expect to be able to identify sexual dimorphism in the fossil record, without the benefit of prior sexual determination? To address this question, mixture modeling was applied to a data set of A. mississippiensis pelvic measurements (Prieto-Marquez et al. Reference Prieto-Marquez, Gignac and Joshi2007) and Centropus superciliosus (white-browed coucal bird) body mass measurements (Goymann et al. Reference Goymann, Makomba, Urasa and Schwabl2015), ignoring sex as a discriminant factor. Although these species are known to be sexually dimorphic with respect to these characters, such dimorphism is undetectable using mixture modeling (Fig. 4), particularly in the case of C. superciliosus, for which the histogram exhibits only a single obvious peak. It therefore follows that, in the absence of a priori knowledge of sex, the ability to detect dimorphism in a fossil sample is likely only in cases of strongly expressed dimorphism (i.e., well-separated peaks on a histogram or discrete character states); weakly expressed dimorphism, where the sexes overlap considerably in morphospace, may be impossible to discriminate in the fossil record (Kościński and Pietraszewski Reference Kościński and Pietraszewski2004). Mathematical modeling by Godfrey et al. (Reference Godfrey, Lyon and Sutherland1993) showed that sexual mean differences as great as 28% may not manifest as bimodality for sample sizes as large as 100. The situation is much worse for small sample sizes (~10), in which sexual mean differences of up to 47% may not be detectable. Similar results were reported by Plavcan (Reference Plavcan1994) using Cercopithecus (guenon) canine dimensions.

Figure 4 Histograms depicting sexually dimorphic traits in (A) Alligator mississippiensis (data from Prieto-Marquez et al. Reference Prieto-Marquez, Gignac and Joshi2007) and (B) Centropus superciliosus (data from Goymann et al. Reference Goymann, Makomba, Urasa and Schwabl2015). Although the ratio of pelvic canal depth:width is sexually dimorphic in A. mississippiensis, this dimorphism is difficult to demonstrate if the sexes are not known a priori. The same is true of body mass distribution in C. superciliosus. Gray line indicates kernel density estimate of the entire distribution. Abbreviations: A-D, Anderson-Darling test; S-W, Shapiro-Wilk test.
The ability to morphologically discriminate the sexes is greatly enhanced if they are known a priori. Unambiguous indicators of sex are known for various fossil groups by way of eggs or embryos preserved within the body cavities of females (e.g., O’Harra Reference O’Harra1930; Caldwell and Lee Reference Caldwell and Lee2001; Cheng et al. Reference Cheng, Wu and Ji2004; Sato et al. Reference Sato, Cheng, Wu, Zelenitsky and Hsiao2005; Zelenitsky et al. Reference Zelenitsky, Therrien, Joyce and Brinkman2008). However, such rare finds are almost entirely dependent on chance. Sex has recently become possible to determine through histological and biochemical techniques. Schweitzer et al. (Reference Schweitzer, Wittmeyer and Horner2005) reported on the presence of medullary bone in the femur of T. rex. Such endosteal tissue consists of vascularized, nonstructural woven bone and is known to occur definitively only in gravid female birds (Schweitzer et al. Reference Schweitzer, Elsey, Dacke, Horner and Lamm2007, Reference Schweitzer, Zheng, Zanno, Werning and Sugiyama2016). It is likely used as a source of calcium during egg production (Bonucci and Gherardi Reference Bonucci and Gherardi1975). Schweitzer et al. (Reference Schweitzer, Zheng, Zanno, Werning and Sugiyama2016) have further cemented the identification of this specialized tissue in T. rex using molecular fingerprinting, assuaging concerns that it may be pathological in origin (Chinsamy and Tumarkin-Deratzian Reference Chinsamy and Tumarkin‐Deratzian2009). Examples of medullary bone have since been found in other dinosaurs (Lee and Werning Reference Lee and Werning2008; Hübner Reference Hübner2012; Chinsamy et al. Reference Chinsamy, Chiappe, Marugán-Lobón, Chunling and Fengjiao2013).
A priori knowledge of sex facilitates the use of more powerful analyses for detecting sexual dimorphism, such as discriminant function analysis, and this combined approach may be the way forward. Yet it is not without complication. The absence of eggs, embryos, or medullary bone in a fossil vertebrate is not positive evidence against its being female; only positive evidence against its being gravid. As such, discriminating males from nongravid females remains problematic. With a large enough sample size, it is conceivable that morphologies consistently associated with gravid females might enable the development of a “search image” that can then be used to separate the remaining nongravid females from the males.
Acknowledgments
I thank N. Alfonso, B. Borkovic, N. Campione, T. Cullen, P. Dodson, B. Hedrick, R. Holmes, P. Larson, K. Padian, and A. Russell for valuable discussion. D. Hone commented on an early version of the paper. Thanks to all authors cited herein for making their data available through either publication or personal request. S. Rufolo painstakingly converted published data into a usable format. D. Fraser helped with troubleshooting in R. Helpful comments were provided by P. Barrett and two anonymous reviewers, and C. Badgley offered valuable editorial assistance. Dinosaur silhouettes were sourced from phylopic.org. This research was supported by funding from the Canadian Museum of Nature.
Supplementary Material
Data available from the Dryad Digital Repository: http://dx.doi.org/10.5061/dryad.8f6d2


