Herbicide resistance is a major threat to the sustainability of modern cropping systems, with 471 unique cases now being reported worldwide (Heap Reference Heap2016). Herbicide resistance can be broadly divided into target-site resistance (TSR) and non–target-site site resistance (NTSR) (Délye et al. Reference Délye, Jasieniuk and Le Corre2013a; Powles and Yu Reference Powles and Yu2010). TSR is monogenically inherited and is caused by mutations in target sites of the herbicide, while NTSR is generally assumed to be polygenically inherited, although monogenic NTSR does exist (Délye et al. Reference Délye, Jasieniuk and Le Corre2013a; Yuan et al. Reference Yuan, Tranel and Stewart2007). Both TSR and NTSR have been reported in blackgrass populations (Brazier et al. Reference Brazier, Cole and Edwards2002; Délye Reference Délye2005).
As one of the most common grass weeds, blackgrass can cause up to 45% yield reduction in winter wheat (Triticum aestivum L.) (Vizantinopoulos and Katranis Reference Vizantinopoulos and Katranis1998). Importantly, it is ranked among the 15 most important herbicide-resistant weeds worldwide (Heap Reference Heap2016). In Europe, blackgrass is the number one herbicide-resistant weed, with confirmed resistance to many herbicides, including, chlorotoluron, isoproturon, fenoxaprop-P, clodinafop-propargyl, flupyrsulfuron-methyl-sodium, mesosulfuron+iodosulfuron, fluazifop-P, propaquizafop, and cycloxydim (Lutman et al. Reference Lutman, Moss, Cook and Welham2013). Recently, the resistance status of Danish resistant blackgrass populations collected during the last decade were tested, and both TSR and NTSR mechanisms were found within populations, with NTSR being most prevalent (Keshtkar et al. Reference Keshtkar, Mathiassen, Moss and Kudsk2015). One of the NTSR populations was used in the present study.
According to evolutionary theory, it is assumed that herbicide resistance, as an adaptive defense mechanism, is often associated with a fitness cost in the absence of herbicide (the so-called cost of adaptation) (Vila-Aiub et al. Reference Vila-Aiub, Neve and Powles2009, Reference Vila-Aiub, Neve and Roux2011). Therefore, the frequency of resistant alleles within a population would be expected to decline after some generations in the absence of selection pressure caused by herbicide applications. Nevertheless, a long-term field experiment showed that resistance to acetyl-CoA carboxylase (ACCase) inhibitors was present in a resistant rigid ryegrass (Lolium rigidum Gaudin) population 7 yr after the use of ACCase-inhibitor herbicides was abandoned (Collavo et al. Reference Collavo, Strek, Beffa and Sattin2013). Herbicide resistance fitness costs are not universal, and their expression depends on particular plant mutations and may only be expressed in certain environments (Lehnhoff et al. Reference Lehnhoff, Keith, Dyer and Menalled2013a; Vila-Aiub et al. Reference Vila-Aiub, Neve and Powles2009). This means it is necessary to quantify the fitness of each herbicide resistance case individually (Lehnhoff et al. Reference Lehnhoff, Keith, Dyer and Menalled2013a).
In 75% of published fitness studies, genetic background of populations was not taken into account (Vila-Aiub et al. Reference Vila-Aiub, Neve and Powles2009). The fitness studies comparing susceptible (S) and resistant (R) populations originating from different geographical locations are imperfect, as different populations might reveal high genetic diversity at a number of loci in addition to a resistant locus or loci. These results cannot be clearly interpreted from a scientific standpoint or a weed management point of view. It should, however, be noted that even though selecting R and S plants with close genetic background is one of the most important steps in fitness studies (Holt Reference Holt1990; Menchari et al. Reference Menchari, Chauvel, Darmency and Délye2008; Vila-Aiub et al. Reference Vila-Aiub, Neve and Powles2005a), results of studies using isogenic R and S lines may not be representative of fitness of resistant phenotypes in natural conditions, as genetic diversity is common in weed field populations (Lehnhoff et al. Reference Lehnhoff, Keith, Dyer, Peterson and Menalled2013b). Therefore, when the aim of a fitness study is to detect differences between R and S populations and apply the results in an herbicide-resistant weed management program, it may be more appropriate to select R and S plants within the target field, as we did in the present study.
In fitness studies comparing the performance of S and R phenotypes under competitive conditions, the two parameters most frequently recorded are biomass and seed production. We did not, however, find any vegetative and fecundity fitness cost with an NTSR blackgrass phenotype, whether grown alone or in competition with winter wheat in a replicated greenhouse experiment (Keshtkar Reference Keshtkar2015). This prompted us to study other plant physiology processes in more detail, in particular seed germination and seedling emergence. Despite its importance, germination has only been studied in 7% of the published fitness studies (Vila-Aiub et al. Reference Vila-Aiub, Neve and Powles2009). Seedling emergence can, among other things, be affected by burial depth, soil temperature, and seed size (Keshtkar et al. Reference Keshtkar, Kordbacheh, Mesgaran, Mashhadi and Alizadeh2009), but the effects of these factors on germination and seedling emergence of R and S plants have rarely been studied. To our knowledge, only one study evaluated effects of burial depth and temperature regimes on NTSR and S plants with a closely related genetic background, and this study showed that seedling emergence was lower in NTSR rigid ryegrass (Vila-Aiub et al. Reference Vila-Aiub, Neve, Steadman and Powles2005b).
The objective of this study was to assess germination and seedling emergence in an NTSR blackgrass population resistant to several herbicides and not bearing any of the known TSR mutations under contrasting temperature regimes and different sowing depths.
Materials and Methods
Plant Material
A fenoxaprop-P resistant blackgrass population (ID914) that originated in the central part of Denmark, Funen (54.956°N, 10.611°E), was used in this study. In our previous study, it was confirmed that this population not only was highly resistant to fenoxaprop-P (resistance index [RI]>64), but also showed various levels of resistance to pendimethalin (RI>10), prosulfocarb (RI>2.5), and flupyrsulfuron-methyl-sodium (RI>10.5) (Keshtkar et al. Reference Keshtkar, Mathiassen, Moss and Kudsk2015). As herbicides with four different sites of action failed to control the plants and, importantly, genotyping did not confirm known mutations in the ACCase gene and acetolactate synthase (ALS) gene, the resistance mechanism involved was assumed to be NTSR (Keshtkar et al. Reference Keshtkar, Mathiassen, Moss and Kudsk2015).
The issue with herbicide-resistant blackgrass was detected some years before the experiment was initiated. The seed sample was collected in 2011 from untreated plots within a winter wheat field experiment in which plants survived herbicide treatments with prosulfocarb, flupyrsulfuron-methyl-sodium + diflufenican, clodinafop-propargyl, pyroxsulam, and mesosulfuron+ iodosulfuron. Seeds were collected from approximately 20 individual plants within 20 m2. The seeds were used to produce S and R plants.
In November 2011, around 400 seeds of the parent population were grown in plastic boxes (45 by 45 by 12 cm) filled with a potting mixture consisting of soil (sandy loam with 12% clay, 6.5% silt, 80% sand, 1.5% organic matter), peat (Kekkilä, Finland), and sand (Dansand, Denmark) (2:1:1 w/w) containing all necessary micro- and macronutrients (0.11% nitrogen, 0.04% phosphorus, and 0.07% potassium).
The plants were kept in a greenhouse at 17/10±2 C and 14/10-h day/night cycle with supplemental light (180 µmol m−2 s−1). A plant-cloning technique, the single-population protocol described by Pedersen et al. (Reference Pedersen, Neve, Andreasen and Powles2007) and Vila-Aiub et al. (Reference Vila-Aiub, Neve, Steadman and Powles2005b), was used to select S and R plants within the population. Briefly, at the 2- to 3-tiller stage, seedlings were excavated from the boxes and one tiller (clone) was carefully excised from the parent plant. The clones were trimmed to 2 cm of shoot and 2 cm of root and then were separately transplanted into 1-L pots filled with the potting mixture described earlier. The parent plants were also transplanted into 2-L pots. Parent plants and their corresponding clones were tagged to identify origin. When the clones reached the 3- to 4-leaf stage, they were sprayed with the field recommended rate of fenoxaprop-P (69 g ai ha−1). Four weeks after herbicide treatment, the clones were classified as S (dead plants), partly resistant (PR, alive but no regrowth), and R (alive and vigorously regrowing) with frequencies of 1.5% (S), 14.0% (PR), and 84.5% (R), respectively.
The parent plants were kept in a cold greenhouse (2 C) for vernalization (Chauvel et al. Reference Chauvel, Munier-Jolain, Grandgirard and Gueritaine2002), and they were identified according to their corresponding clones. The PR parent plants were discarded, while the S and R parent plants were used for seed multiplication. To prevent cross-pollination between S and R parent plants, each subpopulation was surrounded by a polyethylene pollen-proof enclosure until seed maturity in mid-July 2012.
As pointed out by Vila-Aiub et al. (Reference Vila-Aiub, Neve, Steadman and Powles2005b), the often unavoidable smaller sample size of the S phenotype, which may result in a more narrow genetic background, will not affect the results, as the main objective of the present study was to detect fitness cost that potentially could be used as a herbicide-resistance management tool. However, to increase the uniformity of the genetic background within each subpopulation and to obtain sufficient seeds, F1 seeds of each subpopulation (n=16 plants) were sown in November 2012, grown in the greenhouse to maturity, and bulk crossed in pollen-proof plastic enclosures to produce F2 seeds. Seeds were harvested in mid-July 2013. To increase germinability and break primary seed dormancy, the seeds were subjected to a high temperature (35±2 C) for 6 wk. Then they were stored dry for 7 mo at a constant temperature of 4 C until the onset of the experiment.
Resistance Patterns of the Subpopulations
A dose–response experiment was conducted to determine resistance status of the two subpopulations. Seeds of each subpopulation were sown separately in 2-L pots. Pots were filled with the potting mixture described earlier. The pots were arranged in a completely randomized design with three replications per treatment in a greenhouse at 17/10 ± 2 C and 14/10-h day/night cycle with supplemental light (180 µmol m−2 s−1). The pots, each containing 6 seedlings, were sprayed at the 3- to 4-leaf stage with three ACCase-inhibitor herbicides and one ALS-inhibitor herbicide. Different dose ranges of herbicides were used for the S and R subpopulations based on previous experience (Table 1; data not shown). All spray solutions were prepared in deionized water and applied using a laboratory pot sprayer fitted with two Hardi® ISO F-110-02 nozzles (Hardi, Nørre Alslev, Denmark). The nozzles were operated at a pressure of 310 kPa and a speed of 5.5 km h−1 delivering a spray volume of 150 L ha−1. The plants were harvested 3 wk after treatment, and fresh weight of aboveground plant material was recorded. The plant material was dried at 80 C for 48 h, and the dry weight was recorded.
Table 1 Herbicides and rates applied in the dose–response experiment. The S and R subpopulations were isolated within a non–target-site resistant blackgrass population (ID914).
a OD, oil dispersion; EC, emulsifiable concentrate; WG, wettable granules.
Molecular Characterization of the Subpopulations
Twenty seeds of each of the two subpopulations and their parent populations were grown as described earlier. Leaf material from 8 individual plants from the plants that grew from the twenty seeds was analyzed for the five ACCase mutations identified in blackgrass (Ile-1781-Leu, Trp-2027-Cys, Ile-2041-Asn, Asp-2078-Gly, and Gly-2096-Ala) (Délye et al. Reference Délye, Menchari, Guillemin, MatÉJicek, Michel, Camilleri and Chauvel2007) and the two known mutation sites of the ALS gene conferring resistance to ALS inhibitors (Pro-197 and Trp-574) (Tranel et al. Reference Tranel, Wright and Heap2015). The genotyping was done twice for the two subpopulations and once for the parent populations for the ACCase gene, as described in Beffa et al. (Reference Beffa, Figge, Lorentz, Hess, Laber, Ruiz-Santaella and Strek2012). For ALS genotyping, leaf samples from the 8 individual plants from each populationwere harvested for DNA extraction as described by Beffa et al. (Reference Beffa, Figge, Lorentz, Hess, Laber, Ruiz-Santaella and Strek2012), with the following modifications. Leaf tissue (20 mg) was disrupted in 400 μl 100 mM Tris (HCl) and 1 M KCl (pH 9.5) with stainless-steel beads in a swing mill (Retsch 300MM). The 164-bp fragment of the ALS gene containing the sequence for Pro-197 was amplified using the forward and reverse primers F1 (F1: 5′-TCTGCGTCGCCACCTCCG-3′) and R1 (R1: 5′-GGAGCGGGTGACCTCTACTAT-3′), respectively, at a 60 C annealing temperature. After amplification of the above mentioned 164-bp fragment, the pyrosequencing was performed using the primers P1 (primer for codon position 1: 5′-ATGGTCGCCATCACGGGGCAGGTT-3′) and P2 (primer for codon position 2: 5′-ATGGTCGCCATCACGGGGCAGGTT-3′). Similarly, in order to detect a mutation at Trp-574, the 376-bp fragment of ALS was amplified using the forward and reverse primers, F2 (F2: 5′-ATTCAGGAGTTGGCACTGATT-3′) and R2 (R2: 5′-AAGAAACCCTGCCATCACCG-3’) at an annealing temperature of 57 C, which was followed by pyrosequencing using the primer 5′-CAACATCTAGGAATGGTGGTGCAG-3′.
Effect of Temperature on Seed Germination
Fifty uniformly sized seeds of the S and R subpopulations (1,000-kernel weight [n=400 seeds lot−1]: S=1.9±0.06 g; R=1.8±0.05 g) were selected and placed in 9-cm petri dishes containing three layers of cellulose filter papers (Whatman No. 1) covered by one glass-fiber filter paper (Whatman GF/A). The petri dishes were placed in zipped polythene bags to avoid loss of water by evaporation. The petri dishes were arranged in a completely randomized design with four replicates in a growth chamber at 14/10-h day/night photoperiods with a photosynthetic photon flux density of 175 µmol m−2 s−1. Germination rate of seeds was evaluated under two alternating temperature regimes: 17/10 C and 10/5 C (day/night). The experiment was conducted twice. The two temperature regimes mimic the range of soil temperatures corresponding to an early (September) and late (October) sowing of winter wheat in Denmark, respectively. Germinated seeds were recorded at consecutive inspection times until no further germination was observed. The intervals between monitoring ranged from 8 to 96 h, because germination was low at the beginning and final part of the experiments, while germination was high in the middle of the study. The seeds were considered germinated when the radicle was visible.
Effect of Sowing Depth and Temperature on Seedling Emergence
Thirty-six uniformly sized seeds of each subpopulation were sown in square pots (9 by 9 by 9.5 cm) filled with a potting mixture consisting of soil (sandy loam with 12% clay, 6.5% silt, 80% sand, 1.5% organic matter), peat (Kekkilä, Finland), and sand (Dansand, Denmark) (4:1:1 w/w/w). All the bulk particles were removed from the growing medium using a 4-mm sieve. The seeds were seeded at four sowing depths (0, 1, 3, and 6 cm) with a similar distance between seeds within each depth. Seedling emergence of seeds was evaluated under the two alternating temperature regimes described above (17/10 C and 10/5 C (day/night)). The pots were arranged in a completely randomized design with factorial arrangement of treatments (i.e., two subpopulations by four sowing depths by two temperature regimes). There were four replicates per treatment. The pots were subirrigated whenever needed. The seeds on the soil surface (0-cm treatment) were covered with a moistened filter paper to promote imbibition. The moistened filter paper was discarded after the first seedlings emerged. Subsequently, 2 ml of water was added carefully to the soil surface every third day. The pots were grown in a growth chamber as described earlier. Seedling emergence was recorded at consecutive inspection times until no further emergence was observed. The plants were considered emerged when the leaf tip was visible. The experiment was conducted twice.
Statistical Analysis
Resistance Patterns of the Subpopulation
The dry weight for each dose was expressed as a percentage of the untreated control. A four-parameter log-logistic model (Equation 1), as described by Streibig et al. (Reference Streibig, Rudemo and Jensen1993), was fit to the data:
 $$Y\,{\equals}\,c{\plus}{{d\,{\minus}\,c} \over {1{\plus}{\rm exp}\left[ {b\left( {{\rm log}\left( x \right)\,{\minus}\,{\rm log}\left( {\rm ED_{{50}} } \right)} \right)} \right]}}$$
where Y is the dry weight (percentage of untreated), x represents herbicide dosage (g ai ha−1), c is the lower limit (asymptote) of the response curve at high herbicide doses, d is upper limit when herbicide doses are zero, ED50 is the dosage (g ai ha−1) that reduced dry weight by 50% (midway between the d and c values), and b is the slope of the curve around ED50. Wherever the homogeneity of variance was not met for dry weight data, a transform-both-sides technique (Box-Cox data transformation) was used (Carroll and Ruppert Reference Carroll and Ruppert1988; Ritz et al. Reference Ritz, Baty, Streibig and Gerhard2016).
Where possible, an RI was calculated as the ratio of the ED50 of the resistant plants to the corresponding S subpopulation (ED50R/ED50S), and the ratio (RI) was compared to 1 using a t-test.
Seed Germination and Seedling Emergence
Analysis by means of nonlinear mixed-effects regression models is challenging (Ritz et al. Reference Ritz, Kniss and Streibig2015), and it was not possible to use such an analysis for the event-time data (Ritz et al. Reference Ritz, Pipper and Streibig2013). Data were therefore analyzed in a two-step procedure as described and applied in previous studies (Gundel et al. Reference Gundel, Martínez-Ghersa and Ghersa2008; Mennan et al. Reference Mennan, Streibig, Ngouajio and Kaya2012; Ritz et al. Reference Ritz, Pipper and Streibig2013).
First, a three-parameter log-logistic model (Equation 2) was fit to the cumulative seedling emergence according to the event-time approach (Ritz et al. Reference Ritz, Pipper and Streibig2013).
 $$E\left( t \right)\,{\equals}\,{d \over {1{\plus}{\rm exp}\left[ {b\left( {{\rm log}\left( t \right)\,{\minus}\,{\rm log}\left( {\rm T_{{50}} } \right)} \right)} \right]}}{\equals}{d \over {1{\plus}\left( {{\rm t \over {\rm T_{{50}} }}} \right)^{b} }}$$
where E is the cumulative seedling emergence or germination at time t, d is the upper limit parameter representing the percentage germination of the total number of seeds present, T50 is the time to reach 50% of the maximum seedling emergence or germination (d), and b is the slope of the curve at T50 denoting the rate of increase in emergence.
Second, estimates of the two biologically meaningful parameters, d and T50, obtained for each replicate from the event-time model were analyzed using a linear mixed model in which experiments were considered as random effects, while phenotypes, temperature regimes, and sowing depths were considered fixed effects. The estimated standard errors of the d and T50 parameters obtained for each replicate were also used as weights in the linear mixed model. Based on the fitted mixed model, relevant pairwise comparisons were made (estimated differences were compared to 0 by means of post hoc t-tests).
All statistical analysis and plots were done using R statistical software (R Core Team 2014) with the add-on ‘drc’ (Ritz and Streibig Reference Ritz and Streibig2005), ‘lme4’ (Bates et al. Reference Bates, Maechler, Bolker and Walker2014), and ‘multcomp’ (Hothorn et al. Reference Hothorn, Bretz and Westfall2008) packages for event-time models, linear mixed models, and multiple comparisons, respectively.
Results and Discussion
Resistance Pattern of the Subpopulations
Different responses to the four herbicides were observed between the R and S subpopulations (Table 2; Figure S1A–D). The S subpopulation was susceptible to all herbicides. As expected, the R subpopulation was highly resistant to fenoxaprop-P, and it was not possible to estimate an ED50 dose (Figure S1A). At the field recommended rate of fenoxaprop-P (i.e., 69 g ha−1), dry weight of the S subpopulation was reduced by up to 97%, while the corresponding value for the R subpopulation was only 16%.
Table 2 The estimated parameters by the log-logistic model (Equation 1) for herbicide-resistant (R) and herbicide-susceptible (S) subpopulations selected within a non–target-site resistant blackgrass population.Footnote a , Footnote b

a Abbreviations and values: c, lower limit (asymptote) of the response curve at high herbicide doses; d, upper limit when herbicide doses are zero; b, the slope of the curve around ED50; ED50, dosage (g ai ha−1) that reduced dry weight by 50%; RI, resistance index, the ratio of the ED50 of the R plants to the S subpopulation (ED50R /ED50S); nd, not possible to determine; NS, nonsignificant.
b RI and R2 are presented. Standard errors are in parentheses.
** Significant at 0.01 level.
Both subpopulations were controlled by the three other herbicides; however, they showed varying susceptibility. The R subpopulation was significantly more tolerant to clodinafop-propargyl in comparison to the S subpopulation, with a RI value equal to 1.9 (P<0.001) (Table 2; Figure S1B). No significant differences were found in the response of the S and R subpopulations to cycloxydim and flupyrsulfuron-methyl-sodium (Table 2; Figure S1C and D).
Molecular Characterization of Subpopulations
None of the known mutations conferring TSR to ALS- and ACCase-inhibiting herbicides were detected in the two subpopulations or their parental populations, suggesting that the mechanism of resistance is NTSR. A similar result was observed in a previous experiment with seedlings of the parent ID914 population (Keshtkar et al. Reference Keshtkar, Mathiassen, Moss and Kudsk2015).
Effect of Temperature on Seed Germination
Final Germination (Gmax)
The two subpopulations showed similar final germination (the d parameter; hereinafter referred to as Gmax) at both temperature regimes. This means there were no statistically significant differences in Gmax between the R and S subpopulations in any of the temperature regimes (Table 3).
Table 3 Germination parameters of herbicide-resistant (R) and herbicide-susceptible (S) subpopulations under different temperature regimes were estimated by the event-time model (Equation 2), then the estimated parameters were subjected to a linear mixed model.Footnote a

a Standard errors are in parentheses. Different letters show statistically significant differences between mean values of each parameter.
b Final germination=d parameter ×100.
c Germination timing: time to reach 50% of the final germination.
Germination Timing (TG50)
Time to reach 50% of maximum germination (T50 parameter; hereinafter referred to as TG50) was significantly (P<0.001) shorter at optimal compared with low temperature for both subpopulations. On average, TG50 at the low temperature was around two times higher than at the high temperature (approximately 200 and 100 h, respectively). As with the Gmax parameter, there were no significant differences in TG50 between the R and S subpopulations (Table 3).
Several studies have investigated the correlation between herbicide resistance and seed germination traits but have reached different conclusions (Délye et al. Reference Lutman, Moss, Cook and Welham2013b; Park et al. Reference Park, Mallory-Smith, Ball and Mueller-Warrant2004; Vila-Aiub et al. Reference Vila-Aiub, Neve, Steadman and Powles2005b; Wang et al. Reference Wang, Picard, Tian and Darmency2010). This was partly due to the fact that different resistance allele(s) were studied, but the lack of control of the genetic background of the S and R phenotypes also explains this inconsistency (Vila-Aiub et al. Reference Vila-Aiub, Neve and Roux2011). Studies with R and S plants with closely related genetic backgrounds showed lower germination rates or delayed germination in foxtail millet [Setaria italic (L.) Beauv.], blackgrass, and rigid ryegrass plants carrying the Leu-1781 ACCase mutation versus the wild-type gene (Délye et al. Reference Lutman, Moss, Cook and Welham2013b; Vila-Aiub et al. Reference Vila-Aiub, Neve, Steadman and Powles2005b; Wang et al. Reference Wang, Picard, Tian and Darmency2010). In contrast, the Asn-2041 mutation had no effect, while the Gly-2078 mutation increased the speed of germination of blackgrass (Délye et al. Reference Lutman, Moss, Cook and Welham2013b). Ashigh and Tardif (Reference Ashigh and Tardif2009) did not find any differences between four S and four R eastern black nightshade (Solanum ptychanthum Dunal) populations carrying a mutation in an ALS gene (Ala-205-Val). All the studies mentioned investigated the possible effects of TSR (monogenic R) on seed germination and seedling emergence traits.
As pointed out by Délye et al. (Reference Délye, Gardin, Boucansaud, Chauvel and Petit2011), more attention should be directed toward NTSR, due to its unpredictable resistance patterns. However, only one study has evaluated other related phenotypic characteristics of NTSR (pleiotropic effects) using plant materials with almost similar genetic background in an herbicide-resistant weed (rigid ryegrass; Vila-Aiub et al. Reference Vila-Aiub, Neve, Steadman and Powles2005b). Vila-Aiub et al. (Reference Vila-Aiub, Neve, Steadman and Powles2005b) found that germination of NTSR rigid ryegrass plants resistant to diclofop was lower compared with the S phenotype at low constant temperatures (5 and 8 C), while at higher constant and alternating temperatures, no difference was found between S and R phenotypes in their study, which is similar to our results.
Effect of Sowing Depth and Temperature on Seedling Emergence
Final Seedling Emergence (Emax)
Final seedling emergence (d parameter; hereinafter referred to as Emax) decreased significantly with increasing sowing depths at both temperature regimes for both subpopulations (Table 4). Decreasing seedling emergence with increasing sowing depth has been reported for many weed species (Bello et al. Reference Bello, Hatterman-Valenti and Owen2017; Benvenuti et al. Reference Benvenuti, MacChia and Miele2001). Similar to the results for the petri dish experiments, Emax was not affected by temperature.
Table 4 Final seedling emergence for herbicide-resistant (R) and herbicide-susceptible (S) subpopulations selected within a non–target-site resistant blackgrass population under increasing sowing depths and two temperature regimes. The parameters were estimated by fitting the event-time model (Equation 2), then the estimated parameters were subjected to a linear mixed model.Footnote a

a Standard errors are in parentheses. Different letters within each row show statistically significant differences between mean values of each parameter.
b Final seedling emergence=d parameter×100.
However, statistically significant (P<0.01) differences were only noted between the Emax of R and S subpopulations at low temperature across all sowing depths, except for the seeds placed on the soil surface (0 cm). The differences were more pronounced under stressful conditions (i.e., at low temperature and 6-cm sowing depth) than under more favorable conditions (i.e., reduced burial depths: 1 and 3 cm). The Emax of the R subpopulation was around 5-fold lower than that of the S subpopulation at low temperature and 6-cm sowing depth. Vila-Aiub et al. (Reference Vila-Aiub, Neve, Steadman and Powles2005b) reported that the final seedling emergence of NTSR rigid ryegrass was similar to S phenotypes at all sowing depths less than 8 cm, but at 8-cm soil depth, NTSR plants showed lower emergence compared with S plants. Our results confirmed the results found in rigid ryegrass (Vila-Aiub et al. (Reference Vila-Aiub, Neve, Steadman and Powles2005b), as seedling emergence of the R subpopulation was significantly lower (i.e., lower Emax) than the S subpopulation, especially under suboptimal conditions.
Seedling Emergence Timing (TE50)
The time to reach 50% of the maximum emergence (T50 parameter; hereinafter referred to as TE50) increased for both subpopulations with sowing depth greater than 1 cm (Table 5). The TE50 for seeds placed on the soil surface (0 cm) was generally higher than for buried seeds. As in the petri dish experiments, low temperature significantly delayed seedling emergence of both subpopulations. On average, the TE50 was 550 and 300 h at low and optimal temperatures, respectively.
Table 5 Time to reach 50% of seedling emergence for herbicide-resistant (R) and herbicide-susceptible (S) subpopulations selected within a non–target-site resistant blackgrass population under increasing sowing depths and two temperature regimes. The parameters were estimated by fitting the event-time model (Equation 2), then the estimated parameters were subjected to a linear mixed model.Footnote a
a Standard errors are in parentheses. Different letters within each row show statistically significant differences between mean values of each parameter.
b Seedling emergence timing: time to reach 50% of seedling emergence.
Importantly, statistically significant differences between the two subpopulations were observed when the seeds were buried at a 3-cm depth. At 3-cm sowing depth, the R subpopulation emerged around 50 and 13 h later than the S subpopulation under suboptimal and optimal temperature regimes, respectively. However, no statistically significant differences were found between subpopulations in other treatments, except at the 3-cm sowing depth.
Overall, similar trends were observed in the petri dish experiments and pot experiments, with Gmax and Emax of the R subpopulation tending to be lower than those of the S subpopulation and TG50 and EG50 of the R subpopulation also having a tendency to be higher than those of the S subpopulation. However, Emax at all sowing depths, and especially at deep burial depth, was lower than Gmax. This could be due to a lower water potential in the soil, a lower light intensity, or a reduced oxygen content in the pots compared with the petri dishes. However, significant differences in Emax were only observed in pot experiments (buried seeds under low-temperature regimes), which could be attributed to environmental conditions amplifying the difference in seedling emergence between the R and S plants.
Seedling Emergence Inhibition (D 50 )
As previously mentioned, the Emax of both subpopulations decreased with increasing sowing depth. To estimate the sowing depth resulting in a 50% reduction of final emergence (D50) the accumulated number of seedlings emerging (percentage of sown seeds) at all sowing depths were fit against sowing depth using a log-logistic model (Equation 1). As there were no differences between experiments, the data were pooled.
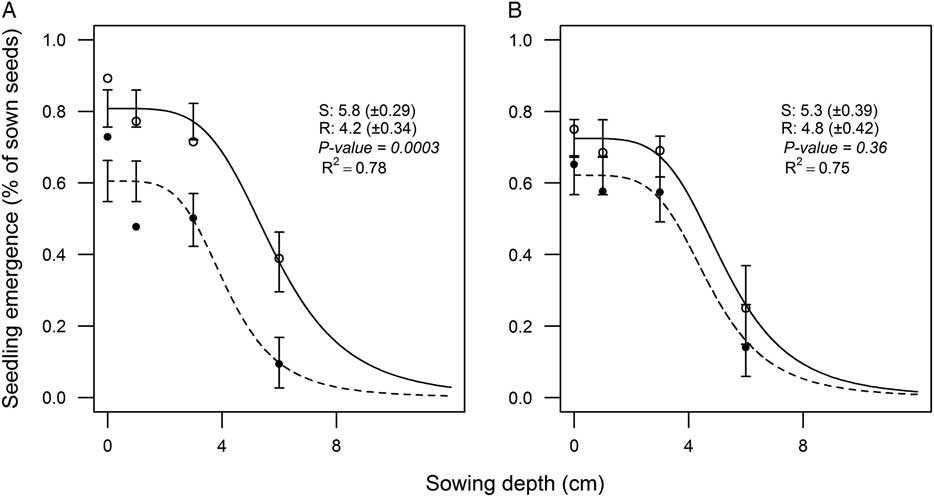
The temperature did not change the D50 parameter for any of the subpopulations (Figure 1A and B). The D50 for the R subpopulation (4.2) was significantly lower than for the S subpopulation (5.8) at low temperature (Figure 1A). Our study is the first to report a lower D50 (higher sensitivity to soil burial) of the R subpopulation compared with the S subpopulation, particularly at suboptimal temperatures.

Figure 1 Influence of sowing depth on final emergence for herbicide-resistant (R; ●) and herbicide-susceptible (S; ○) subpopulations selected within a non–target-site resistant blackgrass population. The accumulated seedling emergence (%) of subpopulations in response to sowing depth at (A) suboptimal (10/5 C) and (B) optimal (17/10 C) temperature regimes estimated by the log-logistic model (Equation 1). Values indicate the estimated D50 (50% reduction of final emergence) for subpopulations. Values in parentheses and vertical bars represent standard errors.
To our knowledge, the report by Vila-Aiub et al. (Reference Vila-Aiub, Neve, Steadman and Powles2005b) was the first study on NTSR fitness in a population with closely related genetic background. The present study is only the second study comparing the germination and seedling emergence of S and NTSR weeds and the first study on blackgrass using a methodology (single-population protocol) attempting to ensure comparable genetic backgrounds. Obviously, the genetic backgrounds of NTSR and S plants cannot be fully controlled.
It is generally agreed that weed seeds collected directly from a field may possess high genetic diversity. But this may not be completely true in the present case, because the parent seeds were collected from 20 individual plants within an experimental field where the herbicide selection pressure had been the same for many years and the occurrence of resistant blackgrass had been known for several years. More importantly, the seeds were collected from an untreated small plot, where random mating in the year of collection added to the homogeneity of the genetic background. It should also be noted that the maximum distance for pollen spread of blackgrass has been found to be 4 m (Petersen et al. Reference Petersen, Dresbach-Runkel and Wagner2010). Adopting the plant-cloning technique to select the R and S subpopulations within a parent population collected within a well-defined area in the field, we claim that the subpopulations will have comparable genetic backgrounds. However, some genetic diversity may still exist, and we therefore referred to the selected R and S clones as “subpopulations,” in contrast to Vila-Aiub et al. (Reference Vila-Aiub, Neve, Steadman and Powles2005b) and Pedersen et al. (Reference Pedersen, Neve, Andreasen and Powles2007), who used the terms “phenotype” and “line.” Nevertheless, as pointed out by Lehnhoff et al. (Reference Lehnhoff, Keith, Dyer, Peterson and Menalled2013b), the remaining diversity within the selected R and S subpopulations mimics the natural field populations. Accordingly, as we selected R and S plants within a field, our results can be more applicable and reliable for resistance management programs than results obtained with selected R and S populations from different geographical locations.
A recent review concluded that moldboard plowing and delayed drilling in autumn can reduce blackgrass population by approximately 69% and 50%, respectively (Lutman et al. Reference Lutman, Moss, Cook and Welham2013). The present study showed that deep sowing and a low-temperature regime mimicking deeper soil tillage and delayed drilling of autumn-sown crops not only influence seedling emergence traits of both subpopulations but also have a potential to increase differences in seedling emergence between R and S subpopulations to the detriment of the R plants.
This implies that postponing the drilling of autumn-sown crops until soil temperatures have decreased not only can lead to lower and later seedling emergence of the R subpopulation, but can also increase the sensitivity of the R subpopulation to burial depth (lower D50), and this can contribute to the fitness penalty of the R subpopulation. It is generally agreed that fitness cost associated with adaptive alleles (e.g., herbicide-resistance alleles) can be increased under stressful conditions (Vila-Aiub et al. Reference Vila-Aiub, Neve and Powles2009). In the absence of herbicides, the lower Emax, D50, and speed of emergence of the R subpopulation can be expected to favor the S subpopulation and eventually result in an increased frequency of the wild-type loci in the population.
Owen et al. (Reference Owen, Michael, Renton, Steadman and Powles2011) concluded that lower germination of herbicide-resistant rigid ryegrass populations is not the direct effect of resistance alleles. Instead, they attributed it to cropping-system selection pressure. However, Délye et al. (Reference Délye, Menchari, Michel, Cadet and Le Corre2013b) and Vila-Aiub et al. (Reference Vila-Aiub, Neve, Steadman and Powles2005b) attributed low germination in ACCase TSR phenotypes of rigid ryegrass and blackgrass to the Leu-1781 ACCase allele (i.e., herbicide selection pressure) in studies where the genetic background of the phenotypes was controlled. From an herbicide-resistance management point of view, no matter which type of selection pressure—cropping system or herbicide resistance—causes a fitness penalty, lower fitness can be used as a resistance management tool.
Further studies are needed, in particular inclusion of additional populations in greenhouse studies and, ultimately, in field studies like the one done by Collavo et al. (Reference Collavo, Strek, Beffa and Sattin2013). The results should be implemented in simulation models to predict the long-term impact of time and depth of soil cultivation on the frequency of resistant individuals in the population. Finally, our results suggest that seed germination and seedling emergence should be assessed in future fitness studies to fully elucidate the differences between S and R plants, a pertinent factor in developing integrated weed management strategies specifically targeting herbicide resistance.
Acknowledgments
E.K. is grateful to the Iranian Ministry of Science, Research, and Technology for granting his Ph.D scholarship and to Christian Ritz, University of Copenhagen, Denmark, for statistical guidance.
Supplementary material
To view supplementary material for this article, please visit https://doi.org/10.1017/wsc.2017.44