


INTRODUCTION
Parasites play important roles in ecosystem function and stability (Hudson et al. Reference Hudson, Dobson and Lafferty2006; Lafferty et al. Reference Lafferty, Dobson and Kuris2006, Reference Lafferty, Allesina, Arim, Briggs, De Leo, Dobson, Dunne, Johnson, Kuris, Marcogliese, Martinez, Memmott, Marquet, McLaughlin, Mordecai, Pascual, Poulin and Thieltges2008) and key to understanding these roles is knowledge of the basic ecology of the parasites, something that is often lacking in sylvatic systems. At high latitudes, host-parasite interactions are likely to be altered by climate change with complex and sometimes unknown consequences (Laaksonen et al. Reference Laaksonen, Pusenius, Kumpula, Venalainen, Kortet, Oksanen and Hoberg2010). Projected increases in annual surface temperature and precipitation levels in the Arctic (Alley et al. Reference Alley, Berntsen, Bindoff, Chen, Chidthaisong, Friedlingstein, Gregory, Hegerl, Heimann, Hewitson, Hoskins, Joos, Jouzel, Kattsov, Lohmann, Manning, Matsuno, Molina, Nicholls, Overpeck, Qin, Raga, Ramaswamy, Ren, Rusticucci, Solomon, Somerville, Stocker, Stott, Stouffer, Whetton, Wood and Wratt2007) are likely to affect the free-living stages of many parasites whose development and survival rates are influenced by environmental temperature and relative humidity (Hoberg et al. Reference Hoberg, Polley, Jenkins, Kutz, Veitch and Elkin2008). Climate warming has already shifted the transmission cycle of Umingmakstrongylus pallikuukensis, a protostrongylid lung nematode of muskoxen (Ovibos moschatus), from a 2-year to a 1-year life cycle (Kutz et al. Reference Kutz, Hoberg, Polley and Jenkins2005) and extreme temperature events in sub-Arctic Fennoscandia have been linked to outbreaks of Setaria tundra, a mosquito-borne filarioid nematode, in reindeer and moose (Laaksonen et al. Reference Laaksonen, Pusenius, Kumpula, Venalainen, Kortet, Oksanen and Hoberg2010).
The most common gastrointestinal nematode in caribou and reindeer (Rangifer tarandus ssp.) is Ostertagia gruehneri. This abomasal parasite causes decreased food intake, weight loss, and reduced pregnancy rates in reindeer (Arneberg et al. Reference Arneberg, Folstad and Karter1996; Arneberg and Folstad, Reference Arneberg and Folstad1999; Stien et al. Reference Stien, Irvine, Ropstad, Halvorsen, Langvatn and Albon2002). Ostertagia gruehneri has a direct life cycle and adult parasites in the abomasum produce eggs that are shed in the host's feces. First-stage larvae hatch from the eggs and develop in the external environment to the infective L3. Third-stage larvae then migrate onto nearby vegetation and passively infect the host during grazing. As with other trichostrongylids (Stromberg, Reference Stromberg1997; O'Connor et al. Reference O'Connor, Walkden-Brown and Kahn2006), development and survival rates of O. gruehneri depend on climatic conditions; however, the specific impacts of climate on development, larval availability, and overwinter survival rates are unknown.
The objectives of this research were to determine the patterns of development and L3 availability (presence of L3) for O. gruehneri on the arctic tundra and to assess how this system may respond to climate warming. Based on previous studies of trichostrongylid nematodes (Stromberg, Reference Stromberg1997; O'Connor et al. Reference O'Connor, Walkden-Brown and Kahn2006), we predicted that development rate and larval availability of O. gruehneri would increase under current climate warming scenarios of increasing temperature. Development and larval availability were investigated by analysing a series of fecal plots containing O. gruehneri that were established under natural and warmed conditions on the tundra.
MATERIALS AND METHODS
Study location
Our study took place near the Tundra Ecosystem Research Station (TERS) at Daring Lake, Northwest Territories (NT) (64o52′N, 111o35′W) in the lower, central Canadian Arctic. The study site was 15 m by 15 m and located in an area of relatively homogenous sedge hummock-moss (Obst and Squires Taylor, Reference Obst, Squires Taylor and Mair2004) and was chosen to minimize microhabitat variability among plots. Temperature at the soil surface was recorded hourly at 6 (3 natural and 3 warmed) randomly selected locations within the site using Onset HOBO data loggers® (Onset Computer Corporation, Bourne, MA).
Source of O. gruehneri eggs
Two parasite-free captive reindeer housed at the Wildlife Research Station, University of Calgary, Calgary, Alberta were experimentally infected with a monoculture of O. gruehneri L3 in July 2007. The source parasite population for these infections was the Bathurst caribou herd, Northwest Territories and Nunavut, Canada. Feces from the infected reindeer were used to establish the fecal plots at TERS to ensure a consistent, accessible source of fresh feces containing a single species of parasite. Feces were collected the week prior to plot establishment and kept refrigerated at 4°C during storage and shipped on regular ice in insulated containers (estimated 4−5°C) to prevent embryonation of parasite eggs. Control experiments (see below) were carried out on a subset of each fecal shipment to evaluate potential impacts of fecal storage and shipment on parasite egg development.
Plot experiments
Fecal plots were established using a randomized block design at 5 times throughout the spring and summer of 2008 (Table 1). Establishment dates correspond with major events during the barrenground caribou migration as follows: 1 June – arrival of females on calving grounds; 18 June – following peak of calving; 4 July – departure of females and calves from calving grounds and formation of post-calving aggregations; 27 July – beginning of dispersal of caribou into smaller groups; and 27 August – fall dispersal of caribou and lowest effective host density (McNeil et al. Reference McNeil, Russell, Griffith, Gunn and Kofinas2005). For each trial, 3 plots were established under natural conditions and 3 were established under artificially warmed conditions using ITEX open-topped chambers (Marion et al. Reference Marion, Henry, Freckman, Johnstone, Jones, Jones, Levesque, Molau, Molgaard, Parsons and Virginia1997). ITEX open-topped chambers are plexi-glass greenhouses (basal diameter is approximately 2 m) with gently sloping sides that effectively block the wind and retain some heat within the chamber. ITEX open-topped chambers have been extensively used to passively simulate climate change for plant phenology studies across the Arctic (Arft et al. Reference Arft, Walker, Gurevitch, Alatalo, Bret-Harte, Dale, Diemer, Gugerli, Henry, Jones, Hollister, Jonsdottir, Laine, Levesque, Marion, Molau, Molgaard, Nordenhall, Raszhivin, Robinson, Starr, Stenstrom, Stenstrom, Totland, Turner, Walker, Webber, Welker and Wookey1999). Natural and warmed plots were randomly distributed throughout the study site. With the exception of Trial 1, each plot contained 4–15 subsamples of 20 g feces distributed evenly throughout the plot. For Trial 1, 12 g subsamples were used because of limited quantities of feces. The number of subsamples per plot was calculated to ensure each plot could be sampled without replacement for the duration of the experiment, including 3 overwintering subsamples (Table 1). Starting 3 weeks post-establishment, 1 fecal subsample per plot was randomly selected and analysed each week to determine development and recovery rates of O. gruehneri. Three fecal subsamples per plot were left to overwinter on the tundra and were sampled on 9 June, 20 June, and 1 July 2009.
Table 1. Set-up schedule of plots of Ostertagia gruehneri for Trials 1–5 established at TERS throughout the spring and summer of 2008

| Trial | Start date | Initial EPG | Last Fall sampling | Number of sampling periodsa | Natural Treatment | Warmed Treatment | |||||||||
| Date first recovered | Min. weeks to L3 | Max. weeks to L3 | Mean temp.b (°C)±s.e. | Hoursabove30°C | Date first recovered | Min. weeks to L3 | Max. weeks to L3 | Mean temp.b (°C)±s.e. | Hours above 30°C | P-valuec | |||||
| 1 | 1-Jun | 14 | 7-Sep | 15 | 29-Jun | 4 | 7 | 7·681±0·346 | 2 | 29-Jun | 4 | 11 | 8·540±0·345 | 0 | 0·97 |
| 2 | 18-Jun | 27 | 3-Sep | 13 | 9-Jul | 3 | 5 | 13·095±0·371 | 3 | 9-Jul | 3 | 4 | 14·261±0·376 | 8 | 0·060 |
| 3 | 4-Jul | 26 | 5-Sep | 10 | 25-Jul | 3 | 6 | 14·607±0·340 | 5 | 22-Aug | 7 | 8 | 15·809±0·360 | 28 | 0·01 |
| 4 | 27-Jul | 36 | 7-Sep | 7 | 18-Aug | 3 | 5 | 14·942±0·286 | 6 | 24-Aug | 4 | 6 | 15·657±0·293 | 11 | 0·13 |
| 5 | 27-Aug | 8·4 | 4-Sep | 4 | June 2009 | N/A | N/A | 4·902±0·213 | 0 | July 2009 | N/A | N/A | 5·684±0·235 | 0 | N/A |
a Includes 3 overwintered sampling periods.
b Mean temperature for first three weeks post-establishment for Trials 1–4 and first twelve days for Trial 5.
c Wilcoxon signed rank test with continuity correction comparing hours above 30°C between treatments.
All vegetation above the moss layer in a 25 cm diameter circle around each fecal sample was collected to recover larvae that had migrated onto the vegetation. Distance of vegetation sampling was based on trichostrongylid larval recovery in previous experiments (Stromberg, Reference Stromberg1997) and vegetation was cut at the moss level to minimize the amount of dirt and non-parasitic nematodes in each sample.
Control fecal samples for each trial were set-up in triplicate at time zero to ensure consistent development between trials. Four g of feces were placed in covered Petri dishes in plastic containers with tight-fitting lids and incubated at 20°C. Moist paper towel was placed in the bottom of each container to maintain humidity. Control samples were examined for larval development every 3 days for a total of 18 days (6 sampling periods), except for Trial 5 which was only sampled for 12 days due to time constraints.
Laboratory analysis
All laboratory analyses were completed at TERS. The Wisconsin double centrifugation technique was used to determine initial fecal egg counts (Egwang and Slocombe, Reference Egwang and Slocombe1982; Hoar et al. Reference Hoar, Oakley, Farnell and Kutz2009). Initial egg counts using 4 g of feces were done in triplicate immediately prior to establishment of each trial to calculate the mean epg and to ensure eggs had not larvated. The beaker Baermann technique was used to determine larval counts from fecal plot samples (Forrester and Lankester, Reference Forrester and Lankester1997; Hoar et al. Reference Hoar, Oakley, Farnell and Kutz2009). A modified sedimentation technique was used to analyse vegetation samples. Vegetation was submerged in water in re-sealable plastic bags, gently shaken to break up clumped vegetation, and then suspended by the top corner for 24 h. After suspension the bottom corner of each bag was clamped 3–4 cm from the tip, the tip of the bag was cut off, and the water and vegetation in the bottom corner were collected in a 250 ml plastic beaker. The collected water was rinsed through vinyl window screen (1×2 mm) into another 250 ml beaker to remove larger pieces of vegetation. The filtrate was poured into a test tube and centrifuged at 264 g for 10 min. The supernatant was siphoned off, leaving approximately 1·5 ml of fluid at the bottom of each test tube. This fluid was analysed at X40 magnification using a light compound microscope and all recovered O. gruehneri larvae were counted and identified to development stage. All larval stages were qualitatively identified based on total body length, changes in body colour, and movement patterns. The criteria used to identify the larval stages were determined from a pilot study wherein the identifications of over 600 larvae were confirmed using body measurements (Table 2). Development rate of O. gruehneri to L3 was determined using the number of weeks required for the first appearance of L3 within a fecal plot. Larval recovery rates were calculated as the number of larvae recovered from fecal samples and the vegetation divided by the initial egg count for each trial. Larval availability was based on the presence or absence of L3 in a plot.
Table 2. Summary of criteria used to identify Ostertagia gruehneri larvae to developmental stage
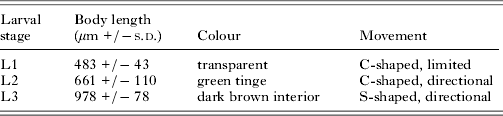
| Larval stage | Body length (μm +/−s.d.) | Colour | Movement |
| L1 | 483 +/− 43 | transparent | C-shaped, limited |
| L2 | 661 +/− 110 | green tinge | C-shaped, directional |
| L3 | 978 +/− 78 | dark brown interior | S-shaped, directional |
Statistical analyses
The statistical package R 2.11.1 R Windows (R Development Core Team, 2011) was used for all analyses and significance was set at the 95% confidence interval. Because of the low sample sizes and non-normal distribution of errors, non-parametric analyses were used. To test whether development rates were consistent across control experiments we used a Kruskal-Wallis test to compare the number of days to the first appearance of L3 across trials. Wilcoxon signed rank test with continuity correction was used to test if there was a relationship between treatment (natural vs warmed) and time spent above 30°C. The low recovery rate of larvae precluded meaningful statistical analyses of differences in larval survival between treatments or over time.
RESULTS
Control experiment
Initial egg counts differed between each trial and ranged between 8·4 epg and 36 epg (Table 1). Eggs were assessed for level of development at time zero and no observed eggs were larvated. Third-stage larvae were recovered from the control experiments within a maximum of 6 days, with no significant difference between trials (Kruskal-Wallis; P>0·05). In Trials 3 and 4, two replicates developed to L3 by day 3; all other replicates developed to L3 by day 6.
Plot experiments – temperature
Seasonal trends in temperature were consistent between the two treatments and considerable diurnal fluctuation was recorded throughout the spring and summer, with as much as 35°C difference between night and day (Fig. 1). In general, temperatures recorded under warmed conditions were higher than those recorded under natural conditions and the greatest difference was observed in maximum temperatures (Fig. 2A). Overall, June was the coolest month, July had the highest maximum temperatures, and August had the greatest change in temperature throughout the month.

Fig. 1. Weekly maximum (dashed), mean (solid), and minimum (dotted) diurnal temperature fluctuation under natural (black) and warmed (grey) conditions from June to September 2008. The lowest diurnal fluctuations for both treatments were recorded on 16 June when there was complete snow cover of the study site.
Plot experiments – development rate and larval availability
Third-stage larvae were recovered from Trials 1–4 within 3–4 weeks post-establishment, except Trial 3 under warmed conditions (7 weeks). Third-stage larvae were not recovered from Trial 5 under either treatment until the following spring (Fig. 2). Third-stage larvae were recovered within 3 weeks from Trials 2–4 under natural conditions and Trial 2 under warmed conditions; mean temperatures for these trials were 13·905–14·942°C. For Trial 1 under both conditions the mean temperatures were considerably cooler (7·681–8·540°C) during the first 3 weeks and L3 were not recovered until 4 weeks post-establishment. For Trials 3 and 4 under warmed conditions L3 were not recovered until 7 and 4 weeks, respectively. These trials had the highest mean temperatures (15·809–15·657°C) and the greatest number of hours above 30°C (28 and 11 hours, respectively). Hours above 30°C were significantly higher under warmed than natural conditions (Wilcoxon; P<0·01) for Trial 3 only (Table 1).

Fig. 2. Summary of weekly mean temperatures and percentage recovery of Ostertagia gruehneri throughout the 2008 and 2009 field seasons. (A) Weekly summary of ground temperature under both natural (n=3) and warmed (n=3) conditions throughout the sampling periods in 2008 (1 June to 7 September) and 2009 (2 June to 2 July). (B) Percentage recovery (based on initial egg counts for each trial) of L3 under natural conditions for each sampling period during the 2008 and 2009 field seasons. (C) Percentage recovery of L3 under warmed conditions for each sampling period during the 2008 and 2009 field seasons. The time between plot establishment and first appearance of L3 is indicated in black.
Once L3 were present in a trial, they continued to be recovered for the duration of the summer and into the following spring (Fig. 2). The only exception was Trial 1 under natural conditions in which L3 recovery was sporadic throughout 2008 and no larvae were recovered in 2009. For all trials, larval recovery rates were generally below 10% throughout the 2008 field season; however, mean recovery from Trial 3 peaked at the end of August under both natural (12% recovery) and warmed conditions (18% recovery).
Nineteen larvae were recovered from a total of 6 vegetation samples (4 natural; 2 warmed) in 2008; no larvae were recovered from vegetation in the spring of 2009. All live larvae recovered from the vegetation were L3; a single, dead L2 was recovered. Larvae were recovered from the vegetation only after L3 were recovered from the fecal plots.
Plot experiments – overwinter survival
Larval overwintering was examined at 3 sampling periods in the spring of 2009 and, when present, there was a high recovery rate of both L2 and L3 from the overwintered plots (Fig. 2). In the spring of 2009 no L2 were recovered from Trials 1 and 2 and only from the warmed plots in Trial 3. For Trials 4 and 5, the highest recovery rate of L2 was during the first sampling period, followed by a marked decrease in recovery rate. In contrast, L3 were recovered from all but 1 trial and recovery rate peaked during the second sampling period in the majority of trials (Fig. 2).
DISCUSSION
Patterns of larval development and availability
Understanding the impacts of climate on the transmission dynamics of O. gruehneri in barrenground caribou requires knowledge of the current patterns of development and availability of the free-living stages within this system. Despite small sample sizes and multiple logistical challenges we have identified 4 key features of the free-living stages of O. gruehneri that are critical for understanding its transmission: (1) development from egg to L3 occurs within 3–4 weeks throughout the growing season; (2) a possible upper temperature threshold for development above which larval development is slowed; (3) persistence of L3 throughout the summer; and (4) high overwinter survival of both L2 and L3 with apparent resumption of development to L3 the following spring.
Each of these characteristics has implications for understanding current and potential transmission dynamics of O. gruehneri in barrenground caribou under different climate conditions. First, unlike previously suggested by Albon et al. (Reference Albon, Stien, Irvine, Langvatn, Ropstad and Halvorsen2002), our study showed that O. gruehneri developed to the infective stage within a single arctic summer and eggs deposited as late as 27 July were able to develop to L3 by late August. Once present in a trial, L3 were consistently recovered throughout the 2008 and 2009 field seasons (except for Trial 1 under natural conditions). These findings demonstrate that barrenground caribou may be infected throughout the growing season by L3 developing from eggs deposited earlier in the same year. We did not analyse differences in larval abundance between treatments or trials because our larval recovery rates were low. It is possible, however, that more L3 were in the environment but were not recovered from either the fecal or vegetation samples. Trichostrongylid larvae are known to burrow into the soil, especially during dry ambient conditions (reviewed by Stromberg, Reference Stromberg1997); however, soil samples were not analysed during this experiment.
Second, O. gruehneri appears to have a broad range of thermal tolerance within which development can occur. The free-living stages of Arctic nematodes are exposed to a high magnitude of temperature fluctuation, both daily and annually, particularly when compared to temperate or tropical species. For O. gruehneri, despite substantial diurnal temperature fluctuations of as much as 35°C, and within the constraints of our sampling regime (weekly sampling, small sample size, and low larval recovery), for all but 1 trial the first L3 appeared within 3–4 weeks post-establishment throughout the summer. These results suggest that O. gruehneri has a broad thermal tolerance, developing at a fairly consistent rate under a range of temperature conditions. Deutsch et al. (Reference Deutsch, Tewksbury, Huey, Sheldon, Ghalambor, Haak and Martin2008) proposed that a broad thermal tolerance may dampen the effects of climate warming on ectotherms at higher latitudes because they are currently exposed to mean temperatures below their optimal temperatures. However, in our study, the optimum temperature for O. gruehneri was likely exceeded for at least part of the growing season, as suggested by the reduced development rate under the warmest conditions (Trial 3 under warmed conditions).
Thirdly, our data suggest there may be an upper temperature threshold for development. The most rapid development to L3 occurred at mean temperatures for the first 3 weeks post-establishment of 13·095–14·942°C with slower development at lower (7·681–8·540°C) and higher (15·657–15·809°C) mean temperatures. Unexpectedly, third-stage larvae were not recovered from the warmest trial (Trial 3 under warmed conditions) for 7 weeks, despite ongoing recovery of pre-infective larval stages. This trial experienced the highest maximum temperature (36·399°C) and the longest duration of time above 30°C (28 h) within the first 3 weeks post-establishment. In contrast, L3 were recovered from Trial 3 under natural conditions within 3 weeks and plots experienced temperatures above 30°C for only 5 h. These results suggest that O. gruehneri may have a maximum temperature threshold for development, above which development is slowed. Laboratory studies of the effect of high temperatures on the development of O. gruehneri under controlled conditions (B. Hoar, unpublished data) confirm this upper threshold of development.
If climate warming results in increased periods of time above an upper threshold, then infection risk to barrenground caribou may be reduced at certain times within the growing season. Note, however, that our study could not determine whether total L3 production was reduced compared to other trials as L3 recovery from this trial was higher later in the season. That is, exposure risk may be delayed rather than decreased. Despite the preponderance of studies on the effect of temperature on development and survival in trichostrongylids, maximum temperature thresholds for development have not been well-studied (Ciordia and Bizzell, Reference Ciordia and Bizzell1963; Levine and Ferron, Reference Levine and Ferron1973; Pandey et al. Reference Pandey, Chaer and Dakkak1989; Coyne and Smith, Reference Coyne and Smith1992; Rossanigo and Gruner, Reference Rossanigo and Gruner1995). Rossanigo and Gruner (Reference Rossanigo and Gruner1995) demonstrated a decrease in the number of L3 developed per 100 eggs of Teladorsagia circumcincta, T. colubriformis, O. leptospicularis, and O. ostertagi at higher temperatures; however, this study did not differentiate between thresholds for development and survival. Additional studies have reported a maximum temperature for survival (Berberian and Mizelle, Reference Berberian and Mizelle1957; Andersen et al. Reference Andersen, Wang and Levine1966) or an upper threshold for egg hatching (van Dijk and Morgan, Reference Van Dijk and Morgan2008). Delineating upper development thresholds may be critical for predicting the impact of climate warming, especially since extreme weather events (i.e. extreme temperatures) are expected to increase (Rinke and Dethloff, Reference Rinke and Dethloff2008).
Finally, overwinter survival was extremely high for larvae of O. gruehneri. This finding is not surprising for an Arctic parasite (Albon et al. Reference Albon, Stien, Irvine, Langvatn, Ropstad and Halvorsen2002), especially a parasite with a migratory host. What does make O. gruehneri unique, however, is the ability of L2 to survive the winter. No L1 were recovered from plots in the spring suggesting that this stage may not overwinter in the environment. Recovery of overwintered L2 has previously been reported for O. gruehneri (Van der Wal et al. Reference Van Der Wal, Irvine, Stien, Shepherd and Albon2000) but not for any other trichostrongylid species. Recovery of L2 decreased across spring sampling periods, which may be the result of either mortality or development to L3; however, the increase of L3 recovery suggests development. This high overwinter survival of 2 developmental stages would contribute greatly to the environmental accumulation of infective stages the year following egg deposition and may introduce a significant time lag into the system.
Transmission dynamics of Ostertagia gruehneri
Understanding the development and availability patterns of infective O. gruehneri on the tundra is critical to furthering our understanding of the transmission dynamics within this system. However, transmission of this parasite is further complicated by the migratory behaviour of barrenground caribou, which may amplify the effect of the time lag introduced into this system through overwintering larvae. In general, adult female caribou arrive on the calving grounds near the beginning of June, with the peak of calving around mid-June. In early July, the cows and newborn calves join with the males and yearlings for the post-calving migration (McNeil et al. Reference McNeil, Russell, Griffith, Gunn and Kofinas2005). In August the post-calving aggregations disband into smaller groups and spread out across the lower tundra to graze intensively prior to the rut (ranging from October to December) and the onset of winter (McNeil et al. Reference McNeil, Russell, Griffith, Gunn and Kofinas2005; Hummel and Ray, Reference Hummel and Ray2008).
Our results indicate that O. gruehneri can develop from egg to L3 during the time that cows are on the calving grounds and that overwintered larvae also contribute to the environmental contamination during this time; therefore, 2 generations of L3 are available to infect caribou on the calving grounds. During the post-calving migration, exposure to infection may be limited by the increased rate and directionality of movement of caribou throughout July. Migration may effectively separate host and parasite across the landscape and reduce exposure to infective stages of O. gruehneri. However, our results indicate that the longevity of L3 in the environment may simply delay exposure, reducing the effectiveness of this strategy as suggested by Altizer et al. (Reference Altizer, Bartel and Han2011). Caribou would still be exposed to infection if overwintered larvae persist in the environment throughout July, as reported for Teladorsagia circumcincta (Waller et al. Reference Waller, Rudby-Martin, Ljungstrom and Rydzik2004), and suggested by persistence of overwintered L3 to early July in this study. By August, the directional movement of caribou decreases and feeding intensity increases (McNeil et al. Reference McNeil, Russell, Griffith, Gunn and Kofinas2005), thereby increasing exposure to infection. Exposure to parasites shed the same year may be less than on the calving grounds because of the lower effective host density (McNeil et al. Reference McNeil, Russell, Griffith, Gunn and Kofinas2005), however, this will be influenced by climatic conditions and caribou movement. Once again, if overwintered larvae can persist in the environment throughout the summer then exposure to 2 generations of L3 would be possible.
Our understanding of the migratory behaviour of barrenground caribou is based primarily on information from satellite-collared adult females. To fully understand the transmission dynamics of O. gruehneri it is important to examine the migratory patterns of all age and sex cohorts. Adult males and most yearling caribou do not migrate to the calving grounds; therefore, the transmission dynamics within these groups are likely to differ from those of adult females. In addition, during the calving season males and yearlings tend to inhabit areas that the entire herd will traverse during the post-calving migration. Contamination of this area is likely to increase exposure of migrating caribou to both first-year and overwintered larvae. Barrenground caribou exposure to L3 from both the current and previous year likely extends throughout the growing season and one cohort may serve as the source of infection for others. Climate change is likely to impact the migratory behaviour of the caribou through changes to traditional migratory routes, timing and duration of migration, and food availability (Hassol, Reference Hassol2004; Kruse et al. Reference Kruse, White, Epstein, Archie, Berman, Braund, Chapin, Iii, Charlie, Daniel, Eamer, Flanders, Griffith, Haley, Huskey, Joseph, Klein, Kofinas, Martin, Murphy, Nebesky, Nicolson, Russell, Tetlichi, Tussing, Walker and Young2004), which will have further implications for transmission dynamics.
Current climate change scenarios for the Arctic indicate increased mean monthly and annual temperatures, as well as increases to the frequency and magnitude of extreme temperatures and weather events. These changes will influence development, survival, and transmission of O. gruehneri. Our results suggest that minor increases in mean temperature (1−2°C using the ITEX open-topped chambers) will have limited effects on the development of O. gruehneri on the tundra; however, even the most conservative of climate change models suggest temperature increases above this range in the Arctic (Alley et al. Reference Alley, Berntsen, Bindoff, Chen, Chidthaisong, Friedlingstein, Gregory, Hegerl, Heimann, Hewitson, Hoskins, Joos, Jouzel, Kattsov, Lohmann, Manning, Matsuno, Molina, Nicholls, Overpeck, Qin, Raga, Ramaswamy, Ren, Rusticucci, Solomon, Somerville, Stocker, Stott, Stouffer, Whetton, Wood and Wratt2007). Increases to minimum and maximum temperatures are more likely to have quantifiable impacts on O. gruehneri transmission than increases to mean temperatures alone. Increased minimum temperatures, as well as an extended growing season, may enhance the development and transmission of O. gruehneri on the tundra; however, climate warming may not always benefit parasite transmission. Increases in the magnitude and extent of maximum temperatures throughout the growing season may negatively impact parasite development and survival. Therefore, quantifying the minimum and maximum temperature thresholds for development and survival is essential for predicting the impacts of climate change on parasite development. Delineating the range of thermal tolerance for O. gruehneri will provide greater insight for predicting the impacts of changes to minimum and maximum temperatures or extreme weather events on transmission dynamics.
ACKNOWLEDGEMENTS
We thank Ryan Mercredi, Andrew Krisch, Jessica Ouellet, and Dean Brown for assistance with the fieldwork, Marianne Jorgenson for caring for the reindeer and fecal collections, and Steve Matthews for logistical support.
FINANCIAL SUPPORT
This work was supported by Alberta Innovates (B.H., 200800734); NSERC (S.K., 312178-2007); Indian and Northern Affairs Canada; Department of Environment and Natural Resources Government of the Northwest Territories; the Arctic Institute of North America; the Beverly and Qamanirjuaq Caribou Management Board; the CircumArctic Rangifer Monitoring and Assessment Network; and the Association of Canadian Universities for Northern Studies.


