


Autism spectrum disorder (ASD) is a neurodevelopmental disorder affecting 1 in 54 children in the United States (Maenner et al., Reference Maenner, Shaw, Baio, Washington, Patrick, DiRienzo and Dietz2020). Individuals with ASD have deficits in social communication and a pattern of restricted, repetitive behaviors and interests, but they vary significantly in their challenges and abilities in these domains (American Psychiatric Association, 2013), as well as in other developmental domains (e.g., language, motor). Attempts to parse this heterogeneity based on behavioral phenotypes have been unsuccessful, particularly with respect to predicting developmental course and treatment response (King, Navot, Bernier, & Webb, Reference King, Navot, Bernier and Webb2014). In contrast, advances in genomics have led to identification of biological subtypes that may inform precision medicine care for the broader population of individuals with ASD. In the past decade, next-generation sequencing has revolutionized ASD risk gene discovery using faster, less expensive technology with much greater resolution, namely, the ability to detect single nucleotide mutations using whole-genome or whole-exome sequencing (Neale et al., Reference Neale, Kou, Liu, Ma'Ayan, Samocha, Sabo and Makarov2012; O'Roak et al., Reference O'Roak, Deriziotis, Lee, Vives, Schwartz, Girirajan and Baker2011; O'Roak et al., Reference O'Roak, Vives, Girirajan, Karakoc, Krumm, Coe and Smith2012; Sanders et al., Reference Sanders, Murtha, Gupta, Murdoch, Raubeson, Willsey and Stein2012). As a result, a multitude of ASD risk genes have been discovered (Iossifov et al., Reference Iossifov, O'roak, Sanders, Ronemus, Krumm, Levy and Patterson2014). Researchers have continued to uncover additional genes of interest using techniques such as molecular inversion probes (MIPS) that allow cost-effective targeted sequencing of ASD risk genes in large cohorts (Fischbach & Lord, Reference Fischbach and Lord2010; Stessman et al., Reference Stessman, Xiong, Coe, Wang, Hoekzema, Fenckova and Cosemans2017).
Single gene characterizations have delineated separable phenotypes, yielding preliminary support for the utility of genomics in parsing the phenotypic heterogeneity of ASD (Arnett, Trinh, & Bernier, Reference Arnett, Trinh and Bernier2019). For example, individuals with mutations to CHD8 (Chromodomain Helicase DNA Binding Protein 8), a high-confidence ASD risk gene, have a subtype typified by growth differences, gastrointestinal difficulties, dysmorphic facial features, and macrocephaly (Bernier et al., Reference Bernier, Golzio, Xiong, Stessman, Coe, Penn and Vulto-van Silfhout2014). In contrast, mutations to DYRK1A (Dual Specificity Tyrosine Phosphorylation Regulated Kinase 1A) are associated with high rates of intellectual disability, vision problems, distinct facial dysmorphology, feeding difficulty, speech delay, and microcephaly (Earl et al., Reference Earl, Turner, Mefford, Hudac, Gerdts, Eichler and Bernier2017).
With hundreds of ASD-linked genes identified, and the frequency of any particular likely gene disrupting (LGD) mutation being extremely low, it behooves researchers to examine higher-level genetic networks that could inform phenotypic outcome and underlying pathology. Many ASD risk genes share critical functions, including synaptic formation, transcriptional regulation, and chromatin remodeling (Ramaswami & Geschwind, Reference Ramaswami and Geschwind2018). Gene–gene interaction networks, such as ASD risk genes that are regulated by CHD8 protein, provide evidence for converging biological pathways that influence ASD-associated phenotypes (Beighley et al., Reference Beighley, Hudac, Arnett, Peterson, Gerdts, Wallace and O'Roak2019). Likewise, support for characterization of genetic subtypes based on neurobiological expression patterns has been indicated by an association between mutations to postsynaptic density genes and developmental regression in affected individuals (Goin-Kochel, Trinh, Barber, & Bernier, Reference Goin-Kochel, Trinh, Barber and Bernier2017). These studies have just begun to provide insight into sources of ASD heterogeneity.
Along with genomic advances, large-scale efforts in the collection and analysis of postmortem human brain tissue have led to the generation of transcriptomic databases characterizing cellular DNA in both neuropsychiatric and healthy donors (e.g., Kang et al., Reference Kang, Kawasawa, Cheng, Zhu, Xu, Li and Sedmak2011; Li et al., Reference Li, Santpere, Kawasawa, Evgrafov, Gulden, Pochareddy and Zhu2018). For instance, through the NIH-funded PsychENCODE and BrainSpan Consortia, Li and colleagues (Reference Li, Santpere, Kawasawa, Evgrafov, Gulden, Pochareddy and Zhu2018) generated a comprehensive transcriptomic dataset from 60 post-mortem prenatal and postnatal brains of reported healthy donors, with ages ranging from five weeks postconception to 64 years postnatal. The database sampled bulk-tissue from 16 anatomical brain regions, including 11 neocortical areas, the hippocampus, amygdala, striatum, mediodorsal nucleus of the thalamus, and cerebellar cortex. These databases have facilitated in-depth characterization of the expression patterns of ASD risk genes in healthy brains, informing hypotheses about typical developmental events that may be disrupted among individuals with ASD (Jaffe, Reference Jaffe2016). Gene expression is highly dynamic across neurobiological space and developmental stage, and genes known to be involved in different aspects of brain development show distinct spatiotemporal expression signatures (Silbereis, Pochareddy, Zhu, Li, & Sestan, Reference Silbereis, Pochareddy, Zhu, Li and Sestan2016). High prenatal expression signatures likely reflect involvement in neurogenesis and neuronal differentiation, whereas high postnatal expression signatures are more likely to impact synaptogenesis and myelination (Silbereis et al., Reference Silbereis, Pochareddy, Zhu, Li and Sestan2016). Heterogeneity in cell proliferation, migration, and synaptogenesis has been noted in ASD (Courchesne, Mouton, et al., Reference Courchesne, Mouton, Calhoun, Semendeferi, Ahrens-Barbeau, Hallet and Pierce2011; Courchesne et al., Reference Courchesne, Pramparo, Gazestani, Lombardo, Pierce and Lewis2019); thus, these are promising dimensions on which to further refine genetic subtypes.
Gene coexpression network analyses have identified specific neurobiological spatiotemporal expression patterns in a number of genes and copy number variants associated with ASD (Lin et al., Reference Lin, Corominas, Lemmens, Yang, Tavernier, Hill and Iakoucheva2015; Parikshak et al., Reference Parikshak, Luo, Zhang, Won, Lowe, Chandran and Geschwind2013; Willsey et al., Reference Willsey, Sanders, Li, Dong, Tebbenkamp, Muhle and Miller2013). For instance, Willsey and colleagues (Reference Willsey, Sanders, Li, Dong, Tebbenkamp, Muhle and Miller2013) identified biological convergence of the 16p11.2 gene network in the mid-fetal human prefrontal and primary motor cortices in deep-layer projection neurons and early postnatal cerebellum and thalamus. This finding has been confirmed by a number of other investigators (Xu, Wells, O'Brien, Nehorai, & Dougherty, Reference Xu, Wells, O'Brien, Nehorai and Dougherty2014). Convergence of coexpression patterns across ASD-linked genes is hypothesized to represent an intersection of biological processes that, when disrupted, lead to a common phenotype (Willsey et al., Reference Willsey, Sanders, Li, Dong, Tebbenkamp, Muhle and Miller2013). However, to our knowledge, no studies have examined whether spatiotemporal transcriptomic signatures predict phenotypic outcomes among individuals with mutations to ASD-linked genes.
In the current study, we tested the hypothesis that transcriptomic spatiotemporal coexpression patterns explain variation in social communication and related behaviors in a population of individuals with ASD-linked genetic mutations. We defined transcriptional genetic subtypes following temporal and spatial expression parameters reported by Li and colleagues (Reference Li, Santpere, Kawasawa, Evgrafov, Gulden, Pochareddy and Zhu2018). Weighted gene coexpression network analysis of this comprehensive transcriptomic dataset yielded 73 spatiotemporal modules. The majority of disrupted genes in our cohort were characterized by four distinct modules: (a) higher prenatal relative to postnatal expression in all brain regions (High Prenatal), (b) higher postnatal relative to prenatal expression in all brain regions (High Postnatal), (c) higher postnatal expression in the cerebellum relative to postnatal expression in other brain regions (i.e., neocortex, hippocampus, amygdala, striatum, and mediodorsal nucleus of the thalamus; High Postnatal Cerebellar), and (d) lower postnatal expression in the cerebellum relative to postnatal expression in other brain regions (Low Postnatal Cerebellar). Following previous research (Iossifov et al., Reference Iossifov, O'roak, Sanders, Ronemus, Krumm, Levy and Patterson2014; Satterstrom et al., Reference Satterstrom, Kosmicki, Wang, Breen, De Rubeis, An and Klei2020), we anticipate the High Prenatal group will be associated with lower functioning across all domains, due to the deleterious effects of gene disruptions impacting early and fundamental brain development. There is insufficient literature to support hypotheses regarding differences among the other three transcriptional subtypes, thus those comparisons are exploratory.
Methods
Sample and procedures
Participants were 335 children with ASD-associated likely gene disrupting mutation (71% male; age M = 9.25 years; age SD = 4.17 years) who had participated in the Simons Simplex Collection (SSC; N = 223; Fischbach & Lord, Reference Fischbach and Lord2010) or had participated in an ongoing study at the University of Washington (UW; N = 112) and who had available genotypic and phenotypic data (see Table 1). The SSC is a repository of clinical and genetic data from families who have a single child diagnosed with ASD and no family history of ASD (Fischbach & Lord, Reference Fischbach and Lord2010). Data on gene disrupting mutations for SSC participants were extracted from Iossifov et al. (Reference Iossifov, O'roak, Sanders, Ronemus, Krumm, Levy and Patterson2014). UW participants were recruited based on the presence of an ASD-associated pathogenic genetic mutation detected through clinical testing or prior research participation; however, unlike SSC, a diagnosis of ASD was not necessary for inclusion in the UW study. Among the SSC sample, 100% had a diagnosis of ASD and 16% had ID; within the UW sample, 63% of participants met clinical criteria for ASD and 84% for ID (see Table S1).
Table 1. Subject demographics and subtype assignment
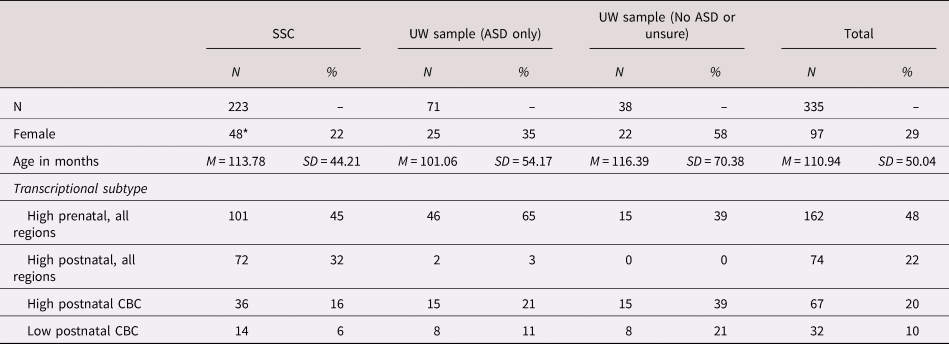
* Sex missing for four SSC participants.
SSC = Simons Simplex Collection; ASD = autism spectrum disorder; CBC = cerebellar cortex.
Measures
Participants in SSC and UW samples completed a similar battery of phenotypic assessments, including measures of cognitive skills, adaptive skills, and ASD symptoms (see Table 2). Assessment procedures used for the UW sample were adapted from SSC to promote consistency across samples.
Table 2. Descriptive statistics

Note: Individuals who had not attained the developmental milestone at the time of the evaluation were not included in summary statistics. Superscripts reference the following number of participants who had not attained the milestone: a = 15, b = 27, c = 27, d = 15, e = 22, f = 21, g = 6, h = 8, i = 8. ψ = average severity across all 43 items.
ABC = Adaptive Behavior Composite; ADI-R = Autism Diagnostic Interview, Revised; ADOS = Autism Diagnostic Observation Schedule (First or Second Edition); CSS = calibrated severity scores; RBS-R = Repetitive Behavior Scale—Revised; RRB = Restricted and Repetitive Behaviors; VABS = Vineland Adaptive Behavior Scales, Second Edition.
Cognitive and adaptive skills
Verbal and nonverbal cognitive abilities were measured using standardized IQ tests. UW and SSC participants age 4 to 17 years were administered the Differential Ability Scales, Second Edition (DAS-II; Elliot, Reference Elliot2007). UW participants ages 18 years and older were administered the Wechsler Abbreviated Scales of Intelligence, Second Edition (WASI-II; Wechsler, Reference Wechsler2011). The Mullen Scales of Early Learning (MSEL; Mullen, Reference Mullen1995) were administered to UW and SSC participants ages three years and younger and to participants ages four years and older who were unable to complete the DAS-II or WASI-II due to low mental age. A small subset of SSC participants were administered the Wechsler Intelligence Scale for Children, Fourth Edition (WISC-IV; Wechsler, Reference Wechsler2003). Verbal, nonverbal, and full-scale ratio IQ scores (i.e., developmental quotients calculated as age equivalency divided by chronological age, in months) were calculated for all cognitive assessments. These ratio IQ scores were used in place of standard scores, as standard scores were invalid for some participants due to test performance below the floor. The survey interview form of the Vineland Adaptive Behavior Scales, Second Edition (Vineland-II; Sparrow, Balla, & Cicchetti, Reference Sparrow, Balla and Cicchetti2005) was administered to caregivers as a measure of adaptive behavior, and age-standardized scores with a mean of 100 and a standard deviation of 15 were calculated for four domains (Communication, Daily Living Skills, Socialization, and Motor Skills) and for the full-scale Adaptive Behavior Composite.
ASD symptoms
The Autism Diagnostic Observation Schedule, First or Second Edition (ADOS; Lord et al., Reference Lord, Risi, Lambrecht, Cook, Leventhal, DiLavore and Rutter2000, Reference Lord, Rutter, DiLavore, Risi, Gotham and Bishop2012) and the Autism Diagnostic Interview, Revised (ADI-R; Rutter, Le Couteur, & Lord, Reference Rutter, Le Couteur and Lord2003) were administered by research reliable clinicians. Modules 1–4 were administered according to observed expressive language level. Calibrated severity scores (CSS) ranging from 1 to 10 were calculated for the total ADOS score and for the Social Affect and Restricted and Repetitive Behaviors (RRB) domains (Hus, Gotham, & Lord, Reference Hus, Gotham and Lord2014). These scores have been adjusted to account for age-related changes in severity of ASD-related behaviors. The ADI-R was administered to primary caregivers, who reported on the age (in months) at which their child first used single words meaningfully (apart from “mama” and “dada”), walked independently, and first used meaningful phrases containing a verb. ADI-R milestones coded as “not yet met” were recoded as two sample standard deviations (SD) above the individual's age at testing. Although prior research suggests these retrospective reports are subject to telescoping bias (Hus, Taylor, & Lord, Reference Hus, Taylor and Lord2011), our own research indicates this bias is minimal to nonexistent for these milestones, at least within the UW sample (Arnett et al., Reference Arnett, Beighley, Kurtz-Nelson, Hoekzema, Wang, Bernier and EichlerUnder Review).
Primary caregivers completed the Repetitive Behavior Scale—Revised (RBS-R; Bodfish, Symons, Parker, & Lewis, Reference Bodfish, Symons, Parker and Lewis2000) as a measure of repetitive behavior severity. Caregivers reported on the frequency and severity of 43 repetitive behaviors over the past month using a 0 to 3 Likert-type scale. Average severity scores were generated for the following domains using guidelines published by Bishop and colleagues (Reference Bishop, Hus, Duncan, Huerta, Gotham, Pickles and Lord2013): stereotyped motor and sensory behaviors, self-injurious behaviors, compulsive behaviors, restricted interests, and ritualistic and sameness behaviors. These composite scores have been shown to distinguish genetic subtypes of ASD in previous research (Arnett et al., Reference Arnett, Rhoads, Hoekzema, Turner, Gerdts, Wallace and Bernier2018).
Analytic approach
Data were prepared and analyzed in IBM SPSS 20. Individuals were characterized as having a disruption to a gene with a High Prenatal, High Postnatal, High Postnatal Cerebellar, or Low Postnatal Cerebellar transcriptional expression pattern (Li et al., Reference Li, Santpere, Kawasawa, Evgrafov, Gulden, Pochareddy and Zhu2018; see Table S1). Individuals with multiple gene variants whose variants fell into more than one transcriptional subtype defined in Li et al. (Reference Li, Santpere, Kawasawa, Evgrafov, Gulden, Pochareddy and Zhu2018) were excluded from analyses (N = 6). A series of multivariate analyses of variance (MANOVAS) was conducted with transcriptional subtype and sex as fixed factors and phenotypic measures as dependent variables. Age was included as a covariate in analyses with the RBS-R domains as dependent variables. Significant MANOVAs were followed up with post hoc pairwise comparisons with Bonferroni adjustment for multiple comparisons. We hypothesized that transcriptional subtypes would reveal unique phenotypic patterns, including differences in ASD rates and symptom severity. Thus, our primary analyses included all individuals, regardless of Diagnostic and Statistical Manual of Mental Disorders—5th edition (DSM-5) ASD diagnosis. However, to account for the divergent recruitment approaches across SSC and UW samples, we also report results of secondary analyses that included only the subset of individuals with an ASD diagnosis (see Table S2).
Results
Demographic and diagnostic comparisons
Chi square analysis indicated significant differences in the actual as compared to expected distribution of ASD diagnosis across the transcriptional subtypes: χ(3) = 14.99, p = .002. Most notably, all individuals in the high postnatal subtype met criteria for ASD. There was a modest but not statistically significant sex difference across transcriptional subtypes: χ[3] = 6.09, p = .107. Age did not vary as a function of transcriptional subtype (F[3, 324] = 0.276, p = .843). This remained true when only ASD cases were included (sex χ[3] = 1.86, p = .601; age F[3, 285] = 1.08, p = .357).
Cognitive and adaptive functioning
Ratio IQs varied significantly across transcriptional subtypes: F(9,855) = 2.41, p = .011 (see Figure 1); and sex: F(3, 283) = 3.21, p = .023. There was no indication of an interaction between subtype and sex: F(9, 855) = 0.70, p = .712. Follow-up ANOVAs confirmed transcriptional subtype differences existed for verbal (F[3,285] = 4.92, p = .002), nonverbal (F[3,285] = 6.80, p < .001), and full-scale (F[3,285] = 6.58, p < .001) cognitive performance. Post hoc comparisons with Bonferroni adjustment indicated the high postnatal subtype had higher verbal, nonverbal and full-scale ratio IQs than all other subtypes (ps ≤ .027). Males had higher nonverbal (F[1, 285] = 6.83, p = .009; average point difference = 11) and full-scale ratio IQ scores than females (F[1, 285] = 4.67, p = .032; average point difference = 10), but there were no sex differences in verbal ratio IQ (F[1, 285] = 1.86, p = .174; average point difference = 7).

Figure 1. Mean verbal ratio IQ, non-verbal ratio IQ, and adaptive behavior composite standard score for participants in four transcriptional subtypes defined in Li et al. (Reference Li, Santpere, Kawasawa, Evgrafov, Gulden, Pochareddy and Zhu2018). Error bars represent standard errors.
When the ANOVAs were repeated with only the ASD subsample, pairwise comparisons differed slightly in that the high postnatal group outperformed only the high prenatal group on verbal ratio IQ (p = .007); and outperformed both the high prenatal and low postnatal cerebellar groups on nonverbal (ps < .030) and full-scale (ps < .050) ratio IQs. Within this restricted sample, the main effect of sex on cognitive outcomes was no longer statistically significant (F[3, 261] = 1.77, p = 0.154).
Adaptive functioning varied significantly across transcriptional subtypes: F(12,918) = 3.17, p < .001 (see Figure 1); and sex: F(4, 304) = 5.34, p < .001. The interaction between subtype and sex approached significance: F(12, 918) = 1.70, p = .059. Follow-up ANOVAs indicated significant variability across subtypes in adaptive communication F[3,307] = 5.15 p = .002), daily living skills (F[3,307] = 6.31, p < .001) and socialization (F[3,307] = 4.24, p = .006) in addition to the overall composite score (F[3,307] = 6.12, p < .001). Pairwise comparisons showed that, relative to the other three groups, the high postnatal group showed stronger adaptive communication (ps < .003), daily living (ps < .005), socialization (ps < .040), and overall adaptive behavior (ps < .002). On average, males had higher scores than females on adaptive communication (p = .022), daily living (p = .003), socialization (p = .044), and the overall composite (p = .002). However, examination of interaction effects revealed these sex differences were only statistically significant among the high prenatal (ps < .033) and high postnatal cerebellar (ps < .006) subtypes. When the sample was restricted to individuals with ASD, results were similar, with the exception that omnibus ANOVAs for sex and sex by subtype interactions were no longer significant for any adaptive domain (sex F values ≤ 1.20, ps > .270; interaction F values < 0.850, ps > .475).
ASD symptoms
On the ADOS, severity of social affect, RRB, and total comparison severity scores varied across transcriptional groups: F(9, 840) = 2.42, p = .018; and sex: F(3, 278) = 3.37, p = .019. There was no indication of a subtype by sex interaction: F(9, 840) = 1.22, p = .282. Follow-up ANOVAs revealed variability across transcriptional subtypes on social affect (F[3, 280] = 4.24, p = .006), but not the RRB (F[3, 280] = 0.88, p = .454) or total (F[3, 280] = 0.30, p = .826) scores (see Figure 2). Pairwise comparisons indicated the postnatal expression group had less severe social deficits relative to all groups, with comparisons to the prenatal expression (p = .007) and high postnatal cerebellar (p = .009) groups reaching statistical significance (low postnatal cerebellar p = .187). In contrast, follow-up ANOVAs revealed higher RRB scores among males as compared to females (F[1, 280] = 8.06, p = .005), but no sex differences in social affect (F[1, 280] = 0.18, p = .668) or total (F[1, 280] = 1.85, p = .175) scores. Within the ASD subsample, results were comparable; however, the main effect of sex on ADOS RRB severity was no longer statistically significant: F(3, 256) = 1.17, p = .321).

Figure 2. Mean Autism Diagnostic Observation Schedule (ADOS) Social Affect and Restricted and Repetitive Behavior calibrated severity scores for participants in four transcriptional subtypes defined in Li et al. (Reference Li, Santpere, Kawasawa, Evgrafov, Gulden, Pochareddy and Zhu2018). Error bars represent standard errors.
Transcriptional subtypes were not significantly different with respect to severity of RRBs measured by the RBS-R (F[15, 915] = 0.60, p = .877). RBS-R scores did vary by age (F[5, 303] = 4.09, p = .001) and sex (F[5, 303] = 2.93, p = .013). Interaction terms were not statistically significant (ps > .090). Follow-up ANOVAs revealed an age effect on stereotyped motor movements, specifically: F(1, 307) = 11.61, p = .001. Males had increased stereotyped motor and restricted interest RRBs compared to females (ps < .040). These results were consistent when analyses were restricted to the ASD subsample.
Developmental milestones
Age at which individuals attained early developmental milestones varied significantly across transcriptional subtypes: F(9, 867) = 2.75, p = .004. Follow up ANOVAs showed significant subtype variability across all three milestones (F[3, 289]s > 5.00, ps ≤ .002. There was no main (F[3, 287] = 0.59, p = .620) or interactive (F[9, 867] = 0.94, p = .489) effect of sex on milestone attainment. Post hoc pairwise comparisons revealed that relative to the high prenatal subtype, the high postnatal subtype walked an average of 20 months earlier (p = .008), spoke single words about 15 months earlier (non-significant p = .119) and spoke in phrases approximately 24 months earlier (p = .010). Relative to the high and low postnatal cerebellar subtypes, the high postnatal subtype met all developmental milestones 26–38 months earlier, on average (ps < .015). Within the ASD subsample, the effect sizes were reduced, with the high postnatal subtype meeting milestones 15–22 months earlier than the prenatal subtype, and 17–22 months earlier than the high and low postnatal cerebellar subtypes.
Discussion
Tremendous effort has gone into investigating the biological basis of ASD with the goal of delivering precision medicine care for affected individuals. Thus far, hundreds of ASD risk genes have been identified, but only a few provide promising avenues for individualized treatment (Gozes, Reference Gozes2020; Sanders et al., Reference Sanders, Campbell, Cottrell, Moller, Wagner, Auldridge and Empfield2018). Moreover, the rarity of individual LGD mutations limits statistical power to detect meaningful phenotypic differences, and limits the number of individuals who will benefit from genetics-based treatment approaches. In the current study, we address these challenges by evaluating phenotypic differences among genetic subtypes defined by a higher-level attribute, namely, spatial and temporal gene expression patterns. Our findings highlight distinct patterns of gene expression associated with different developmental outcomes and underline the utility of a genetics-first approach in parsing phenotypic heterogeneity and contributing to molecular hypotheses of ASD.
Overall, our results indicate that disruptions to genes characterized by high prenatal expression across brain regions are associated with more severe deficits, including lower IQ and adaptive functioning, higher severity of social communication deficits, and later achievement of speech and motor milestones, relative to disruptions to genes characterized by high postnatal expression across brain regions. Previous studies, although based on functional subtyping, are consistent with our findings. Satterstrom et al. (Reference Satterstrom, Kosmicki, Wang, Breen, De Rubeis, An and Klei2020) found age of walking was significantly later in gene expression regulation (GER) genes, which were biased for prenatal expression, than neuronal communication (NC) genes, which were biased toward postnatal expression. Other studies have found functional gene groups with prenatal expression bias were associated with lower IQ (Iossifov et al., Reference Iossifov, O'roak, Sanders, Ronemus, Krumm, Levy and Patterson2014). These findings suggest genes with earlier expression result in more severe behavioral phenotypes and that distinct biological mechanisms may be driving more severe deficits in social communication for carriers of genes expressed highly in prenatal period. Buxbaum and colleagues (Reference Buxbaum, Cicek, Devlin, Klei, Roeder and De Rubeis2017) suggest biological processes involved in intellectual disability begin prior to neuronal differentiation, and fetal resting state connectivity in motor regions has been show to predict postnatal motor development in infancy (Thomason et al., Reference Thomason, Hect, Waller, Manning, Stacks, Beeghly and Hernandez-Andrade2018). Along with general developmental delays, social communication deficits were more severe in the high prenatal expression group relative to the high postnatal expression group. Hudac and colleagues (Reference Hudac, Stessman, DesChamps, Kresse, Faja, Neuhaus and Bernier2017) discovered a potential neurobiological mechanism to explain social processing differences associated with timing of gene expression. Specifically, using scalp electrophysiology, they reported differential mu attenuation sensitization patterns to biological motion specifically among individuals with mutations in embryonically expressed genes relative to those with mutations in nonembryonically expressed genes (Hudac et al., Reference Hudac, Stessman, DesChamps, Kresse, Faja, Neuhaus and Bernier2017).
We did not find significant differences in restricted and repetitive behaviors among transcriptional subtypes. The consistency across both clinician observations and parent ratings suggests this is a valid finding. This result was surprising given the association of repetitive behavior and atypical sensory responsiveness, at the biological level, with cerebellar white matter circuits (Wolff et al., Reference Wolff, Swanson, Elison, Gerig, Pruett, Styner and Estes2017), and at the behavioral level, with lower IQ. This would suggest some independence of impacts of genetic expression timing on general cognition versus RRBs. Most of our sample had some degree of cognitive impairment, and RRBs are prominent among patients with syndromic ID (Leekam, Prior, & Uljarevic, Reference Leekam, Prior and Uljarevic2011). Stereotyped motor behaviors are particularly common among individuals with ID (with or without ASD), which may have decreased power to detect transcriptional subtype differences in other RRB domains. RRB profiles (i.e., patterns of relative behavioral severity across multiple RRB domains) have been shown to distinguish among genetic subtypes of ASD (Arnett et al., Reference Arnett, Rhoads, Hoekzema, Turner, Gerdts, Wallace and Bernier2018). A similar approach might reveal meaningful associations between RRB profiles and temporospatial expression patterns.
Although cerebellar abnormalities are implicated in ASD (Becker & Stoodley, Reference Becker and Stoodley2013; Courchesne, Campbell, & Solso, Reference Courchesne, Campbell and Solso2011), no significant differences were found among carriers of mutations of ASD risk genes with high versus low expression in the postnatal cerebellar cortex. In both low and high postnatal cerebellar groups, expression in noncerebellar brain regions often followed a higher prenatal relative to postnatal expression pattern. Thus, it is possible that the phenotype observed in these groups were driven primarily by expression in noncerebellar regions. In line with this idea, both high and low postnatal cerebellar groups presented with phenotypes similar to the high prenatal expression group. Additionally, cerebellar abnormalities may impact a range of developmental domains. Decreased volume in the posterior vermis is associated with lower cognitive and social functioning, while malformations in the cerebellum are typically associated with deficits in executive function, language, and spatial cognition (Bolduc et al., Reference Bolduc, Du Plessis, Sullivan, Khwaja, Zhang, Barnes and Limperopoulos2011, Reference Bolduc, Du Plessis, Sullivan, Guizard, Zhang, Robertson and Limperopoulos2012; Tavano et al., Reference Tavano, Grasso, Gagliardi, Triulzi, Bresolin, Fabbro and Borgatti2007). As such, the distinct impact of differential cerebellar expression may not be detectable with the variables examined.
Females had greater impairment with respect to nonverbal cognitive and adaptive functioning abilities than males, on average. This finding is consistent with the multiple threshold model of sex differences in neurodevelopmental disorders (Gualtieri & Hicks, Reference Gualtieri and Hicks1985; James & Taylor, Reference James and Taylor1990), which posits that females need multiple or more disruptive genetic variants to be affected. Although the sex effects were smaller within the ASD-only sample, which had a reduced rate of ID and higher proportion of males, the pattern was consistent. Interestingly, males did not outperform females on verbal cognition, which simultaneously indicates a female protective effect with respect to verbal skills. In future research, we plan to further investigate the multiple threshold theory by comparing the severity of males’ genetic impact to that of females.
Results were generally consistent across analyses including all participants and those including only participants with an ASD diagnosis. This supports the utility of a genetics-first, rather than psychiatric diagnostic, approach to precision medicine care for individuals with ASD- and ID-linked gene disruptions. Limiting analyses only to those with ASD diagnoses restricts our understanding of the potential impact of LGDs across domains of development. For instance, full sample results yielded stronger statistical differences in speech and motor milestone achievement relative to the ASD-only subset, due to larger sample sizes as well as greater phenotypic variability within transcriptional subtypes. Using a genetics-first approach, with ascertainment based on presence of a disruptive genetic event, allows for the investigation of the full phenotypic range for a given gene mutation.
It is important to note that spatiotemporal expression is associated to some degree with genetic function; genes involved in specific neuronal functions may exhibit temporal biases and, as such, may be associated with certain gene expression patterns. For example, Satterstrom and colleagues (Reference Satterstrom, Kosmicki, Wang, Breen, De Rubeis, An and Klei2020) reported postnatal expression bias in genes involved in neuronal communication. However, individual gene functions likely do not precisely capture developmental processes, as genes with the same function may be expressed during different developmental periods and in different brain regions (Li et al., Reference Li, Santpere, Kawasawa, Evgrafov, Gulden, Pochareddy and Zhu2018). Spatiotemporal expression data differentiate aspects of development processes that are not captured by functional gene subtyping. It is possible that the combination of spatiotemporal expression and gene function data would yield greater subtyping precision.
There are several limitations to this study. First, parent reported measures were used, which provided indirect assessment of some behaviors and developmental milestones. Alternative and prospective behavioral measures may provide more accurate and fine-grained data to detect differences among transcriptional subtypes. Second, both the SSC and UW ascertainment methods introduce sample bias. In SSC, individuals were recruited based on a diagnosis of ASD, which we have demonstrated restricts phenotypic variance. In contrast, the UW sample was recruited based on a known genetic mutation and not all individuals had ASD. Although we consider this a strength of the UW recruitment strategy, we acknowledge that individuals referred for clinical or research genetic testing tend to be more impaired, leading to a greater proportion of participants with low cognitive and adaptive functioning and delayed developmental milestones. Finally, our subtyping method was based on bulk tissue analysis of specific brain regions and developmental periods reported by Li et al. (Reference Li, Santpere, Kawasawa, Evgrafov, Gulden, Pochareddy and Zhu2018). However, these tissue samples often contain a variety of cell types with distinct expression patterns even within the same spatiotemporal period. As data on cell-type expression increase, examining phenotypic heterogeneity through cell-type specific expression will provide more precise illumination of biological etiology.
In summary, our preliminary study shows transcriptional subtyping can detect developmental differences at the behavioral level. Through examination of spatial and temporal dimensions of gene expression, we may identify typical developmental molecular/biological processes that are disrupted with ASD risk gene mutations. Utilizing a genetics-first approach aids in parsing phenotypic heterogeneity, which will, in turn, allow the development of more focused interventions that will be effective for each individual. Better understanding of the spatiotemporal impact of gene disruptions among individuals with ASD may aid in directing hypotheses and future experimental studies regarding the phenotypic variability in social communication and other developmental outcomes among children with ASD.
Supplementary Material
The supplementary material for this article can be found at https://doi.org/10.1017/S0954579420000784.
Acknowledgements
We are grateful to all of the families at the participating Simons Simplex Collection (SSC) sites, as well as the principal investigators (A. Beaudet, R. Bernier, J. Constantino, E. Cook, E. Fombonne, D. Geschwind, R. Goin-Kochel, E. Hanson, D. Grice, A. Klin, D. Ledbetter, C. Lord, C. Martin, D. Martin, R. Maxim, J. Miles, O. Ousley, K. Pelphrey, B. Peterson, J. Piggot, C. Saulnier, M. State, W. Stone, J. Sutcliffe, C. Walsh, Z. Warren, E. Wijsman). We appreciate obtaining access to phenotypic data on SFARI Base. Approved researchers can obtain the SSC population dataset described in this study by applying at https://base.sfari.org.
Financial Support
National Institute of Mental Health: 5K99MH116064 to A.B.A.
Conflict of Interest
The authors report no affiliations with or involvement in any organization or entity with any financial interest in the outcome of this project.


