


The present and future management of high-level radioactive waste (HLRW) is a major environmental issue, especially considering its long radiotoxicity (104–106 years). Currently, the deep geological repository (DGR) is the most accepted management option for HLRW long-term isolation (NEA-OECD, 2003; U.S. DOE, 2014). Within the European Union, Finland, Sweden and France are expected to approve a final DGR location before 2020 (Gibney, Reference Gibney2015; Ewing et al., Reference Ewing, Whittleston and Yardley2016). The DGR concept is based on a multi-barrier system (engineered barrier system, EBS) to avoid/delay the release of radionuclides into the biosphere. A generic EBS constructed in a granitic host-rock formation consists of the following parts: (1) a metallic canister as a first barrier in contact with the radioactive waste; (2) a clay barrier surrounding the canister; and (3) concrete to seal and close the galleries.
The clay barrier acts as both a hydraulic seal and a physical-chemical buffer. Bentonite is a swelling clay material that has been selected by most of the waste-management organizations (IAEA-TECDOC-1718, 2013; NEA-OECD, 2003) as an optimal material for the backfilling and sealing of HLRW repositories due to its low permeability, low diffusivity, high retention of cations and swelling capacity (Meunier et al., Reference Meunier, Velde and Griffault1998; Kaufhold et al., Reference Kaufhold, Dohrmann, Sandén, Sellin and Svensson2013; Gómez-Espina & Villar, Reference Gómez-Espina and Villar2016; Kaufhold & Dohrmann, Reference Kaufhold and Dohrmann2018). Concrete and bentonite will be in close contact, and they will interact within each other. In addition, the EBS system will be in contact with flowing groundwater in the host rock, which will affect the long-term safety in case that degradation processes develop. In the long term, the interaction between water, concrete and clay will generate an indeterminately complex chemical system that might compromise the storage security (Savage, Reference Savage2014). Furthermore, its evolution will vary depending on the type of cement and clay used as a barrier (Dauzères et al., Reference Dauzères, Le Bescop, Sardini and Cau Dit Coumes2010; Jenni et al., Reference Jenni, Mäder, Lerouge, Gaboreau and Schwyn2014). Thus, understanding the degradation pathways due to barriers and groundwater interactions and clarifying the critical parameters involved herein are of fundamental interest to advance the DGR design. Conventional Portland-type cementitious materials generate alkaline fluids (pH > 13) by the dissolution of alkali hydroxides and Ca(OH)2 (portlandite) in the porewater of the cement matrix, which may attack smectite crystal lattice in neighbouring clay seals (Liu et al., Reference Liu, Jacques, Govaerts and Wang2014). Therefore, the hyperalkaline front might modify the smectite mineralogy and its properties. Previous investigations have analysed the behaviour of different clays in contact with the hyperalkaline front. However, the concrete should not be simulated by means of a high-pH solution in equilibrium with Ca(OH)2 (pH = 12) or alkali hydroxides (Bildstein & Claret Reference Bildstein, Claret, Tournassat, Steefel, Bourg and Bergaya2015) alone, i.e. omitting the chemical and mineralogical evolution of the concrete itself. Previous works have outlined the relative absence of representative experiments in real clay/concrete interfaces (Gaboreau et al., Reference Gaboreau, Prêt, Tinseau, Claret, Pellegrini and Stammose2011, Reference Gaboreau, Lerouge, Dewonck, Linard, Bourbon, Fialips, Mazurier, Prêt, Borschneck, Montouillout, Gaucher and Claret2012; Bartier et al., Reference Bartier, Techer, Dauzères, Boulvais, Blanc-Valleron and Cabrera2013; Mäder et al., Reference Mäder, Jenni, Lerouge, Gaboreau, Miyoshi, Kimura, Cloet, Fukaya, Claret, Otake, Shibata and Lothenbach2017) and the difficulty of taking into account the effects of real volumes and the composition of solutions migrating through connected porosities (Cuevas et al., Reference Cuevas, Ruiz, Fernández, Torres, Escribano, Regadío and Turrero2016). Moreover, few works have put low-pH cementitious materials in contact with clays (Jenni et al., Reference Jenni, Mäder, Lerouge, Gaboreau and Schwyn2014; Dauzères et al., Reference Dauzères, Achiedo, Nied, Bernard, Alahrache and Lothenbach2016; Lerouge et al., Reference Lerouge, Gaboreau, Grangeon, Claret, Warmont, Jenni, Cloet and Mäder2017). To avoid extreme alkalinity, experiments have been carried out with low-pH cement mortars (pH < 12). Several studies suggest that low-pH cement-based materials have insignificant effects on clay structures (Bäckblom, Reference Bäckblom2005; Berner et al., Reference Berner, Kulik and Kosakowski2013; Cuevas et al., Reference Cuevas, Ruiz, Fernández, Torres, Escribano, Regadío and Turrero2016), while simultaneously they have demonstrated a resistance to granitic groundwater exposure (García Calvo et al., Reference García Calvo, Hidalgo, Alonso and Fernández2010). However, low-pH cements have shown a lower resistance than high-pH cements to the influence of carbonated waters (Dauzères et al., Reference Dauzères, Le Bescop, Cau-Dit-Coumes, Brunet, Bourbon, Timonen, Voutilainen, Chomat and Sardini2014) as some of the cement paste hydration products, such as ettringite, are more unstable (Trotignon et al., Reference Trotignon, Devallois, Peycelon, Tiffreau and Bourbon2007) and precipitate calcite and gypsum. Low-pH cement-based materials may display carbonation, but the high-pH cementitious materials may develop a larger protective calcium carbonate film that increases the retardation of the decalcification process, at least temporarily (Jenni et al., Reference Jenni, Mäder, Lerouge, Gaboreau and Schwyn2014). In addition to these uncertainties, the complex structure and chemistry of the mineral phases formed during the alkaline perturbation at these interfaces were unclear until a few years ago (Bildstein & Claret, Reference Bildstein, Claret, Tournassat, Steefel, Bourg and Bergaya2015), but recent experiments have examined and provided new characterizations of their structure and chemistry (Roosz et al., Reference Roosz, Grangeon, Blanc, Montouillout, Lothenbach, Henocq, Giffaut, Vieillard and Gaboreau2015; Nied et al., Reference Nied, Enemark-Rasmussen, L'Hopital, Skibsted and Lothenbach2016; Lerouge et al., Reference Lerouge, Gaboreau, Grangeon, Claret, Warmont, Jenni, Cloet and Mäder2017). This might be the case for mineral phases such as magnesium silicate hydrates (M-S-H) or calcium aluminium silicate hydrates (C-A-S-H; Lothenbach et al., Reference Lothenbach, Nied, L'Hôpital, Achiedo and Dauzères2015). The composition of concrete includes a wide range of mineral phases such as calcium silicate hydrates (C-S-H) with different Ca/Si ratios and aluminate-, calcium- and sulfate-bearing phases such as ettringite and calcium monosulfate-aluminate hydrate (CmSAH; Van Damme & Pellenq, Reference Van Damme, Pellenq, Bergaya and Lagaly2013). Experimental research on C-S-H in low-pH concretes is sparse, and their parameters of formation and stabilization are not yet known sufficiently to allow for a feasibility assessment.
In this context, small-scale laboratory experiments might be significant because they approach real conditions through a simplified system, facilitating the control of different parameters and allowing the assessment of the different possible conditions expected in a DGR. These experiments may provide reaction pathways on a short time scale, making them useful tools as sources of data for geochemical modelling. In addition, they can complement other types of experiments, such as batch experiments or large in situ underground laboratory experiments. Consequently, the aim of this study was the development and optimization of a new representative small-scale laboratory experiment able to reproduce the contact between concrete and bentonite that would occur in a DGR and to test procedures and methods for assessing and describing the geochemical perturbations under different conditions.
MATERIALS AND METHODS
Experimental setup and characterization techniques
The pilot experiment was performed using distilled water, simulating diluted granitic groundwater, low-pH cement mortar and FEBEX-bentonite as the reference Spanish bentonite for the DGR. The experiment was run for 75 days under isothermal conditions (25 ± 5°C), based on the range of temperatures expected at the concrete–bentonite interface according to the data provided by Villar et al. (Reference Villar, Martín, Bárcena, García-Siñeriz, Gómez-Espina and Lloret2012) for a FEBEX in situ experiment after 13years for a sealing concrete plug in a granitic DGR. The low-pH cement mortar and the compacted FEBEX-bentonite clay were placed in a 4 mm-thick methacrylate sleeve confined by two stainless steel cylindrical caps (Fig. 1). The cell dimensions were 20 mm in internal diameter and 9 mm in height for each material (18 mm in total). The objective of the design of these cells included the minimization of undesirable effects during the dismantling of the cells for further solid characterization, such as the tedious separation of cement mortar and bentonite from the carcase and the creation of fractures or deformations in both materials, avoiding the interaction of the materials with the atmosphere. The design of a compact external stainless-steel case (together with connections and filters) able to resist the high-pressure conditions (1–5 MPa) caused by the hydration of bentonite (Villar & Lloret, Reference Villar and Lloret2004) was required. The setup of columns also involved two porous steel filters that allowed pressurized water infiltration. The constant hydraulic head of the distilled water was fixed to 1 MPa using an automatic piston pump (Gilson, 307 model) and carried through PEEK tubes. The cement mortar–bentonite interface generated (referred to hereafter as the C–B interface) and the cement mortar–distilled water interface (referred to hereafter as the C–W interface) were separated by a 0.45 µm polytetrafluoroethylene (PTFE) membrane to facilitate the separation of materials and access to both interfaces. The infiltrated water was collected in a syringe for the aqueous-phase survey. This effluent was subjected to the determination of the following: (1) alkalinity using a Metrohm 888™ potentiometric titrator; (2) soluble silica in water (as SiO2) by spectrophotometric determination of molybdate-reactive silica in the effluent using a Milton Roy Spectronic® instrument at a wavelength of 825 nm; and (3) major chemical ions by ion chromatography coupled to a conductivity detector using a Metrohm 802 compact IC plus model.
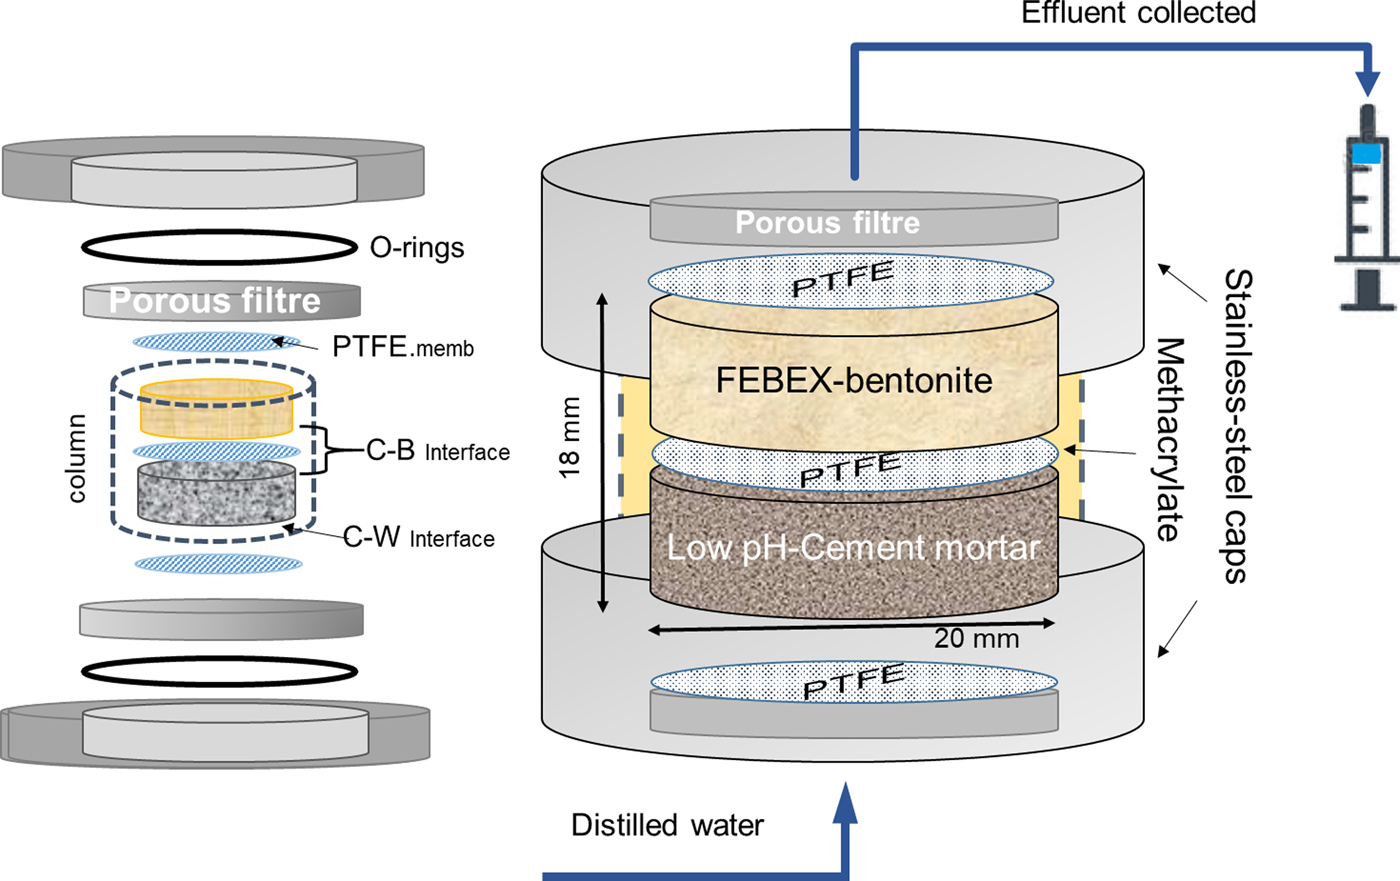
Fig. 1. Compacted column formed from cement mortar and compacted bentonite. Both materials are separated by a PTFE membrane and encased in an open, stainless-steel sleeve. A methacrylate piece seals the column. Two porous filters allow water transport at both column ends. C–B: cement mortar–bentonite interface; C–W: cement–water interface.
The hydraulic conductivity (k) was calculated by Darcy's law according to equation 1:
 $$Q = k/A*\Delta h/\Delta L\eqno (1)$$
where Q = the quantity of water leached over time t (m3/s); k = hydraulic conductivity (m/s); A = cross-sectional area (m2); Δh = hydraulic head (m); and L = column length.
The solid-phase characterization was performed by X-ray diffraction (XRD), grazing incidence X-ray diffraction (GI-XRD) and by using a scanning electron microscope attached to an energy dispersive X-ray analyser (SEM-EDX). The mineral identification by XRD was performed on bulk, randomly oriented cement mortar and bentonite powders using a θ/2θ X'Pert PANalytical instrument with an X'Celerator detector. The XRD patterns were recorded over the angular range 3–70°2θ. This method allowed measurements equivalent to 0.016° angular steps for 100 s at each step. The voltage and intensity of the X-ray Cu tube were 45 kV and 40 mA, respectively. To perform the GI-XRD analyses, angles of 1°, 5° and 8°2θ were used with 0.04°2θ of angular step and 2 s time step increases, respectively. The SEM-EDX equipment consisted of an Hitachi S-3000N SEM coupled with an INCAx-sight Oxford Instruments™ energy dispersive X-ray analyser. The EDX quantification was performed by means of internal standard semi-quantitative analyses.
Semi-quantitative EDX elemental composition analysis was performed for the following reasons: (1) to determine the elemental composition variations along a linear transect through the whole cement-mortar/bentonite composite probe, taken from the hydration mortar face to the porewater outflow at the end of the compacted bentonite; and (2) to perform localized point analyses to describe either the chemistry of the cement mortar matrix for the intergranular zones between the quartz grains or the discrete mineral-phase compositions where singular morphologies (crystals, polycrystalline aggregate-defined morphologies) were distinguished. To evaluate the quality of these results, EDX spectra of a heterogeneous 300 μm × 200 µm area, typical of the analysis performed on the linear transect in the cement mortar, were acquired using various integration times, from 10 s to 80 s, at 5 s intervals. The % deviation was calculated as 100 times the ratio of the standard deviation to the determined % chemical element value. For major elements in the concrete (Al, Si and Ca), instrumental % deviations, obtained by taking their average value in the 30–50 s interval, were <10%, related to their concentration being less for silicon (<1%) and greater for Al (9%) (Table 1). The % deviation from measured values, however, was <6% for the average measurement value. For elements that have contents within 1–5% (K, Fe), the % deviation from the average of the measured values was typically 10–15%. A period of 40 s was considered to be sufficient that the analysis quality would not be compromised and to avoid excessively time-consuming data acquisition. In terms of the point analyses, with a typical 5 μm × 5 µm spot, the analysis data for a needle-like ettringite polycrystalline aggregate are shown in Table 1. In general terms, the atomic ratios obtained, considering that some impurities are always present (Si phases and carbonates), are within 10–15% deviation using theoretical values for ettringite.
Table 1. Relatiive error evaluation of SEM-EDX-determined chemical element concentrations.
*The selected integration time to determine any SEM-EDX measurement was 40 s. The element % is referenced to the sum of the major analysed elements, excluding C and O (normally, the sum of Mg, Al, Si, K, S, Ca, and Fe).
**Deviation data are expressed as a percentage given by the ratio of the standard deviation to the value determined using either the instrumental standard deviation of the integrated signal counts (ID: instrumental deviation) or the average value of several measurements (MD: measurement deviation).
***Analyses for ettringite were described by Fernández et al. (Reference Fernández, Torres, Ruiz, Cuevas, Alonso, García Calvo, Rodríguez and Turrero2017).
FEBEX-bentonite
The experiments were performed using FEBEX-bentonite from the Cortijo de Archidona deposit (Almería, Spain; Caballero et al., Reference Caballero, de Cisneros, Huertas, Huertas, Pozzuoli and Linares2005). The physical-chemical properties of the FEBEX-bentonite, as well as its most relevant thermo-hydro-mechanical and geochemical properties, have been studied extensively and published elsewhere (e.g. ENRESA, Reference Villar2006). The FEBEX-bentonite was compacted with its hygroscopic water content (13%) at room conditions (23 ± 1°C) and at a nominal dry density of 1.60 g/cm3. Finally, the bentonite was placed inside the methacrylate sleeve (Fig. 1).
Low-pH cement mortar
The low-pH cement binder was prepared with ordinary Portland cement (OPC) CEM I 42.5 R SR mixed with silica fume (SF) (OPC [60 wt.%] + SF [40 wt.%]). Both materials were provided by the Eduardo Torroja Institute for Construction Science from CSIC (Spanish National Research Council). Subsequently, a 0.42 ratio of distilled water/binder and a 1:3 ratio of binder/silica sand (grain size <1 mm) were added. The fresh, low-pH cement mortar obtained was pressed inside the methacrylate sleeve and covered by the PTFE membrane. After the bentonite was compacted to fill the whole sleeve, the cement mortar was stored in a hydration chamber and exposed to a water-saturated atmosphere for 90 days. The chemical composition of the low-pH cement mortar (Table 2) and the composition of major ions in the pore solution after 90 days of curing time (presumably at equilibrium) were provided by García Calvo (Reference García Calvo2012; Table 3). To obtain an initial reference sample, a slice of the initial low-pH cement mortar was cut, polished and characterized by SEM-EDX. The pH measured in the pore solution of the initial low-pH cement mortar (Table 3) was obtained following the leached ex situ method (García Calvo, Reference García Calvo2012). The powder XRD patterns and GI-XRD showed the absence of portlandite [Ca(OH)2] and the presence of C-S-H together with characteristic clinker phases that were not yet hydrated (Fig. 2). The SEM images showed homogeneously distributed grains of silica sand within the cement matrix (Fig. 3a). In addition, the reference low-pH cement mortar showed the presence of non-reacted silica fume grains which indicated incomplete dispersion. Nevertheless, the conversion of portlandite to C-S-H was complete. The EDX analyses were conducted considering only the cement matrix and taking a representative number of analyses, where silica grains were avoided intentionally. Under these conditions, a Ca/Si ratio of 0.9 ± 0.1 was obtained, representative of the cement matrix composition (based on 14 analyses; see the detail of the spot size selected in Fig. 3a; a supplementary Table S1 with EDX data has been provided and is available here (https://doi.org/10.1180/clm.2018.16)). This result can be applied to the C-S-H composition present in the reference low-pH cement mortar as C-S-H are the main and almost unique hydrated phases present in the binder (García Calvo et al., Reference García Calvo2012). The Ca/Si ratios determined are in agreement with Stronach & Glasser (Reference Stronach and Glasser1997), who indicated that to obtain a low pH in the cement materials, the Ca/Si ratio should be <1.1. Additionally, the SiO2 content in these ratios might be overestimated due to the presence of small micro-silica particles (silica fume) (García Calvo et al., Reference García Calvo, Hidalgo, Alonso and Fernández2010). In the point analysis, acicular morphologies typical of ettringite were observed locally (Fig. 3b). The EDX chemical analyses corroborate the identification of such mineral phases (Al/S = 0.8; theoretical Al/S = 0.67), although they cannot be detected and quantified in the XRD patterns.
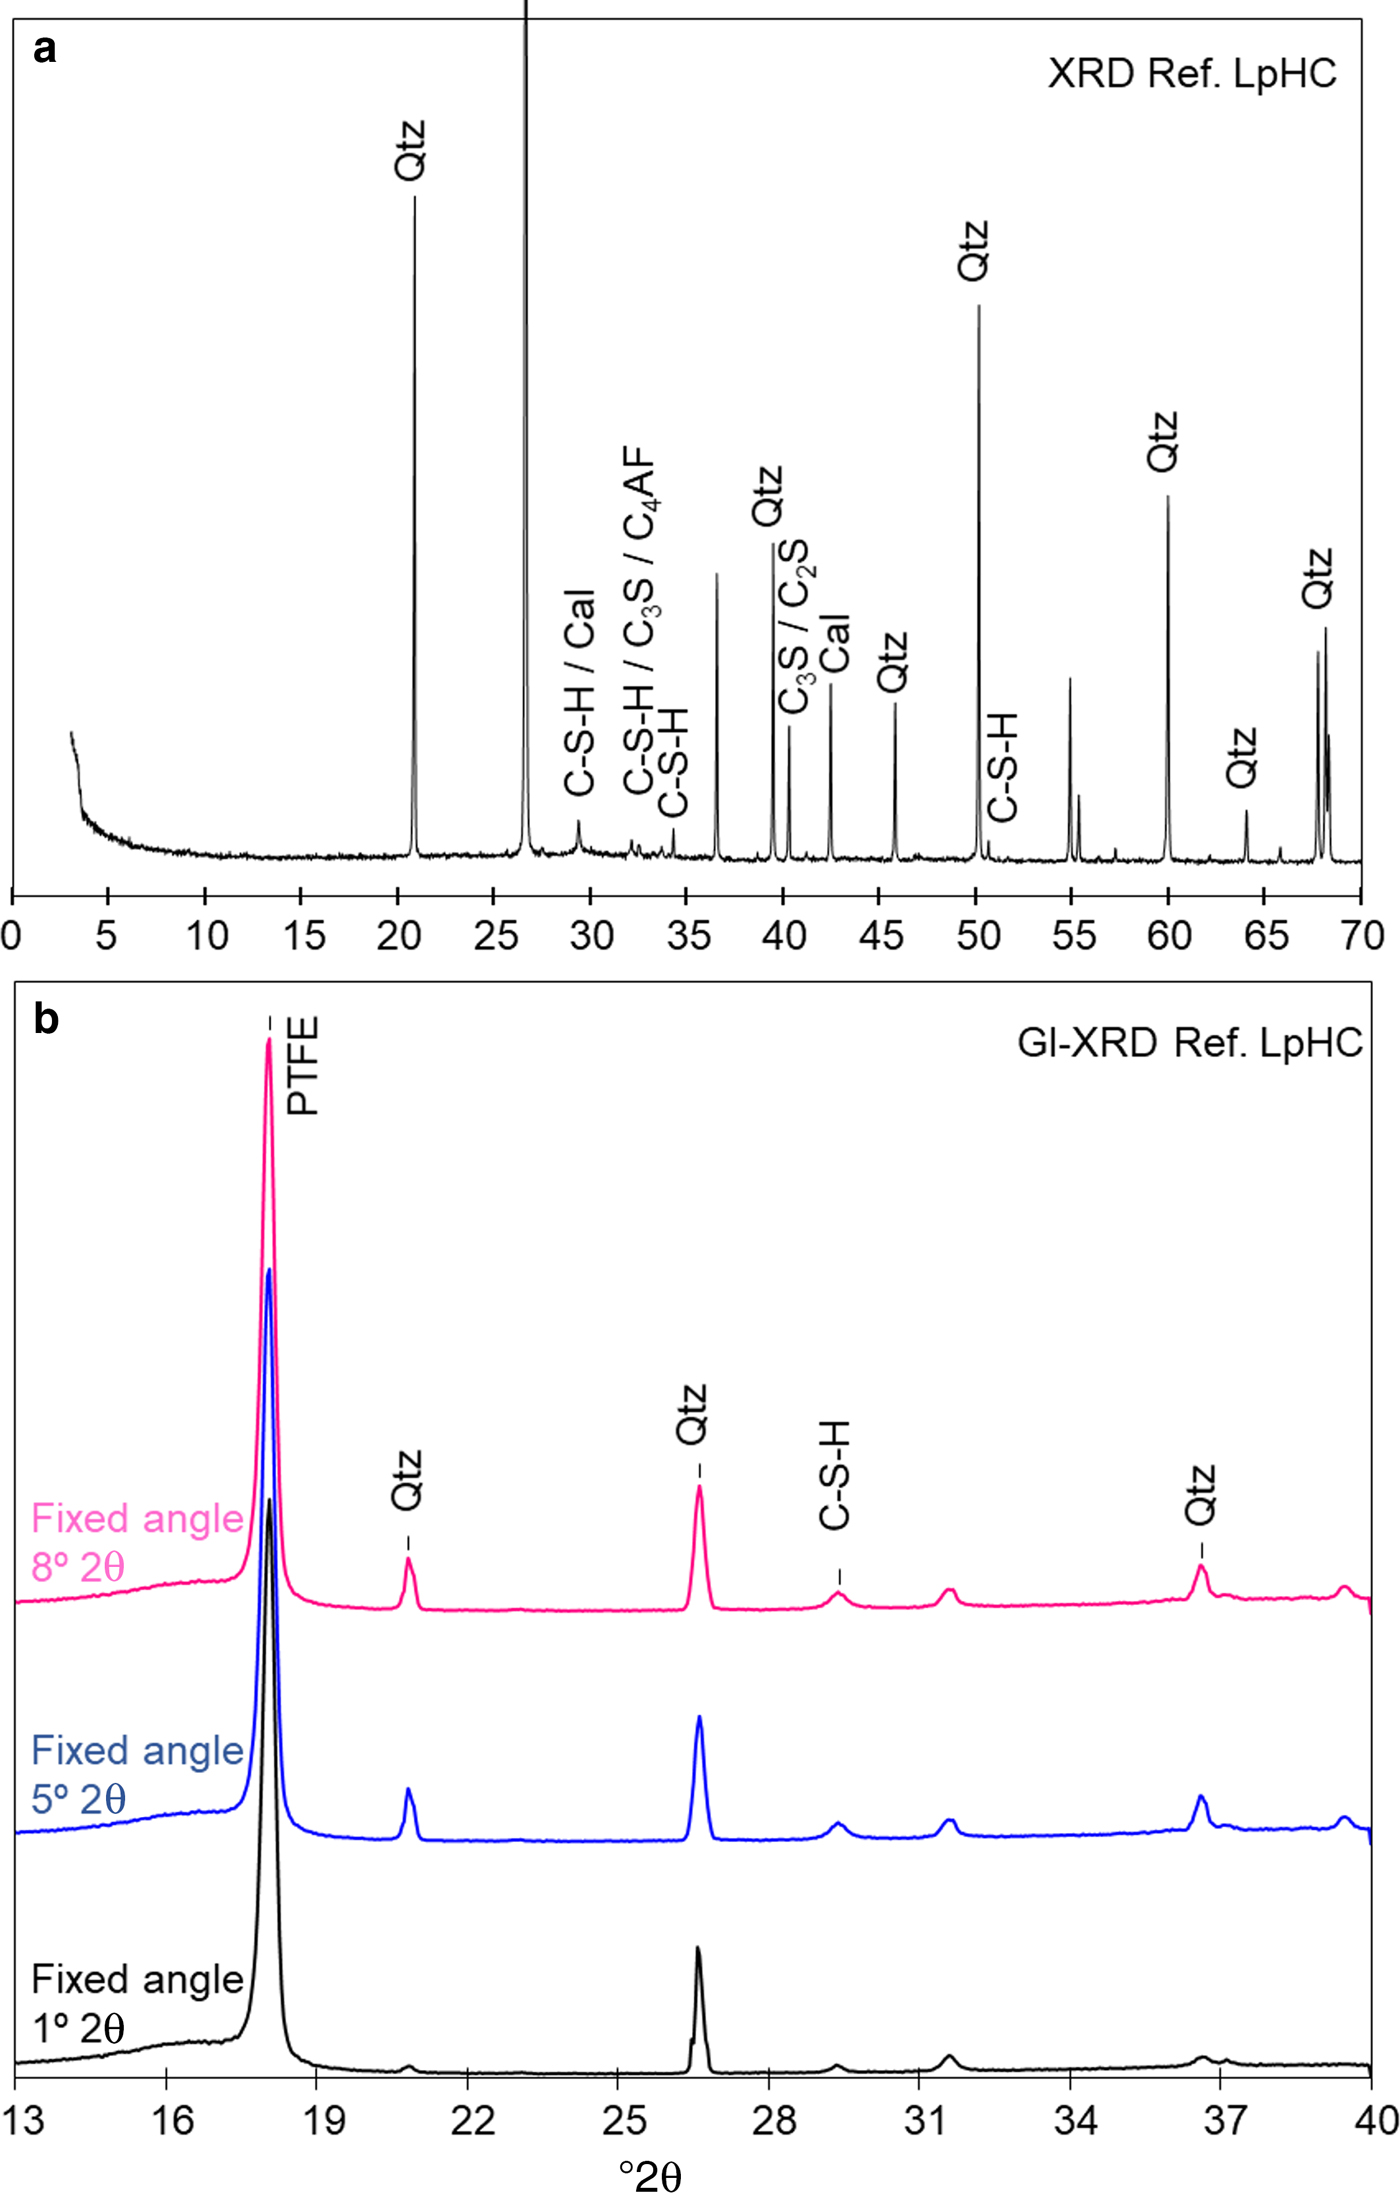
Fig. 2. (a) XRD traces of the reference low-pH cement mortar (ref. Low-pHC); (b) GI-XRD patterns with fixed angles of 8°, 5°, and 1°2θ of the initial-reference, low-pH cement mortar. Qtz: quartz. Cal: calcite. C3S: tricalcium silicate. C4AF: tetracalcium aluminoferrite. C-S-H: calcium silicate hydrates. C2S: dicalcium silicate. PTFE: polytetrafluoroethylene. d spacings of reflections are given in Å.
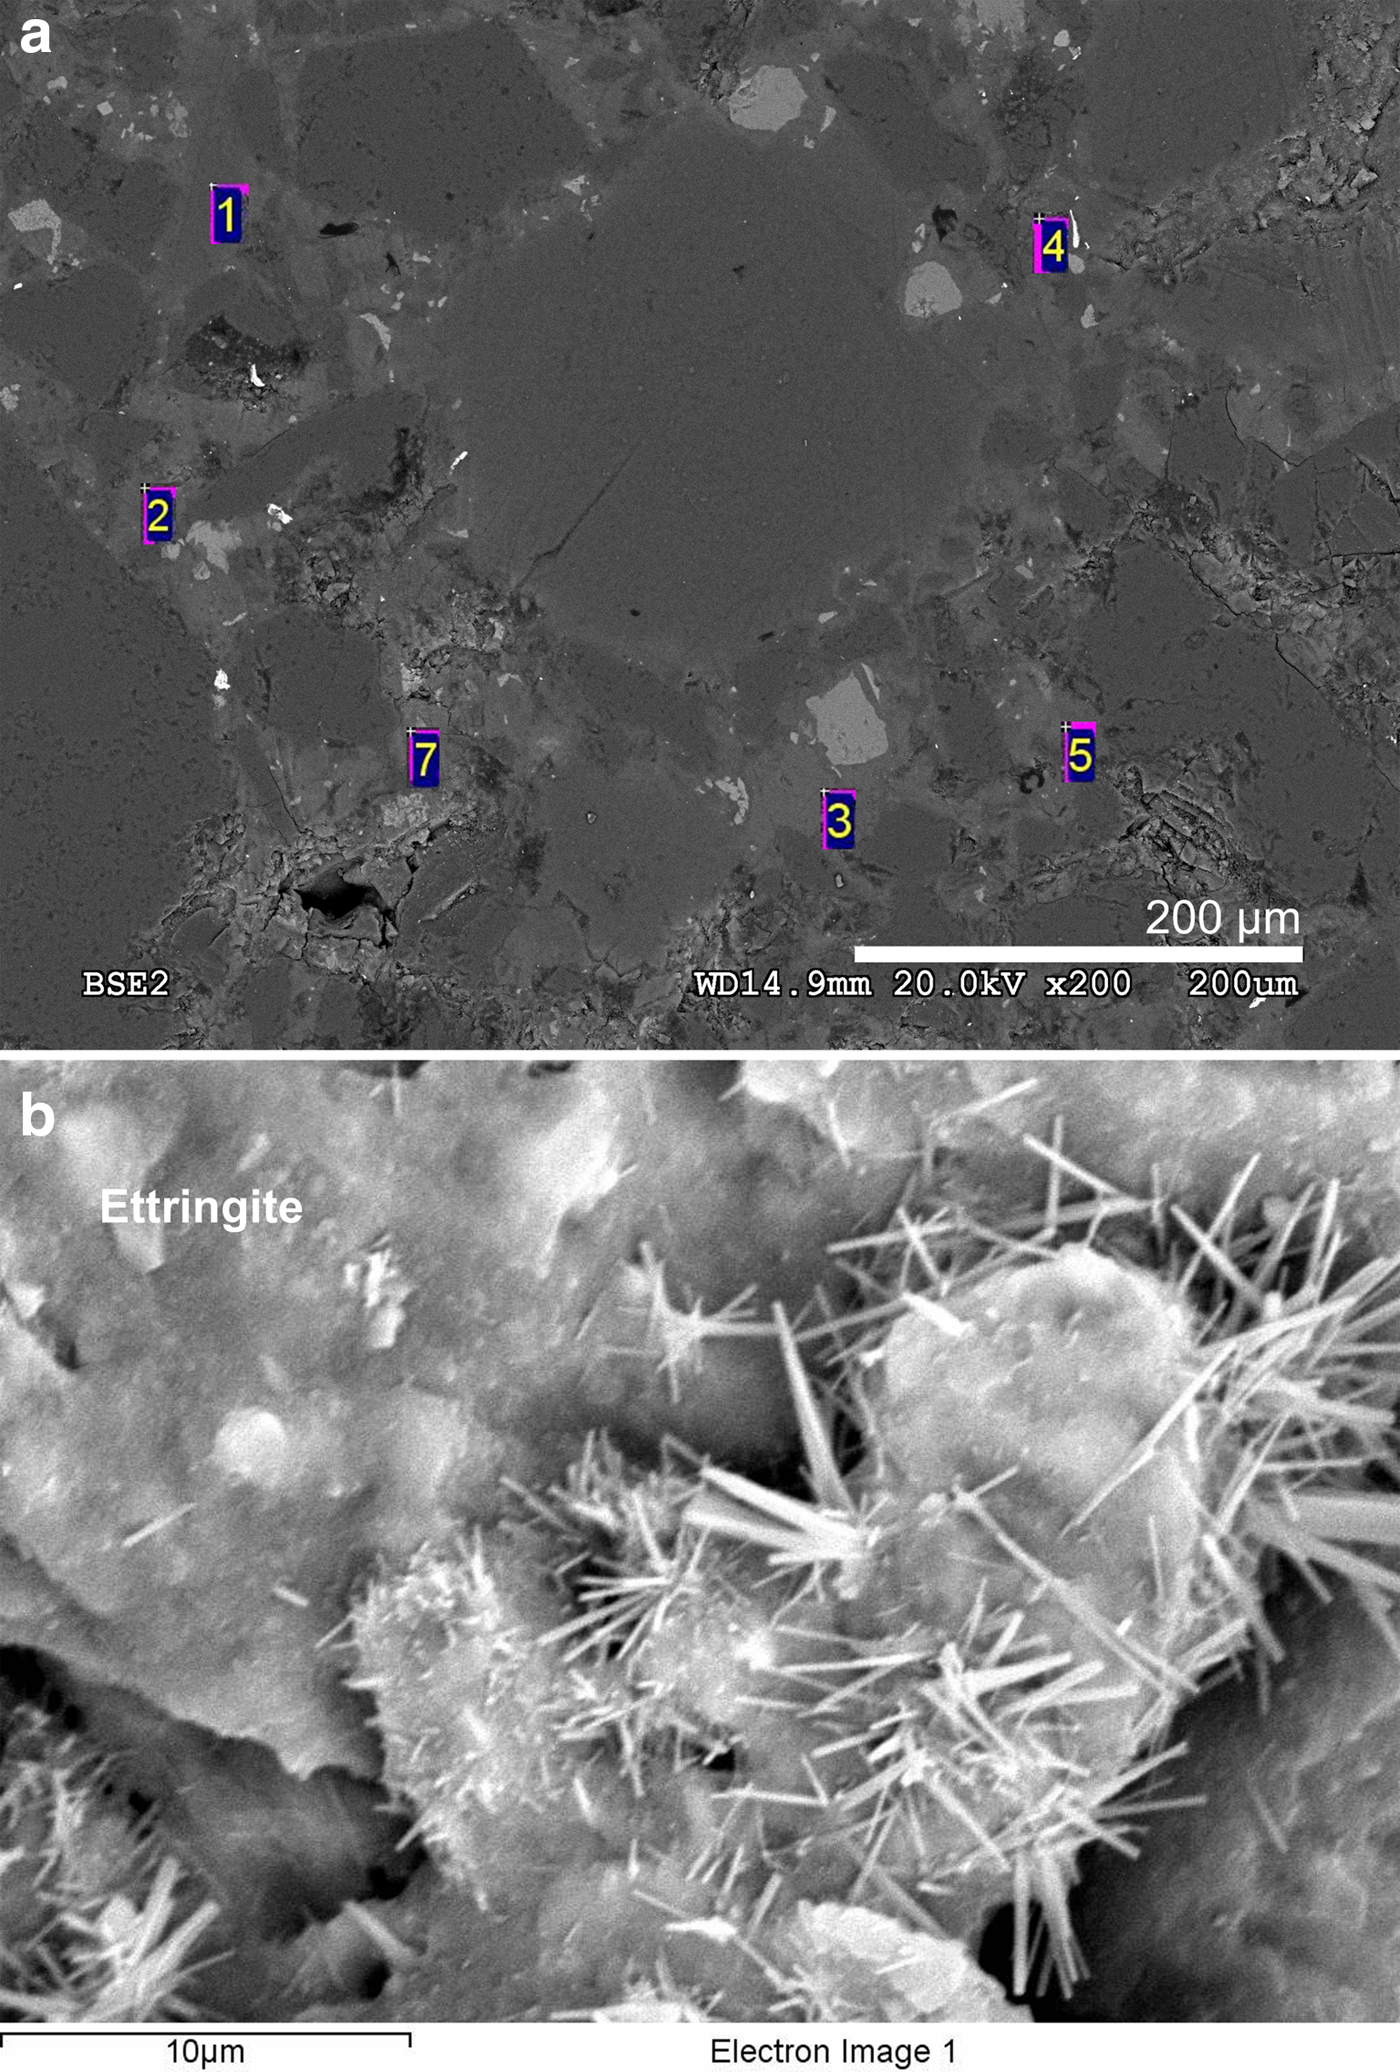
Fig. 3. (a) SEM-EDX spots analysed in the initial-reference, low-pH cement mortar to calculate the Ca/Si ratio in the cement matrix. (b) Acicular ettringite crystals in local regions of the initial-reference, low-pH cement mortar. The numbers correspond to EDX analysis points.
Table 2. Chemical composition (wt.%) of ordinary Portland cement (OPC) and silica fume (SF) (García Calvo, Reference García Calvo2012).
Table 3. Major ions, alkalinity, aqueous silica and pH in the effluent and chemical composition of a reference low-pH cement mortar (LpHC) pore solution (90 days old) provided by García Calvo (Reference García Calvo2012).
nd: not determined
Dismantling, cutting and sampling
After 75 days of reaction, the cement mortar-bentonite column was dismantled and divided into subsamples using a Well®2000 cutting machine model with a diamond wire saw. Various subsamples were sliced from the initial column (Fig. 4). The number of subsamples and their sizes were determined by the quantity needed to carry out the post-mortem analyses.
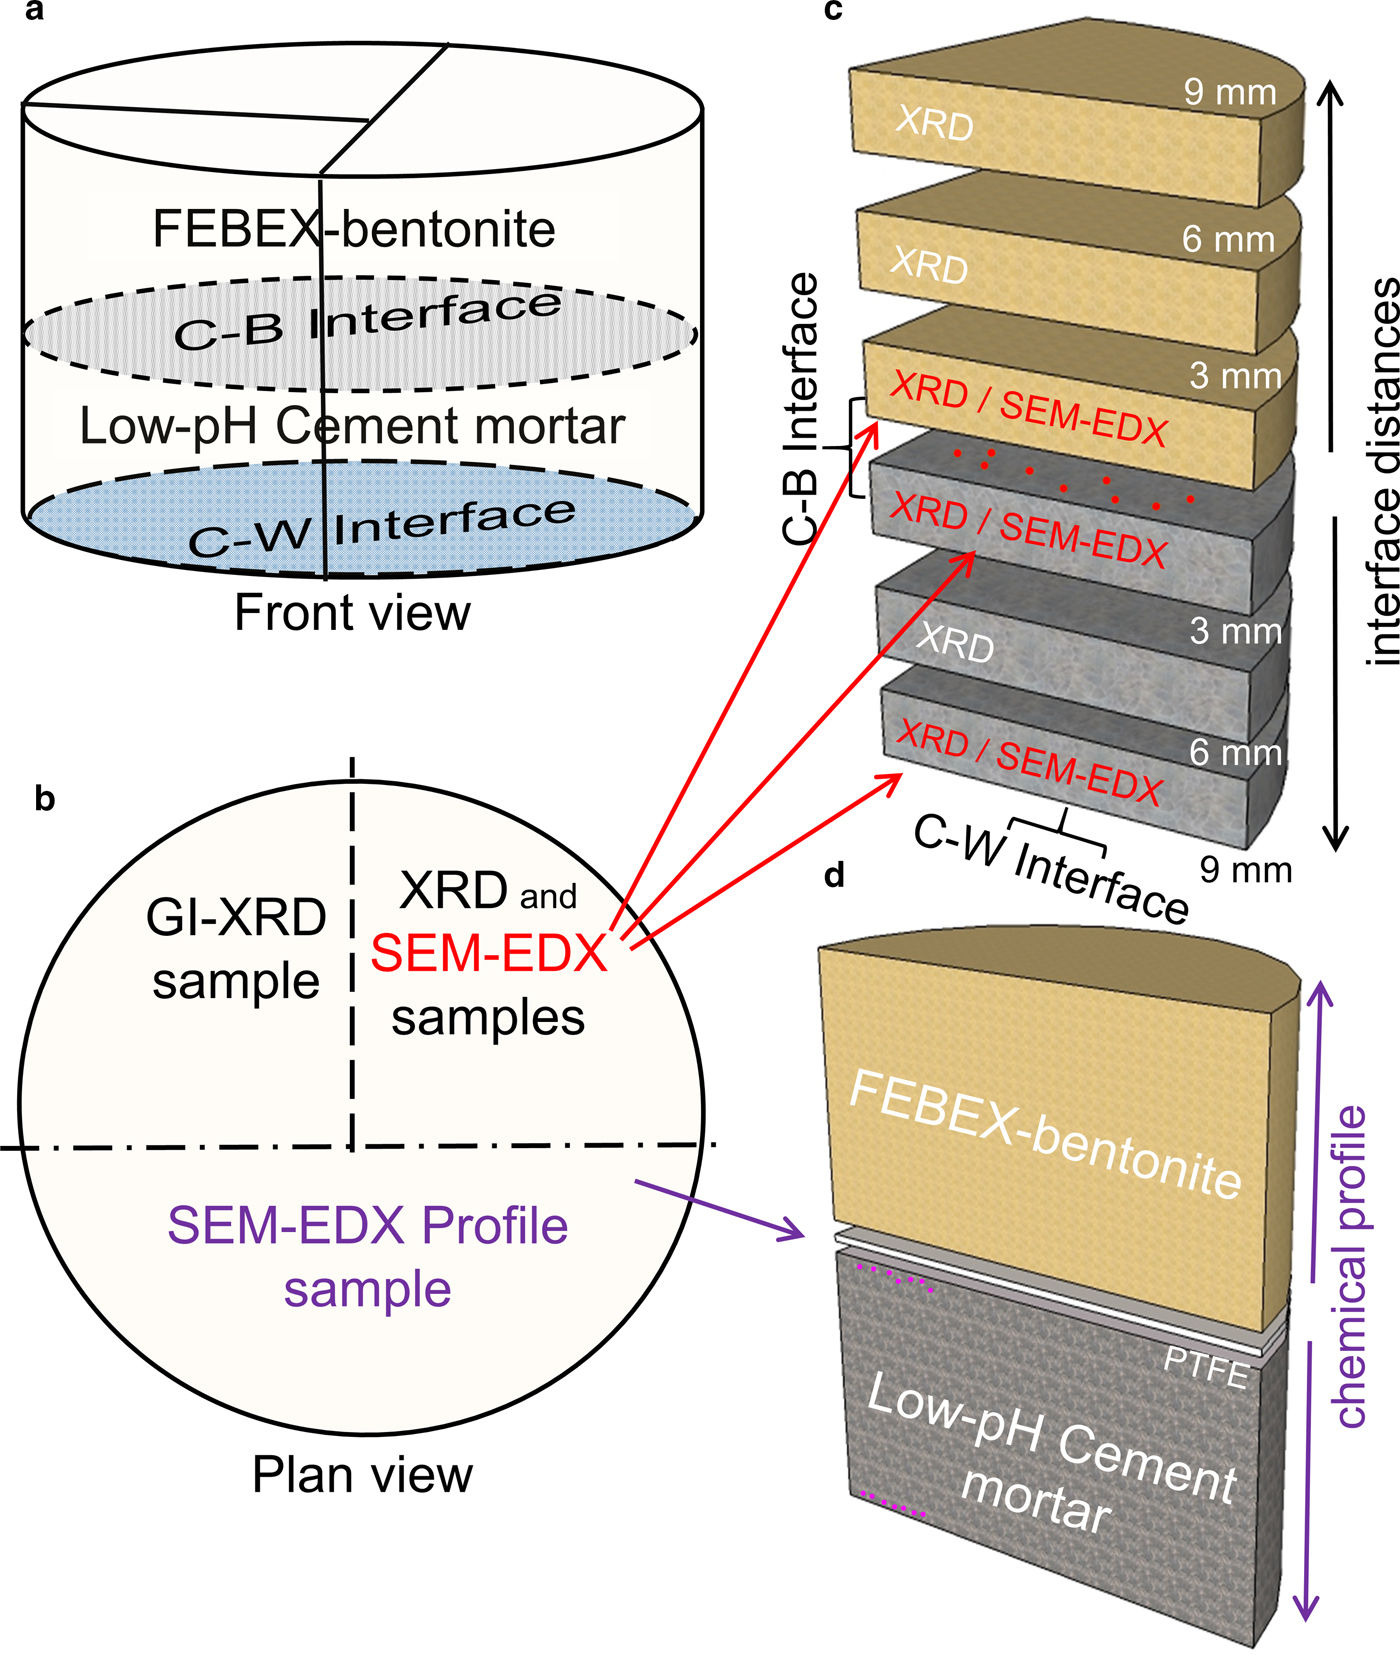
Fig. 4. Cutting and sampling scheme. (a) Front view where the cement mortar-bentonite (C–B) interface and the cement mortar–water (C–W) interface have been drawn. (b) Plan view of the cement mortar–bentonite column. (c) Subsample segmentation for XRD and punctual SEM-EDX analyses performed on the surfaces of the subsamples next to the C–B and C–W interfaces. (d) Sample for SEM-EDX profile analyses and punctual SEM-EDX analyses near the C–B and C–W interfaces.
A half-sample of the cement mortar-bentonite column was divided into two: one quarter was used to perform XRD and SEM-EDX analyses, and the other quarter was used to perform GI-XRD analyses. All analyses were performed to study the interaction between the cement and bentonite and the effects of the water flow. The subsample prepared for XRD and SEM-EDX analyses was sliced into six new subsamples, each 3 mm thick, parallel to the interface (Fig. 4). The segmentation permitted the study of perturbations as a function of distance from the interface (3, 6 and 9 mm) and then the assessment of the spatial progress of the geochemical reactions. Finally, prior to performing the analyses, these subsamples were dried in a vacuum chamber.
The other half-sample was used for optical inspection to analyse a longitudinal chemical profile of the elemental distribution along the column axis measured by SEM-EDX and was used to carry out spot EDX analyses on the cement matrix near the C–W interface and C–B interface. This profile sample was freeze-dried in liquid nitrogen, dried under vacuum in a P2O5-dehydrated atmosphere until 10–4 Pa and polished up to 2500 grit sheet sandpaper.
The chemical profile was obtained by SEM-EDX analyses in selected areas. Using the C–B interface as a reference, EDX analyses were conducted towards the bentonite end of the column and towards the interface with the infiltrating water solution (C–W interface). Ten analyses with rectangular dimensions of 10 µm in the direction perpendicular to the C–B interface and ~120 µm in the direction parallel to the C–B interface were performed. The next five analyses had dimensions of 100 μm × 300 µm in directions perpendicular and parallel to the C–B interface, respectively. Finally, eight analyses towards the bentonite column end and ten analyses towards the C–W interface of 1 μm × 3 mm were performed. The analysed areas are illustrated in Fig. 5.
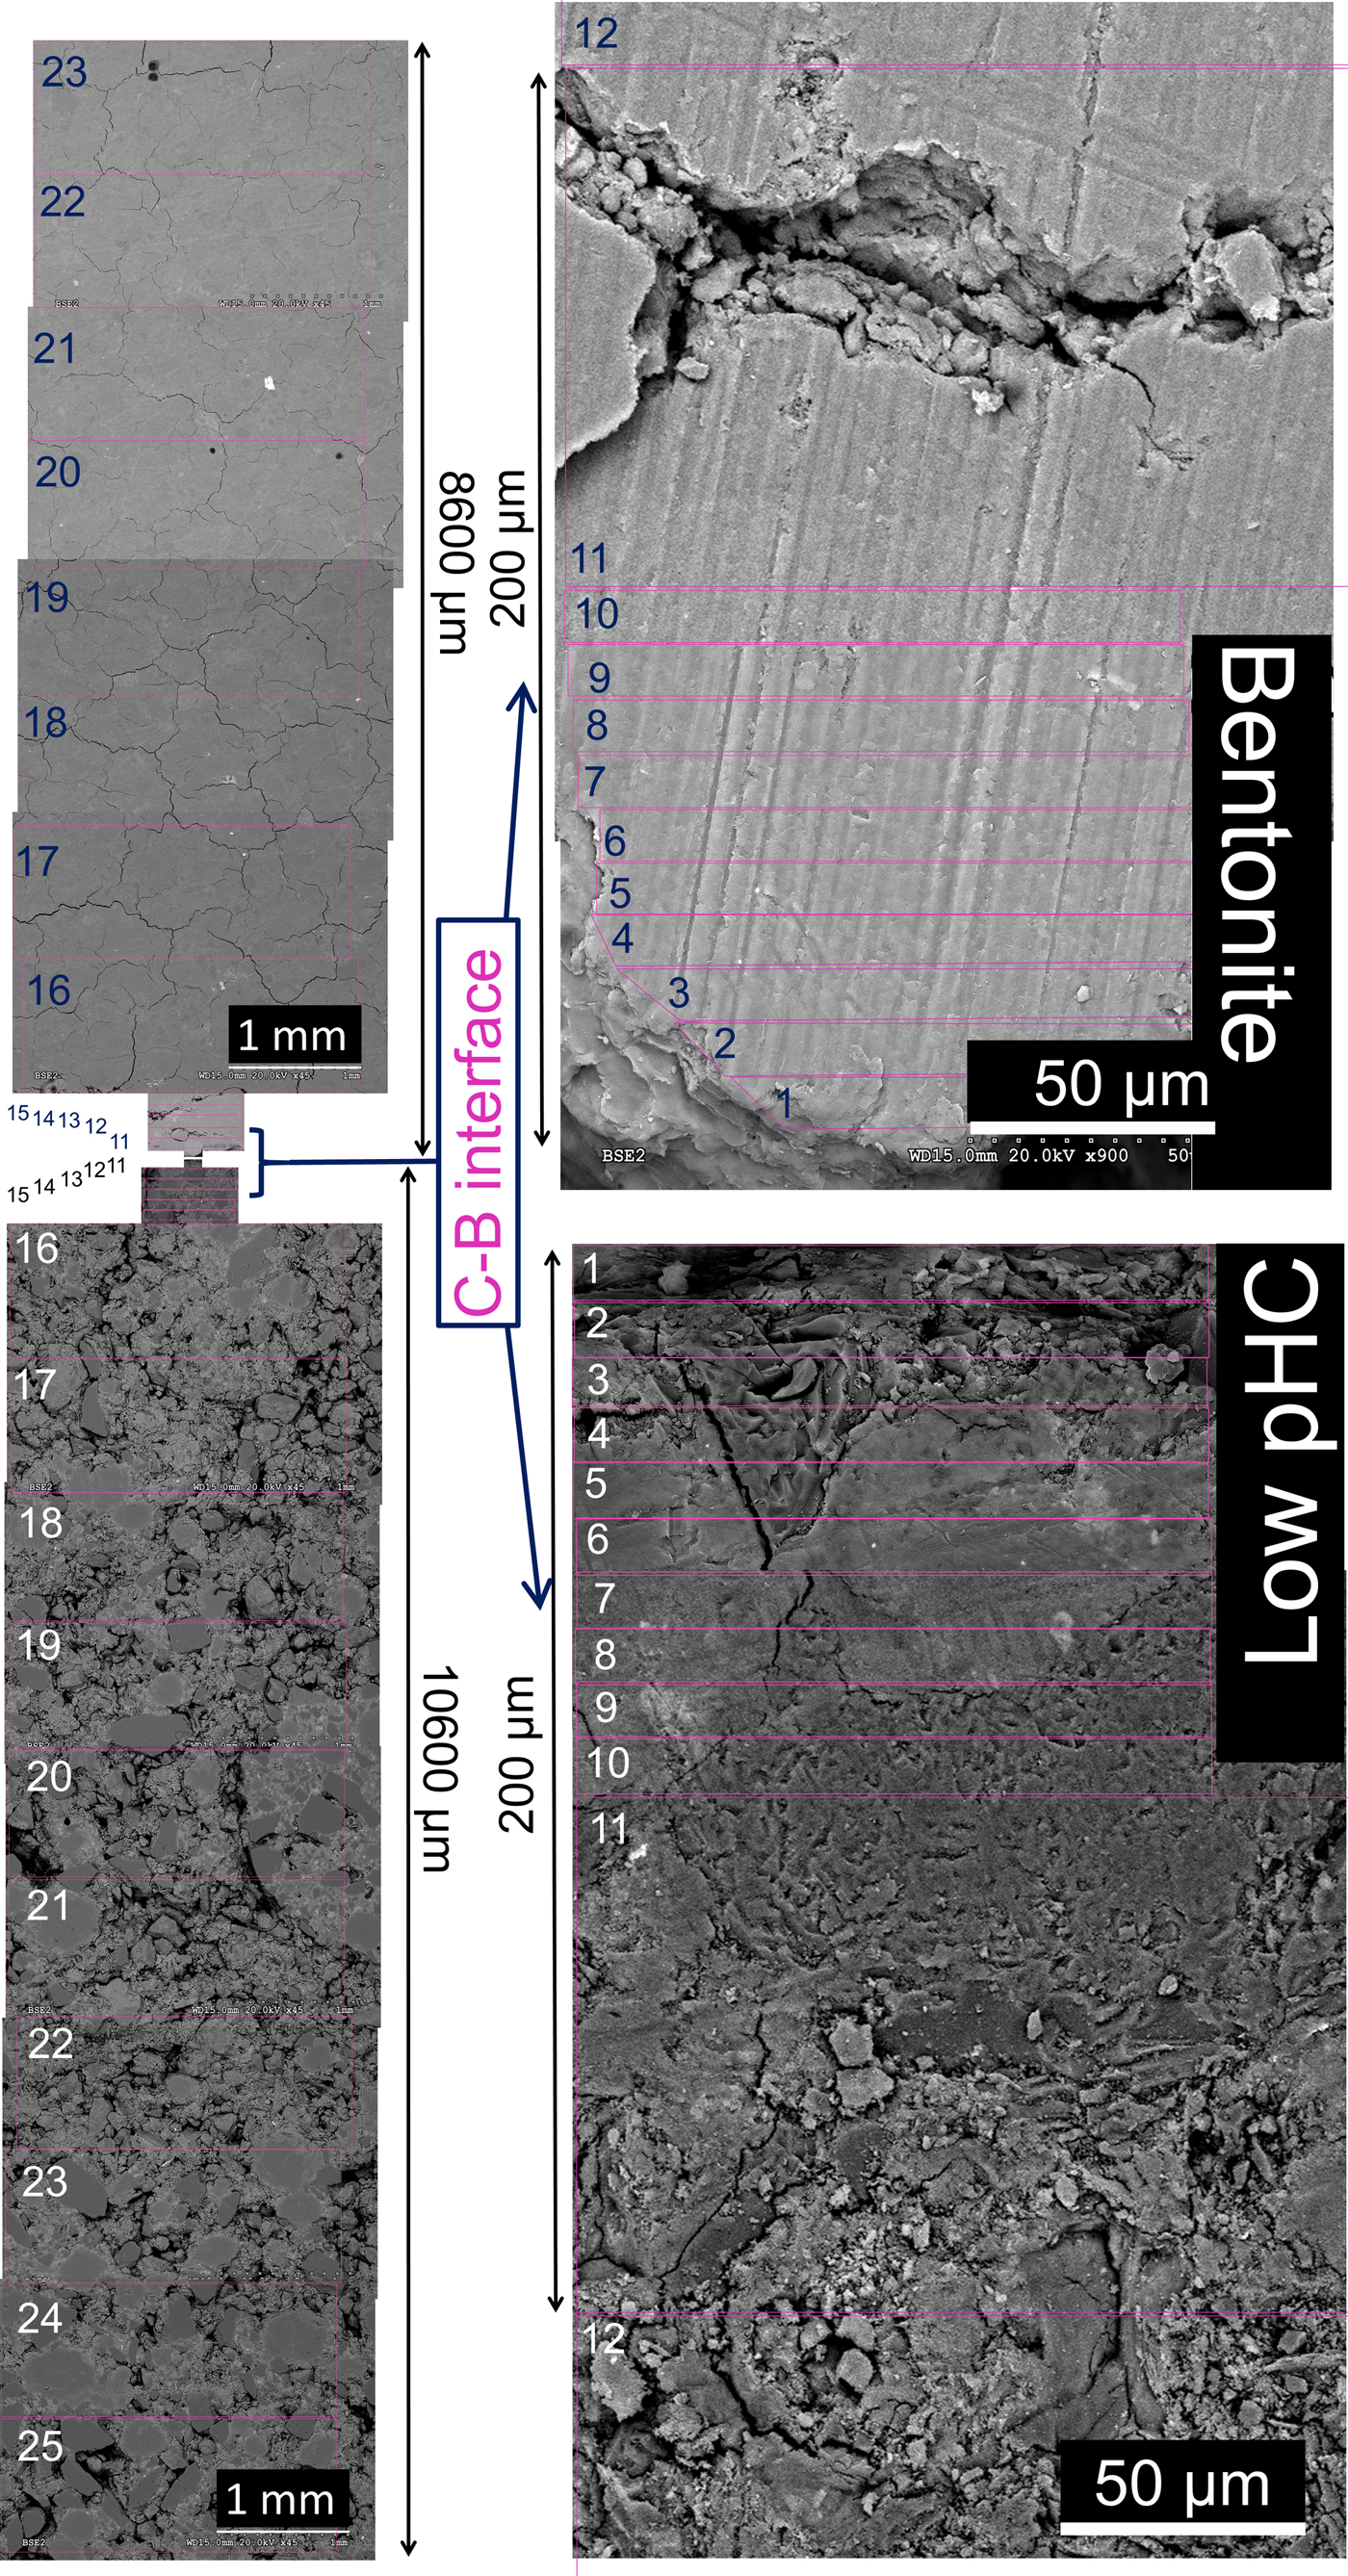
Fig. 5. Backscattered electron (BSE) images showing an overview of the methodology used to create the SEM-EDX profile of the elemental compositions in the cement mortar-bentonite column. Note the increasing magnification at the interface region.
RESULTS
Aqueous phase
The volume of aqueous solution effluent collected after 75 days was 2.03 mL. The concentrations of major ions, aqueous SiO2, the alkalinity, and the pH are listed in Table 3. The calculated hydraulic conductivity (equation 1) was 1.6×10⁻¹³ m/s based on a single measurement.
General overview of the small-scale pilot laboratory experiment
The profile sample of the post-mortem low-pH cement mortar-bentonite column is shown in the backscattered electron image (Fig. 5). The freeze-drying process, in preparation for the SEM-EDX analyses, produced a decrease in the bentonite volume and a few macroscopic cracks in the bentonite part. However, the general aspect of the bentonite texture remained homogeneous. The low-pH cement mortar showed an increased presence of air voids (Fig. 5) compared to the reference cement mortar sample (Fig. 3a), suggesting a leaching process of the cement matrix towards bentonite.
The chemical composition profiles obtained by EDX analyses illustrate the elemental distribution along the complete column axis (Fig. 6a). The main chemical perturbations were observed at the C–B interface, although a visible decrease in Ca was also observed in the cement mortar near the C–W interface.
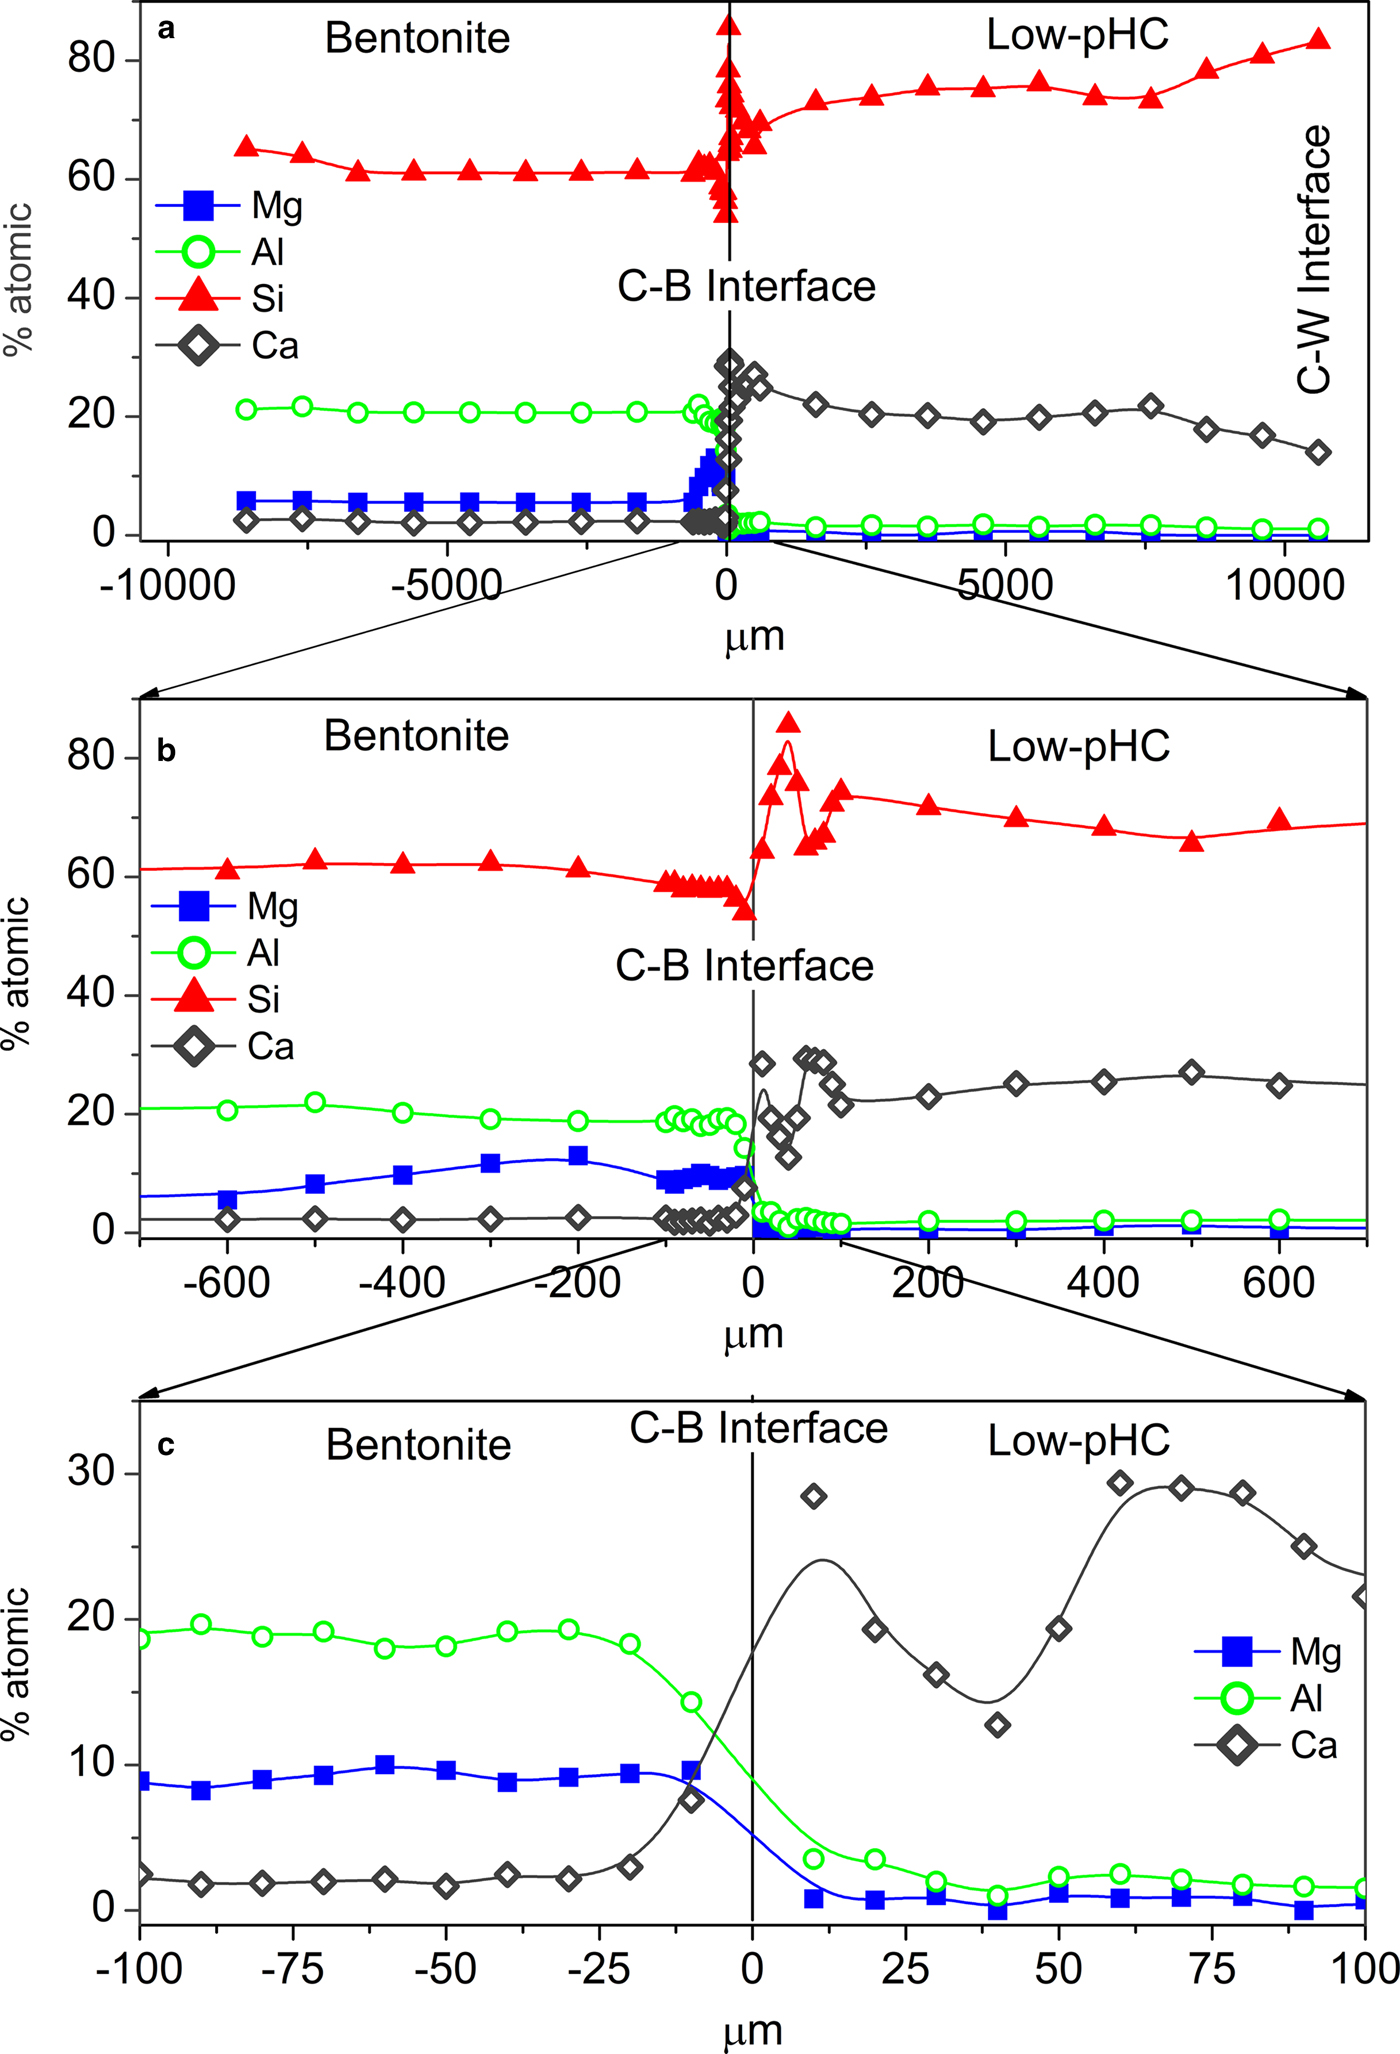
Fig. 6. EDX profile of the column at different scales: (a) 1000 µm, (b) 600 µm, and (c) 100 µm. Bentonite is shown on the left side and low-pH cement mortar (Low-pHC) on the right side of the figure.
Low-pH cement mortar perturbations
The chemical profile showed a slight decrease in the percentage of Ca over the first 3 mm from the C–W interface (Fig. 6a). Conversely, the EDX profile showed an increase in Ca towards the C–B interface, and close to the C–B interface (in the range 0–100 µm); two peaks of Ca were observed with an associated opposite effect on the Si concentration (Fig. 6b-c). A slight increase in Al (2.5–4.0%) was observed in the cement mortar near the C–B interface (25 µm), and although the increase in concentration is low, it is significant within an established 20–25% relative error (Fig. 6c). In addition, spot SEM-EDX analyses performed on the polished cement mortar sample near the C–W interface showed Ca/Si ratios in the range 0.7 ± 0.1 (based on eight analyses performed on selected cement matrix regions; Fig. 7a), while the spot analyses obtained near the C–B interface showed Ca/Si ratios in the range 0.8 ± 0.1 (based on seven analyses also performed on selected cement matrix regions; Fig. 7b). Moreover, the morphologies of C-S-H (with a Ca/Si ratio = 0.6 obtained by EDX) and ettringite-like crystals (Al/S = 0.6) were observed on the surface of low-pH cement in contact with only the bentonite (Fig. 8a–b). The XRD analyses of the reference low-pH cement mortar sample and the post-mortem subsamples are shown in Fig. 9a–b. The XRD trace shows weak changes at 3.04–3.06 Å among the reference low-pH cement mortar and the low-pH cement mortar subsamples. Regarding the reference low-pH cement mortar, characteristic reflections of C-S-H phases (2.79 Å, 2.75 Å, 2.66 Å and 2.61 Å) were not observed clearly in the post-mortem subsamples. In addition, a reflection at 3.03 Å was observed in the subsample next to the C–B interface; this reflection is characteristic of calcite and sharper than the reflection at 3.04–3.06 Å. The GI-XRD patterns of the surface of the low-pH cement mortar (separated by a PTFE membrane from the bentonite) showed little difference from the patterns recorded on the reference material (Fig. 10a). A subtle peak broadening and a shift from 3.05 to 3.03 Å was also detected in the low fixed-angle (1°) pattern, representing a small thickness surficial cement mortar area accessible to the X-rays. The SEM-EDX images and spot analyses of the same subsample showed typical calcite morphologies composed of Ca and carbon (Fig. 11a).
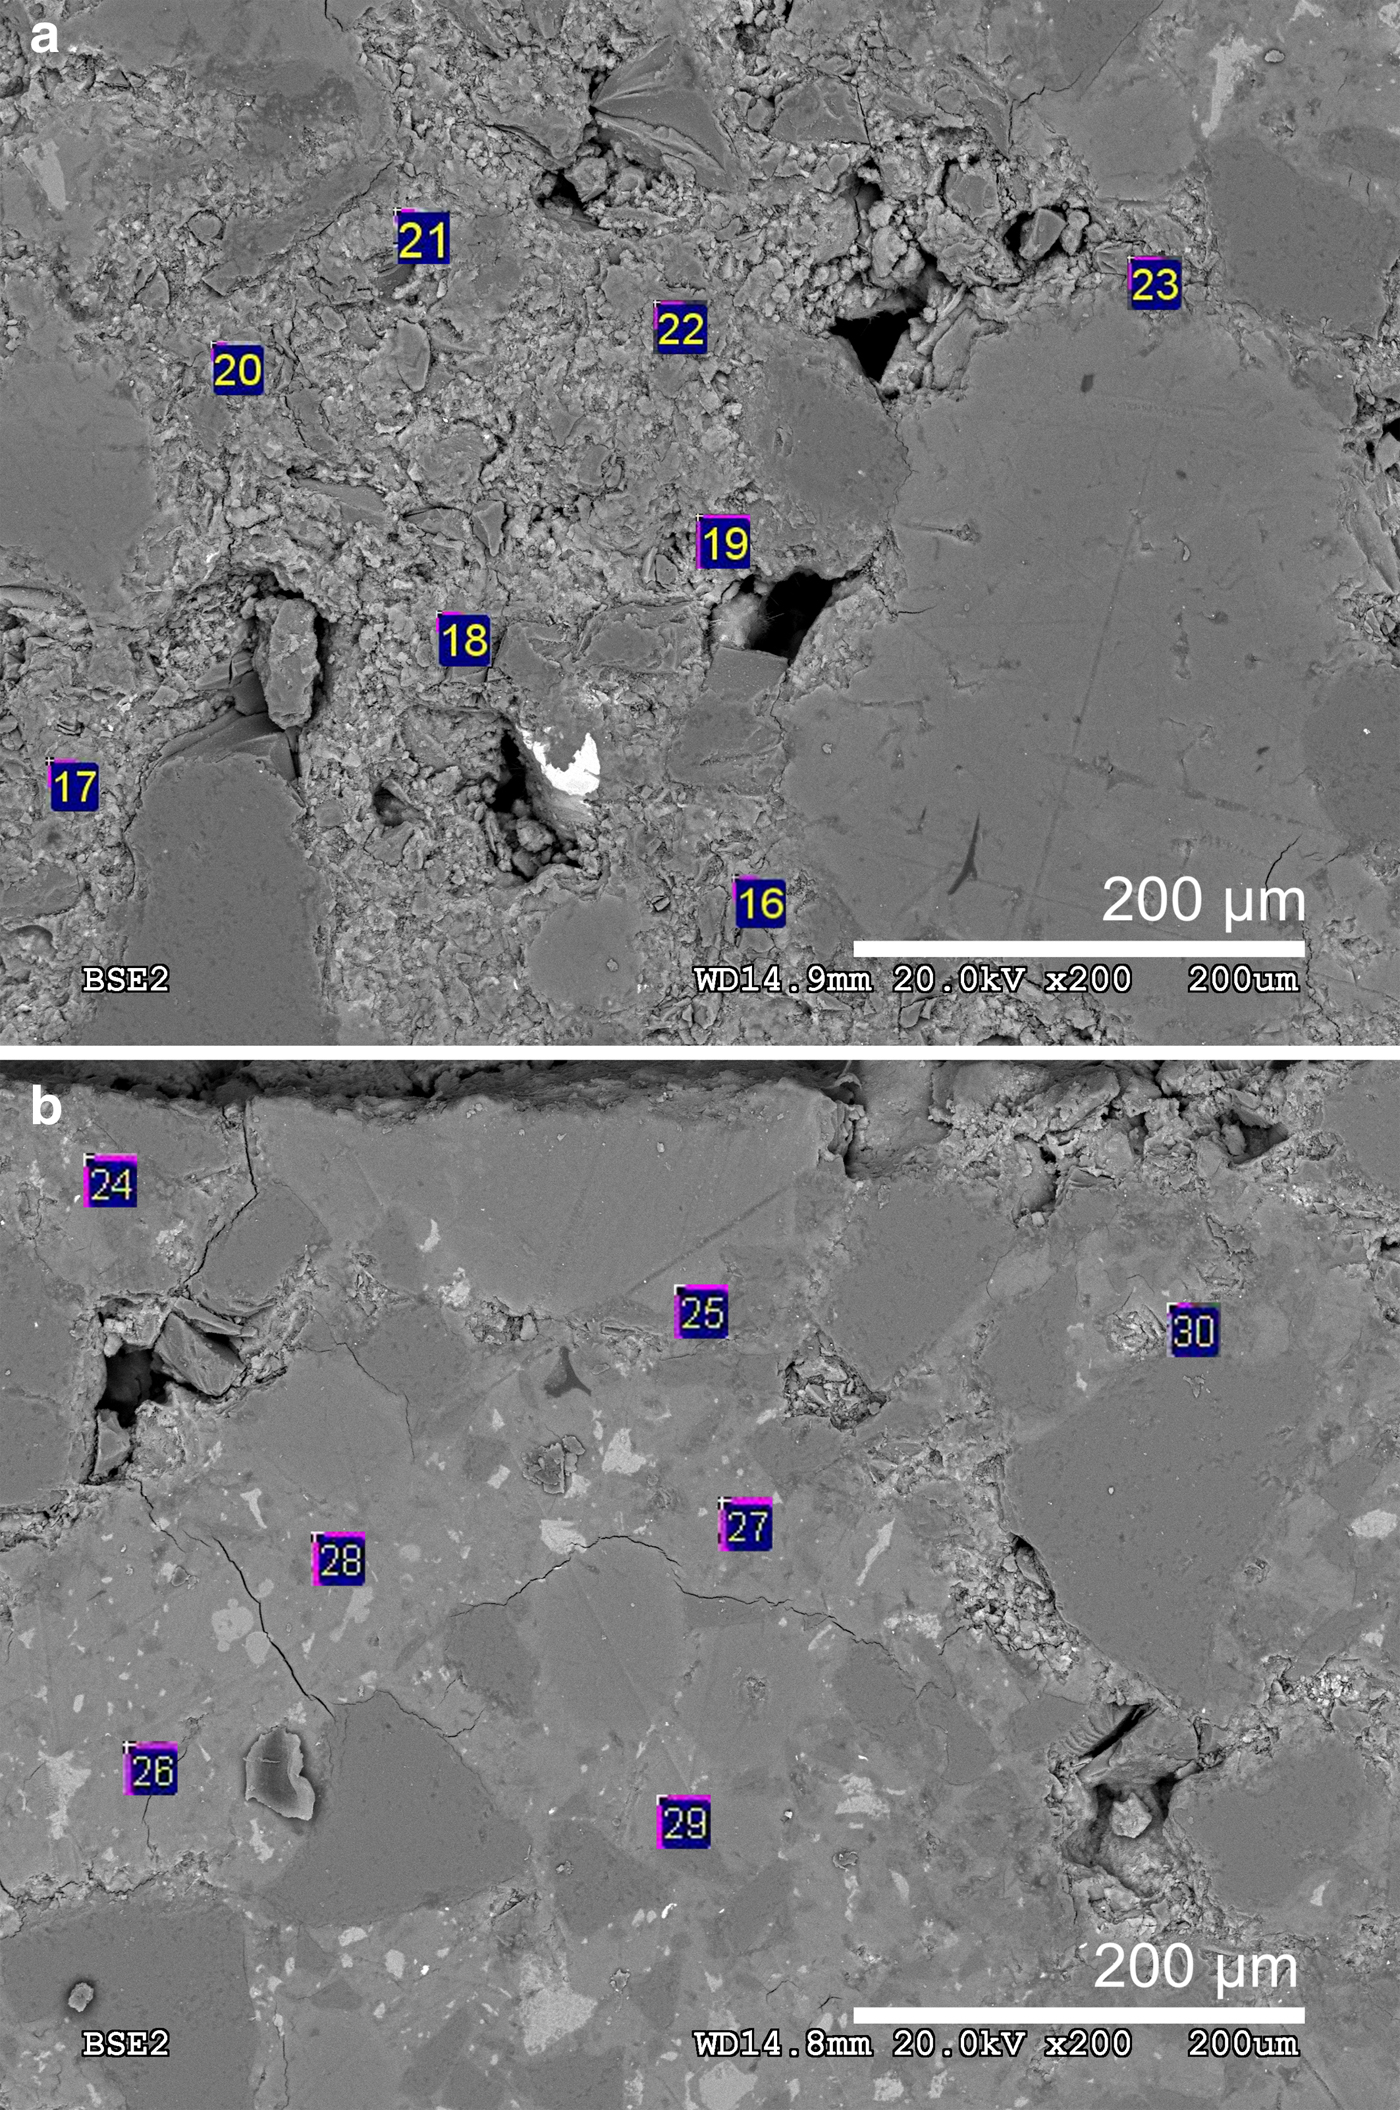
Fig. 7. (a) Locations of the SEM-EDX spots analysed in the cement matrix of the low-pH cement mortar near the C–W interface and (b) spots analysed in the cement matrix of the low-pH cement mortar near the C–B interface.
Fig. 8. Backscattered electron (BSE) images: (a) C-S-H present on the low-pH cement mortar side next to bentonite; and (b) ettringite present on the low-pH cement mortar side next to bentonite.
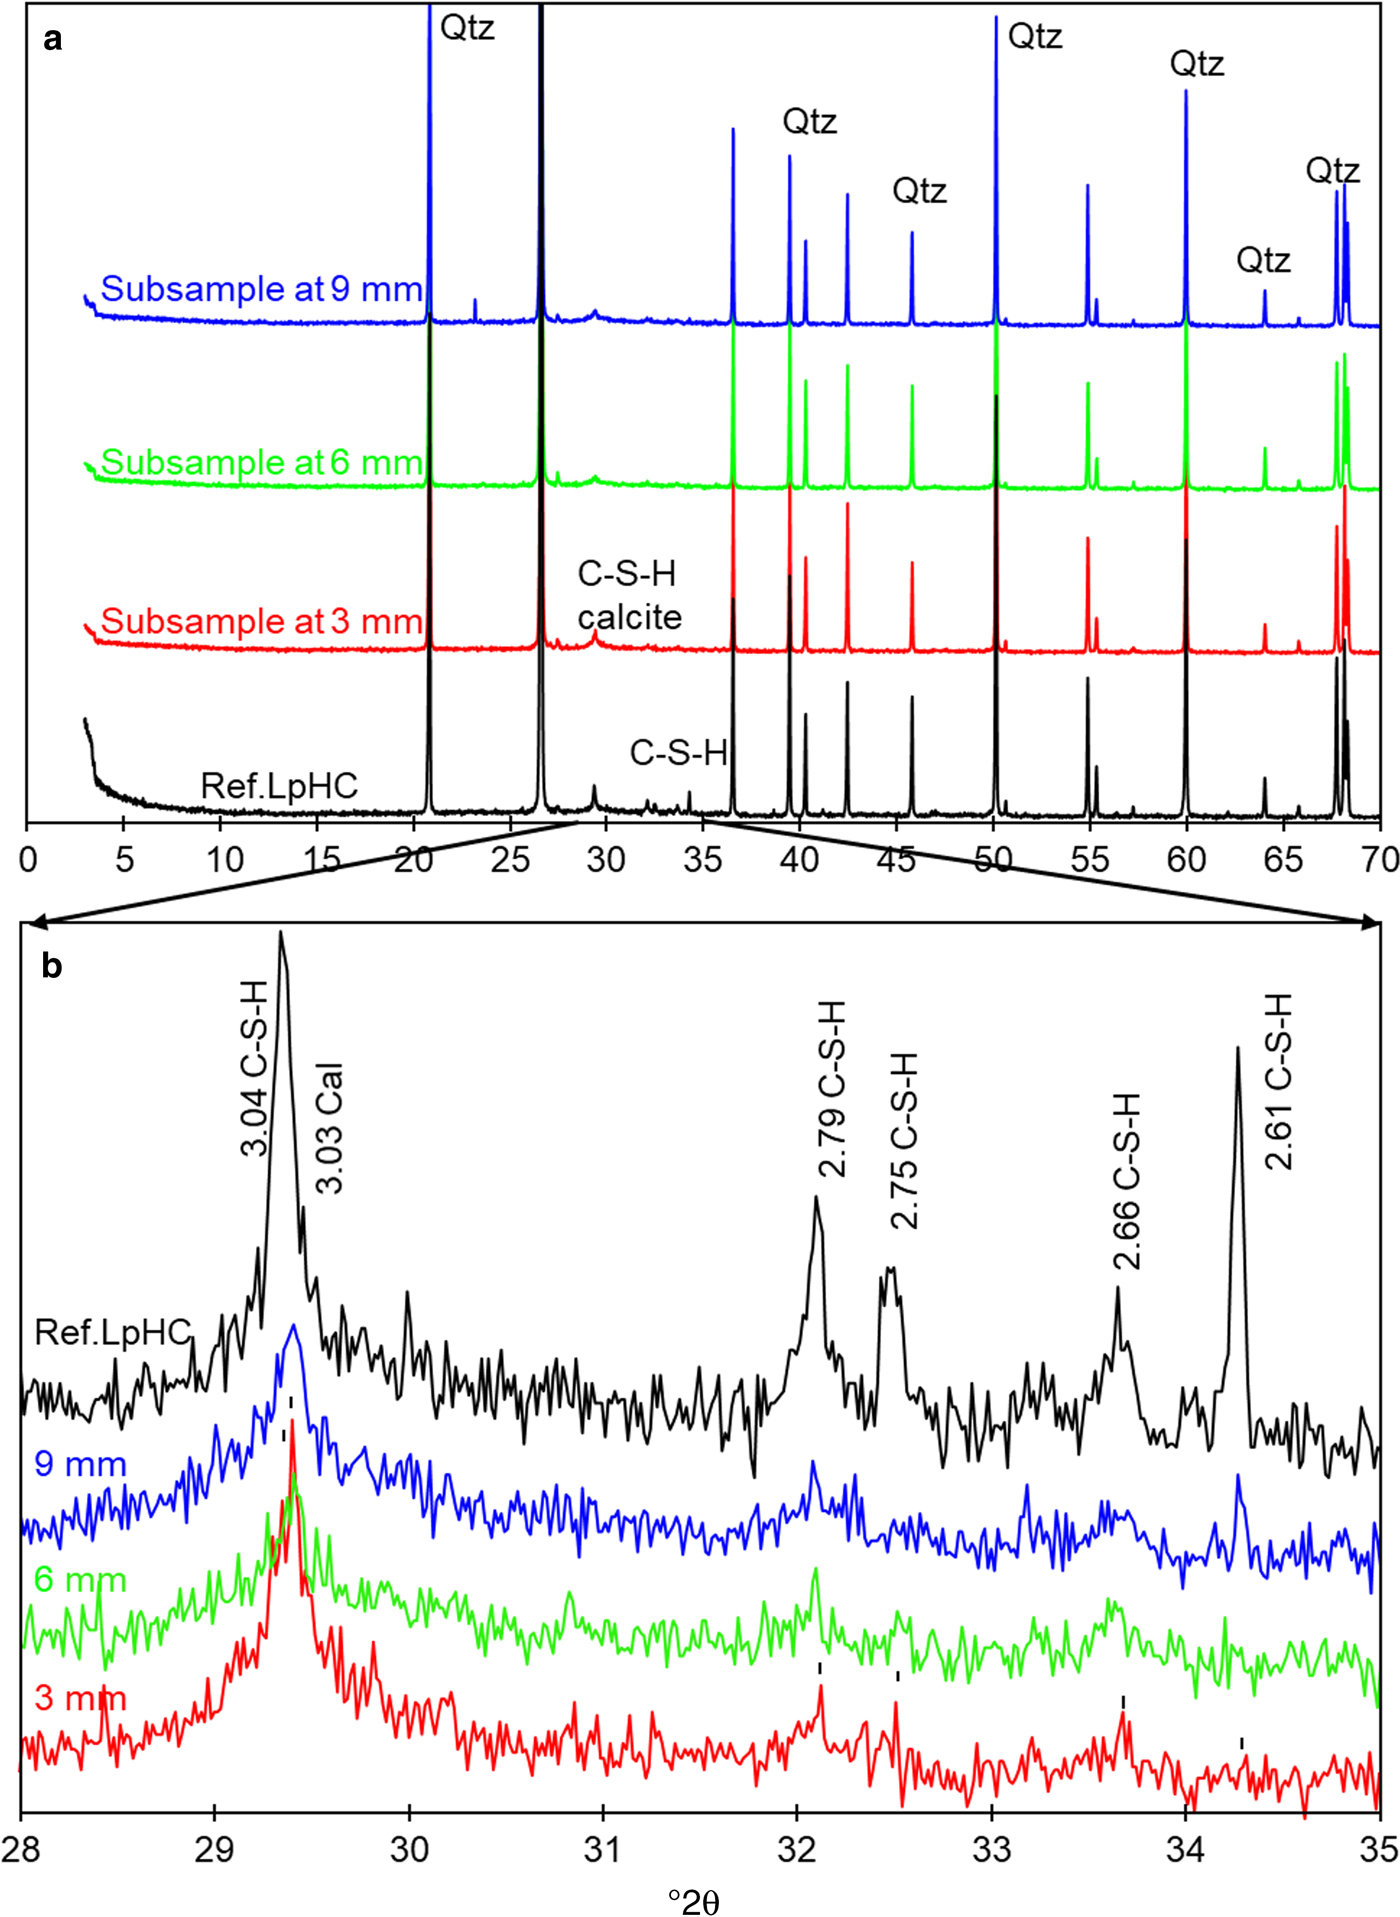
Fig. 9. (a) XRD of the reference low-pH cement mortar (Ref. LpHC) sample and reacted subsamples at 9, 6 and 3 mm from the C–B interface. (b) Magnification of the XRD trace in the range 28–35°2θ. Qtz: quartz, C-S-H: calcium silicate hydrates, and Cal: calcite. d spacings are given in Å.
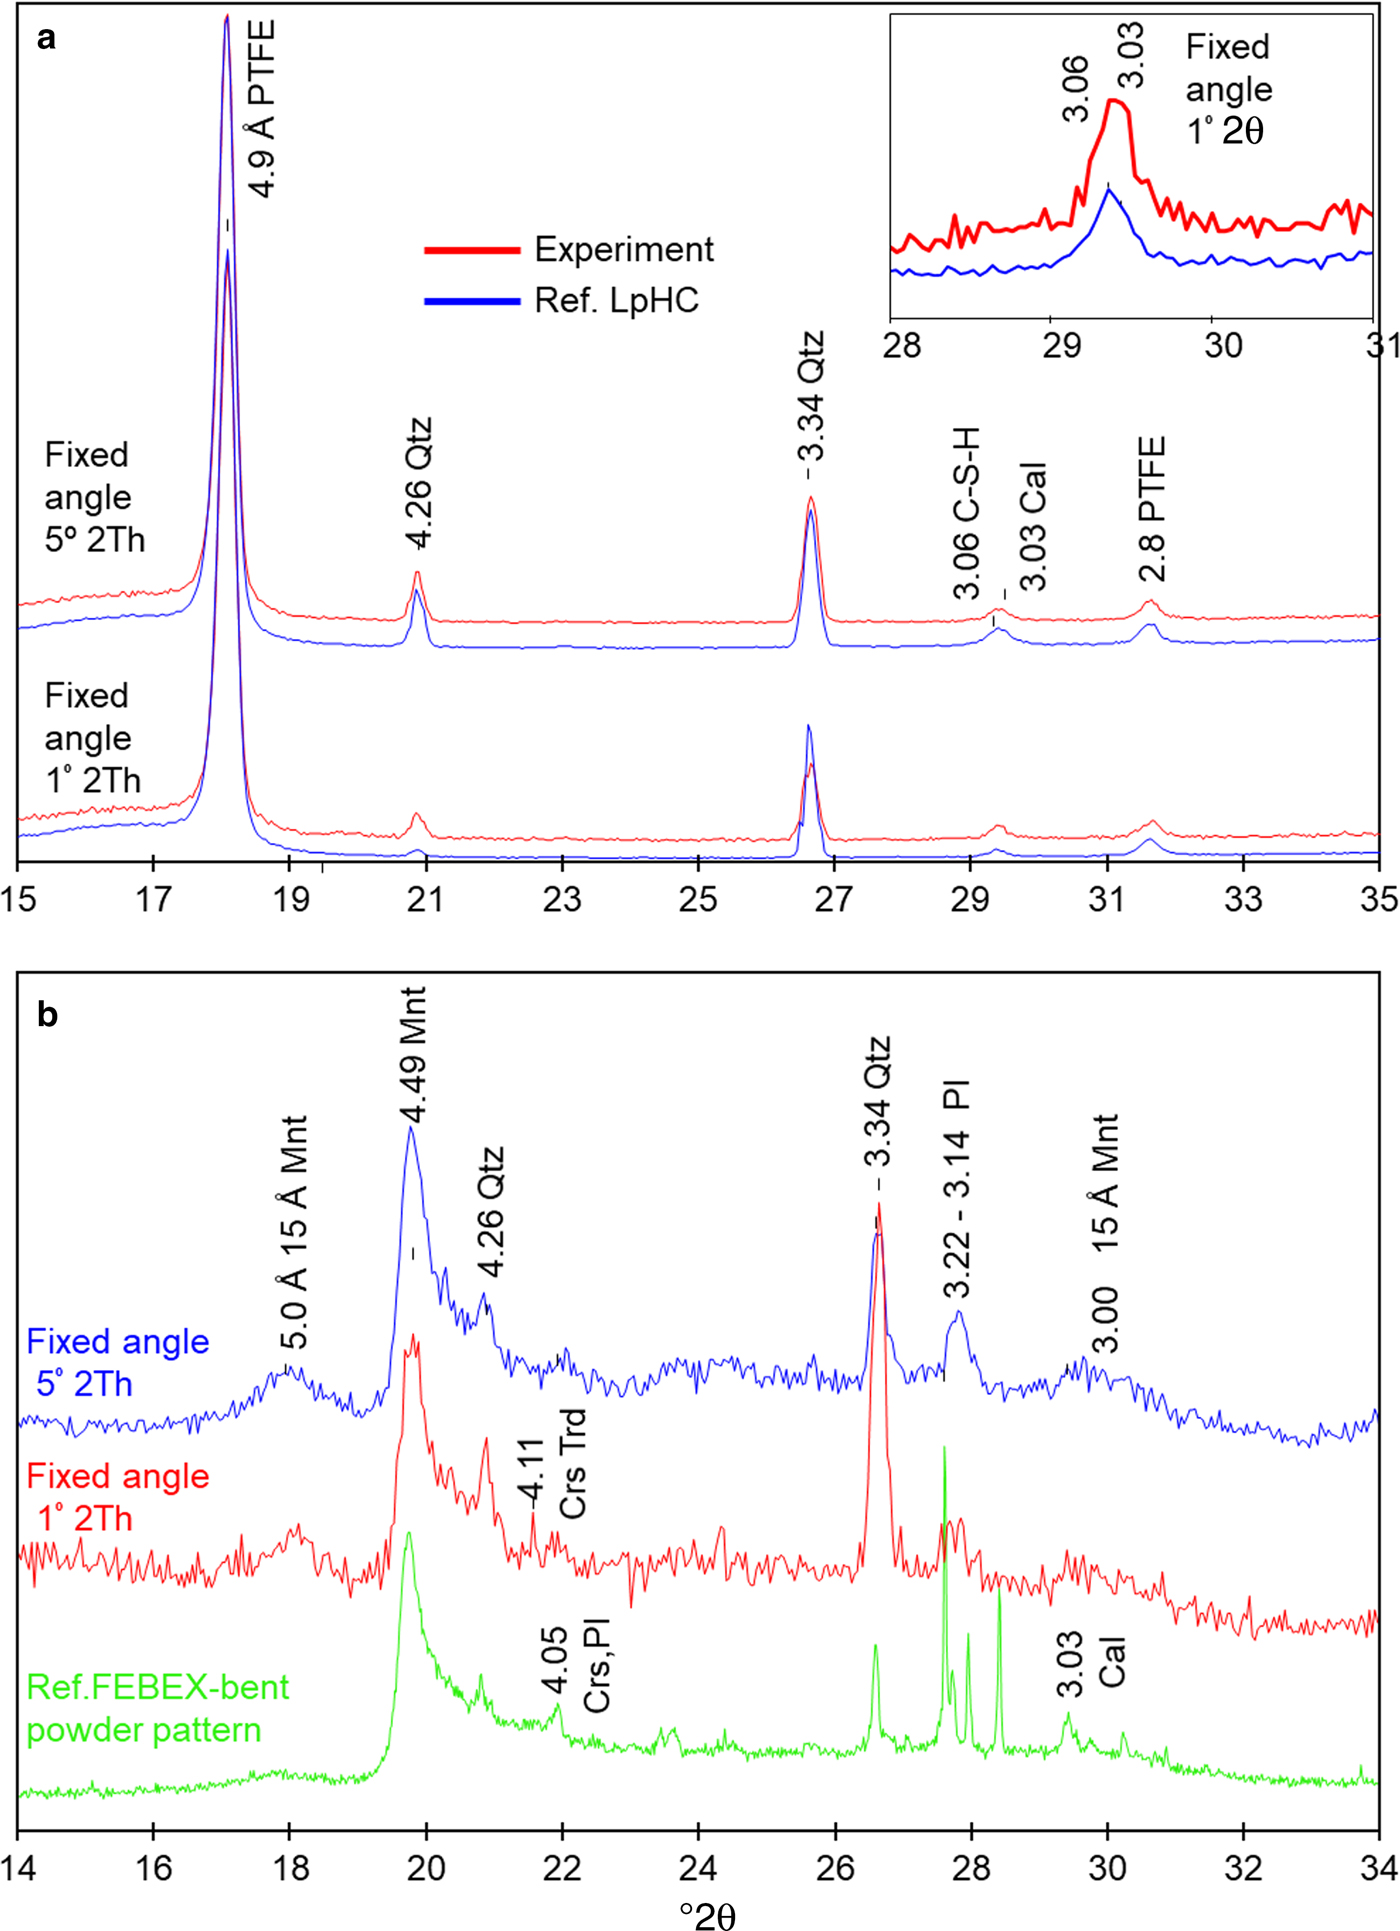
Fig. 10. (a) GI-XRD pattern recorded for the reference low-pH cement mortar (Ref. LpHC) and the surface of the sample exposed to bentonite after the experiment. (b) Conventional random powder XRD pattern recorded for the reference FEBEX-bentonite and GI-XRD for the surface of the sample exposed to low-pH cement mortar after the experiment. PTFE: polytetrafluoroethylene, Mnt: montmorillonite, Qtz: quartz, Crs: cristobalite; Crs-Trd: cristobalite-tridymite; Pl: plagioclase, and Cal: calcite. d spacings are given in Å.
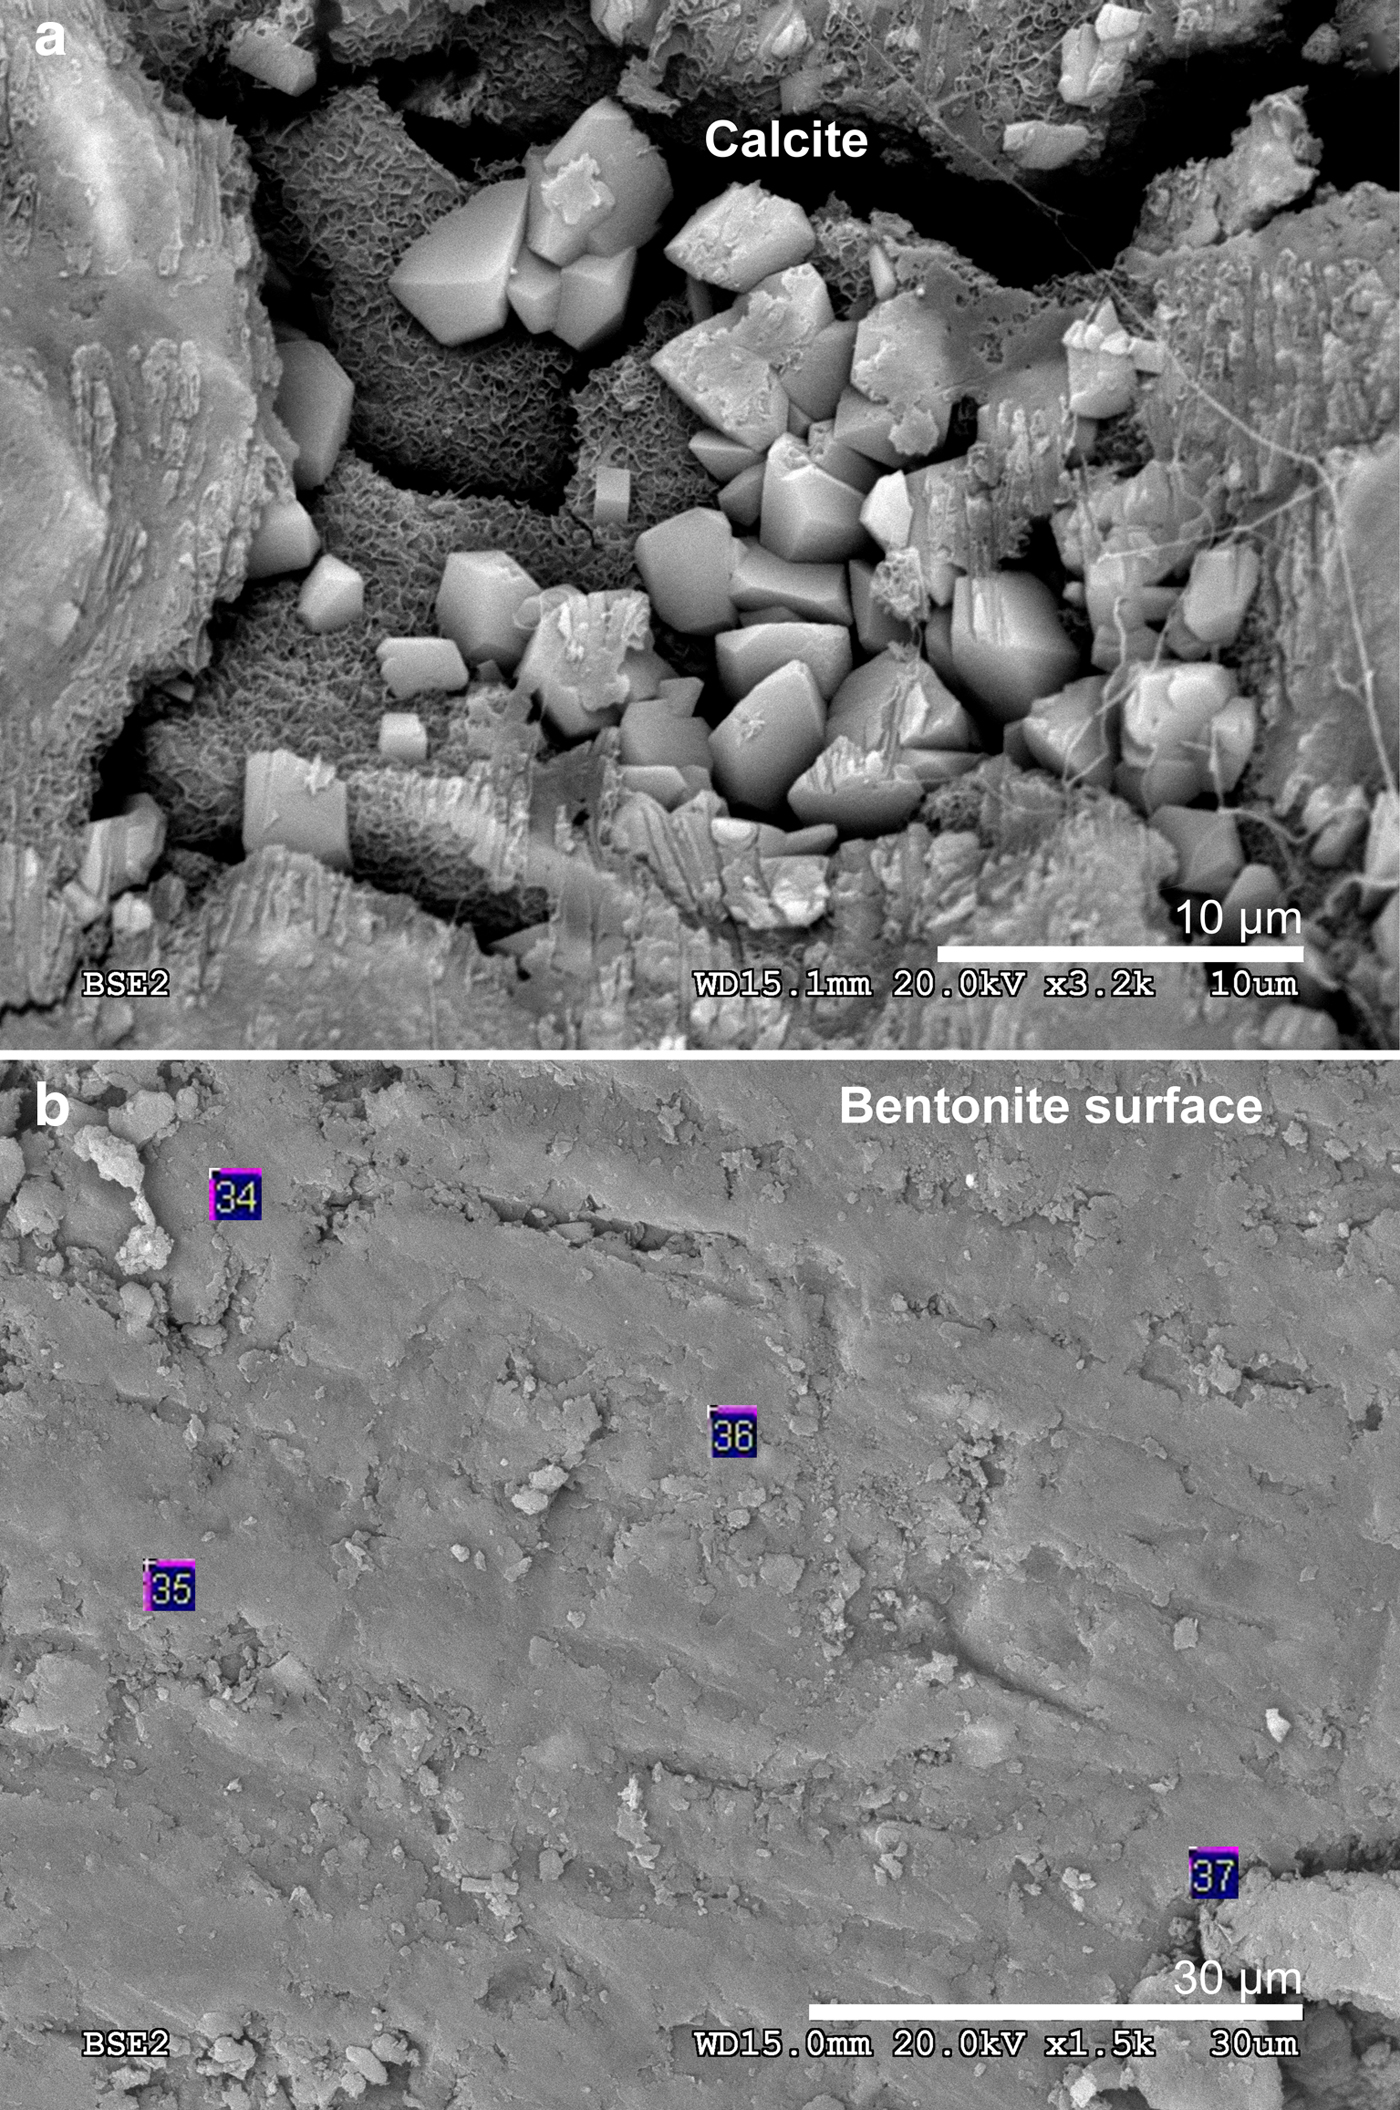
Fig. 11. (a) Backscattered electron (BSE) image of calcite present in the low-pH-cement mortar side near the interface with bentonite. (b) Backscattered electron image of the bentonite surface exposed to cement mortar. The numbers correspond to the EDX analysis points.
FEBEX-bentonite perturbations
The chemical perturbations observed in the FEBEX-bentonite were ~500–600 µm thick from the C–B interface (Fig. 6b). The EDX compositional profile indicates a Ca increase at 20 µm from the C–B interface, in agreement with a depletion of Al in the same region (Fig. 6c). The EDX analyses showed a Mg/Si ratio of 0.5 ± 0.1 (based on eight analyses) at the surface of bentonite (Fig. 11b) which was in contact with the low-pH cement mortar only, and of 0.2 ± 0.05 where the Mg/Si ratio was obtained from the first 13 analyses performed from the C–B interface on the EDX profile, representative of a thickness of 400 µm from the C–B interface. The enrichment in Mg near the cement mortar interface contrasts with the Mg/Si ratio of 0.10 ± 0.05 obtained from nine analyses far from the interface (in the range 600–8600 µm from the C–B interface) using the same approximation.
The mineralogical data obtained by XRD and GI-XRD (Figs 10b, 12) showed minimal changes in montmorillonite (Mnt) compared to those in the reference sample of FEBEX-bentonite. These changes are characterized by a weak decrease in the intensity of the Mnt basal reflection at 14.7 Å as the subsamples approach the C–B interface (Fig. 12). This effect was accompanied by an increase in the background towards higher angles using the Mnt basal reflection as the reference (from 7 to 17°2θ) in the subsample at 3 mm from the C–B interface.
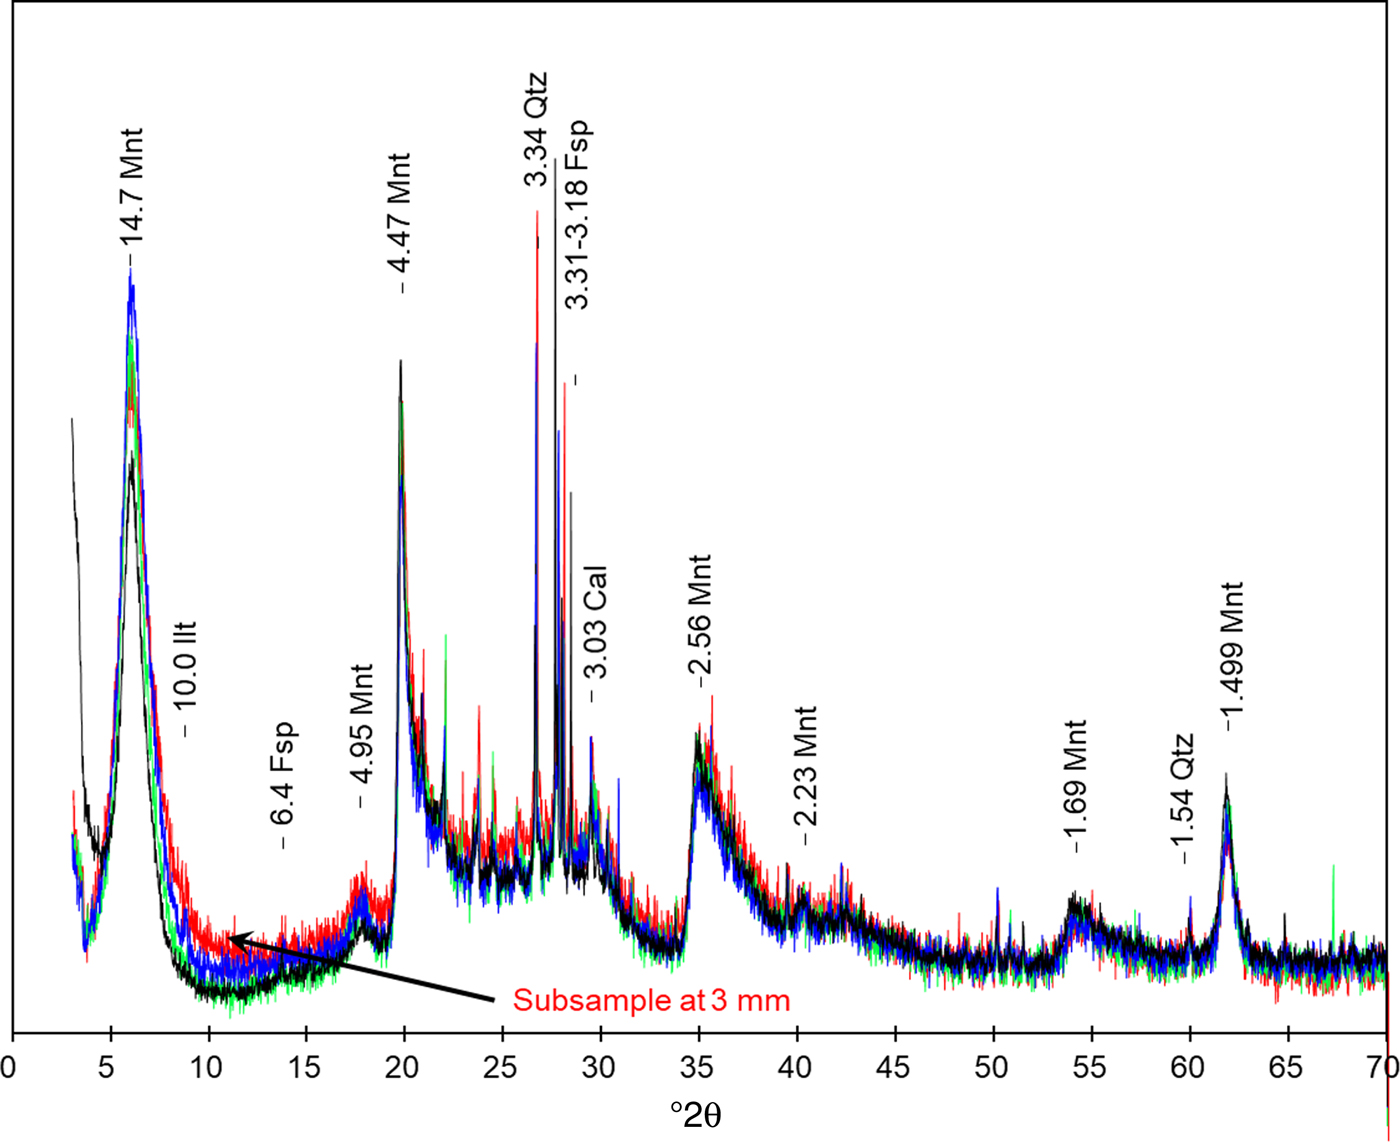
Fig. 12. FEBEX-bentonite XRD pattern. The reference FEBEX-bentonite is shown together with the overlapping subsamples at 9, 6 and 3 mm from the C–B interface. Mnt: montmorillonite, Ilt: illite, Qtz: quartz, Fsp: feldspar, Cal: calcite. d spacings are given in Å.
DISCUSSION
The FEBEX-bentonite buffer capacity is manifested by to the pH 8.3 obtained from the water collected (Table 3), very close to the porewater pH measured in the original bentonite and consistent with the exchange complex and bentonite mineral equilibria (Fernández et al., Reference Fernández, Baeyens, Bradbury and Rivas2004). Aqueous SiO2 showed concentrations within the solubility equilibrium of quartz and cristobalite (Williams et al., Reference Williams, Parks and Crerar1985), which are present in bentonite where the OH− provided by cement mortar was consumed at the C–B interface (Gaucher & Blanc, Reference Gaucher and Blanc2006; Savage et al., Reference Savage, Walker, Arthur, Rochelle, Oda and Takase2007). In addition to the buffer capacity, bentonite also controls the hydraulic conductivity. The hydraulic conductivity of FEBEX-bentonite at room temperature (23°C) and at a dry density of 1.6 g/cm3 has been reported previously to be on the order of 10–13 m/s (Villar, Reference Villar2000, Reference Villar2002; Villar & Lloret, Reference Villar and Lloret2004), in agreement with the value of hydraulic conductivity calculated in the present study (1.6×10⁻¹³ m/s). This might support the validity of the pilot experimental setup because the advective transport regime was very low and the diffusion was relevant (Muhammad, Reference Muhammad2004; Bourg & Tournassat, Reference Bourg, Tournassat, Tournassat, Steefel, Bourg and Bergaya2015), as expected in a real repository scenario. Three main chemical modifications have been observed around the reactive interfaces in the experiment: (1) decalcification of C-S-H at the C–W and C–B interfaces; (2) carbonation at the C–B interface (on the low-pH cement mortar side); and (3) Mg-perturbation in bentonite next to the C–B interface.
Decalcification of C-S-H
The Ca leaching process has been identified mainly at the C–W interface. The deterioration of low-pH cement-based materials starts with Na and K release followed by decalcification of the C-S-H. Although low-pH cement leaching has not been studied extensively, aqueous silica is expected to remain saturated with respect to quartz. Then, Ca leaching in such a solution might cause the formation of secondary C-S-H with a lower Ca/Si ratio than the initial C-S-H phases. Compared with the thickness of decalcification at the C–W interface (~3 mm) observed in the present experiment, an alteration thickness of 700 µm was reported in a low-pH concrete composed of Portland cement with additions of silica fume after 14 months and exposure to granitic groundwater flow (García Calvo et al., Reference García Calvo, Hidalgo, Alonso and Fernández2010).
At the C–B interface, the decalcification of C-S-H may have occurred according to the lower Ca/Si ratio of the spot EDX analyses from the cement matrix (0.8 ± 0.1) and the C-S-H (Ca/Si = 0.6) observed at the surface of the cement mortar in contact with bentonite only. These low Ca/Si ratios are close to the results provided by García Calvo (Reference García Calvo2012), and they are also consistent with the leaching experiments of Baston et al. (Reference Baston, Clacher, Heath, Hunter, Smith and Swanton2012) with low-pH concrete under similar experimental conditions. Possible evidence for C-S-H alteration of the low-pH cement mortar was determined by means of the XRD patterns (Fig. 9a–b). Moreover, the migration of Al from bentonite next to the C–B interface might lead to the formation of metastable C-A-S-H (Pegado et al., Reference Pegado, Labbez and Churakov2014); although C-A-S-H was not identified, this migration of Al to the low-pH cement mortar due to the exchange of soluble species (Fig. 6c), together with enough sulfate content, may favour the precipitation of ettringite, as suggested by the presence of needle morphologies in the EDX and SEM images from the point analyses. Low-pH concrete in contact with clayey rocks rich in sulfates was studied by the Cement–Opalinus Clay Interaction project (CI) experiment in Mont Terri, Switzerland (Dauzères et al., Reference Dauzères, Achiedo, Nied, Bernard, Alahrache and Lothenbach2016) where secondary ettringite precipitates at this interface, with this mineral being stable in the pH range of 11.0–12.5 (McCarthy et al., Reference McCarthy, Hassett and Bender1991), as determined in the low-pH cement mortar in the present study.
Carbonation at the C–B interface
A carbonation process (calcite precipitation) was suggested by the SEM images (e.g. Fig. 11a) and the XRD and GI-XRD analyses (Figs 9a–b and 10a) at the C–B interface. The dissolved CO2 species could be provided by the clayey pore solutions (Dauzères et al., Reference Dauzères, Le Bescop, Cau-Dit-Coumes, Brunet, Bourbon, Timonen, Voutilainen, Chomat and Sardini2014; Jenni et al., Reference Jenni, Mäder, Lerouge, Gaboreau and Schwyn2014) mainly as HCO3–, which is unstable in alkaline environments compared to CO32–. Then, these carbonates might react with the Ca ions available in the low-pH cement mortar pore solution to precipitate as CaCO3 at the cement–mortar interface. This is observed experimentally by the increase in Ca observed at the C–B interface (0–100 µm on the cement mortar side), and is complemented by the images of the above-mentioned calcite. Calcite precipitation at the interface has been observed by other authors, conducting similar experiments over much longer periods of time, to lead to a decrease in porosity (Cuevas et al., Reference Cuevas, Samper, Turrero, Wieczorek, Schäfers and Fahland2014).
Mg perturbation at the C–B interface
Mg is present as an exchangeable cation in FEBEX-bentonite so it can be displaced readily by Ca ions leached from the cement mortar porewater. In fact, the decrease in exchangeable Mg in the FEBEX-bentonite in contact with concrete has been probed in an in situ experiment at the Grimsel-test site (Switzerland) (Villar, Reference Villar, Fernández, Romero, Dueck, Cuevas, Plötze, Kaufhold, Dohrman, Iglesias, Sakaki, Zheng, Kawamoto and Kober2018). The pH > 11.0 porewater of the low-pH cement mortar is sufficient to form new mineral Mg-phases, such as brucite (pH 10.5) or Mg-silicate hydrates (M-S-H; e.g. Nied et al., Reference Nied, Enemark-Rasmussen, L'Hopital, Skibsted and Lothenbach2016). These Mg-rich phases were not detected by XRD in the present study because of the narrow thickness (<500 µm), in which a slight Mg enrichment was detected by EDX at the bentonite side of the C–B interface. Although not measured in the present study, a redistribution of the exchangeable cation population in bentonite is expected. Surface mobility may induce Mg to move from the exchange complex and precipitate in the alkaline medium. Mg perturbation at the bentonite–cement interface to a greater extent has been reported previously by other authors (e.g. Fernández et al., Reference Fernández, Mäder and Cuevas2010). However, those previous studies were performed over longer experimental times and under more alkaline conditions imposed by OPC (ordinary Portland cement) concrete. The presence of larger amounts of Mg may expand the number of phases to be considered from brucite to brucite-intercalated Mnt and serpentine-like phases (Fernández et al., Reference Fernández, Mäder, Rastrero, Vigil de la Villa Mencía and Cuevas2009, Reference Fernández, Vigil de la Villa, Ruiz, García and Cuevas2013).
CONCLUSIONS
In the present study, a novel and reliable method to perform small-scale laboratory experiments concerning concrete–bentonite reactivity in a granitic DGR was tested. Only minor reactivity was observed. However, the following chemical perturbations were detected in spite of the short experimental time: (1) cement mortar decalcification at the cement mortar-bentonite and cement mortar–water interfaces; (2) slight carbonation in the low-pH cement mortar next to the interface with bentonite; and (3) Mg enrichment in bentonite at the interface with the cement mortar. These results are spatially limited but consistent with those observed previously over the long term, either at the laboratory scale or in large underground facilities. This experimental design is being applied to interactions of bentonite with high-pH cement mortar over longer times and using real groundwater compositions. Additional analytical techniques will be required for an improved interpretation of the results, which should provide valuable information and contribute to knowledge of the interaction between geochemical barriers under different scenarios planned for DGR.
SUPPLEMENTARY MATERIAL
The supplementary material for this article can be found at https://doi.org/10.1180/clm.2018.16.
ACKNOWLEDGEMENTS
The research leading to these results has received funding from the European Union's Horizon 2020 Research and Training Programme of the EURATOM (H2020-NFRP-2014/2015) under grant agreement n° 662147 (CEBAMA). The authors area grateful for the expertise of Dr Enrique Rodríguez Cañas with the SEM-EDX equipment used in the Inter-Departmental Research Service (SIdI) of the Autonomous University of Madrid.


