


Introduction
Since Aristotle pondered the virtues of rule by one, few, and many, the question of political concentration has played a key role in debates about good governance. Many writers believe that only when power is diffused across many levels and many institutions are conditions optimal for constraining the abuse of power, achieving stability and credible commitment, ensuring property rights, and maximizing the utility of citizens with diverse values and interests (Tiebout, Reference Tiebout1956; Oates, Reference Oates1972; Buchanan, Reference Buchanan1995). Others view power dispersion more skeptically – as an invitation to special interest politics, weak government, and collective action dilemmas (Prud’homme, Reference Prud’homme1995; Gerring and Thacker, Reference Gerring and Thacker2008). According to a third perspective, the success of dispersion is contingent, that is, dependent on contextual factors and the type of decentralization being considered, or mixed, setting in motion offsetting virtues and vices with no straightforward implications for the overall quality of governance (Bardhan, Reference Bardhan2002; Enikolopov and Zhuravskaya, Reference Enikolopov and Zhuravskaya2007).
In this study, we focus on the prior question. Why is the exercise of political power highly concentrated in some polities and widely dispersed in others? At one extreme stands North Korea, where a small cadre micro-manages the personal lives of citizens with virtually no constraints. At another extreme lie polities like India, Switzerland, and the United States – along with confederations and international organizations such as the European Union, the United Nations, and the World Trade Organization – where decision-making power is diffused across many independent actors. What might account for the extraordinary variation we find in power concentration throughout the world today?
While the causes of democracy have received a great deal of attention from scholars, the sources of power concentration are less often studied. Extant work on the subject focuses mostly on the vertical dimension, that is, the balance of power between higher- and lower-level governments. Analyses are generally centered on democracies, the OECD, and the postwar era (e.g. Garrett and Rodden, Reference Garrett and Rodden2003; Arzaghi and Henderson, Reference Arzaghi and Henderson2005; Letelier, Reference Letelier2005; Wibbels, Reference Wibbels2005; Gibler, Reference Gibler2010; Hooghe et al., Reference Hooghe, Marks and Schakel2010; Hooghe and Marks, Reference Hooghe and Marks2013). Many studies are limited to a small set of countries, especially those that are highly decentralized or have recently centralized or decentralized (e.g. Manor, Reference Manor1999; Willis et al., Reference Willis, Garman and Haggard1999; Garman et al., Reference Garman, Haggard and Willis2001; Eaton, Reference Eaton2004; Eaton and Dickovick, Reference Eaton and Dickovick2004; Montero and Samuels, Reference Montero and Samuels2004; Falleti, Reference Falleti2005, Reference Falleti2010; O’Neill, Reference O’Neill2005; Wibbels, Reference Wibbels2005; Ziblatt, Reference Ziblatt2006; Dickovick, Reference Dickovick2011; Benz and Broschek, Reference Benz and Broschek2013; Grossman and Lewis, Reference Grossman and Lewis2014).
As a complement to these focused studies, we intend to broaden the theoretical and empirical purview. Our theory encompasses both the vertical and horizontal dimensions of power. It applies to all manner of polities – supra-national, national, and subnational – so long as each unit enjoys some degree of policy-making autonomy, so long as the community of individuals within that polity is beyond the number that could conveniently congregate in one location, and so long as the polity assumes a ‘state-like’ form (where a government with a fixed location exercises a monopoly of physical force over a defined territory).
With this set of scope-conditions, we argue that the degree of power concentration in a polity is affected by the number of people residing within that polity. The larger the population, the more likely that power will be diffused. Undergirding this relationship are two causal mechanisms: a search for greater efficiency and a quest to resolve problems of trust. Each of these mechanisms, we claim, exerts pressure on leaders and citizens of a large polity to diffuse power.
To test the relationship between size and power concentration we compile a cross-country data set that incorporates most sovereign countries and a panel format extending as far back as the data will allow (in some cases to the early 19th century). We also provide a more focused examination of a single country – the United States – which offers a range of levels and types of government and a rich array of data with which to measure the degree of power concentration across subnational units.
The paper begins with a presentation of the argument. We then turn to cross-national empirical work on the subject, followed by a set of empirical tests. A speculative conclusion explores possible extensions of the argument.
Theory
A theoretical maximum of power concentration is achieved when a single individual or ruling group makes all important policy decisions in a polity. A theoretical minimum is harder to define. Taking the existence of political elites as a given, we shall say that this ideal is achieved in a setting where power is widely dispersed, where numerous actors hold effective vetoes, and where rulers are compelled to abide by these limitations (e.g. by constitutional provisions that cannot easily be changed and are enforced by an active judiciary). Henceforth, near-synonyms such as centralization, concentration, and consolidation, and antonyms such as decentralization, de-concentration, diffusion, dispersion, and fragmentation, will be used interchangeably. All are understood to refer to the overall concentration/dispersion of power in a polity.
So defined, our topic intersects with, and to some extent subsumes, adjoining topics such as constitutional federalism (Riker, Reference Riker1964), regionalism and multilevel governance (Hooghe et al., Reference Hooghe, Marks and Schakel2010), local governance (Bardhan and Mookherjee, Reference Bardhan and Mookherjee2006), fiscal federalism (Oates, Reference Oates1972,Reference Oates), public administration (Dubois and Fattore, Reference Dubois and Fattore2009), separate powers (Vile, Reference Vile1998 [1967]), veto points (Tsebelis, Reference Tsebelis2002), devolution (O’Neill, Reference O’Neill2000), delegation (Mookherjee, Reference Mookherjee2006), direct and indirect rule (Gerring et al., Reference Gerring, Ziblatt, Van Gorp and Arevalo2011), consensus/majoritarian institutions (Lijphart, Reference Lijphart1999), and the size of states (Alesina and Spolaore, Reference Alesina and Spolaore2003). Each of these topics is in some respects unique, justifying the focused approach taken by extant work. Yet, there is also considerable semantic and empirical overlap across these concepts. Indeed, they are difficult to disentangle.
Consider the distinction between vertical concentration (e.g. between higher and lower levels of government) and horizontal concentration (i.e. between political bodies at a single level of government). While useful for many purposes this distinction is not entirely clear-cut, as the two dimensions of power tend to intermingle (Hueglin and Fenna, Reference Hueglin and Fenna2006). Let us consider a few examples. First, constitutional federalism is almost invariably combined with a second legislative chamber whose goal is to represent subnational polities (aka states, territories, or provinces), and whose representation is usually asymmetric with the lower house, generating a consequential division between the two chambers. Second, separate powers at the national level – between the executive and legislature – probably reinforce federalism, while federalism reinforces separate powers (Eaton, Reference Eaton2004: 20–22; Cameron and Falleti, Reference Falleti2005: 257). Third, both separate powers and federalism enhance the development of judicial review (Whittington, Reference Whittington2009), and judicial review may help to entrench separate powers and federalism (Johnston, Reference Johnston1969). More generally, it may be argued that divisions between branches at the national level enhance the power of subnational political forces, while powerful subnational forces enhance divisions at the national level. Vertical and horizontal fragmentation is mutually constitutive. From this perspective, and because of our quest for a unified theory, it seems appropriate to treat vertical and horizontal dimensions as manifestations of a single latent concept.
Although we strive for an encompassing definition of power concentration we do not intend to envelope the adjacent concept of regime-type. Democracy, we shall assume, may be achieved in highly concentrated polities (e.g. the United Kingdom, until quite recently) or highly de-concentrated systems (e.g. the United States). Likewise, undemocratic polities may be concentrated (e.g. the French and Spanish empires and contemporary North Korea) or de-concentrated (e.g. the British and Ottoman Empires and contemporary China). Of course, we recognize that the nature of a regime affects the degree to which power can be concentrated or de-concentrated at any given point in time. There are also important interactions between institutions that structure regimes and institutions that structure power concentration, complicating our ability to test arguments focused on the latter. These difficulties notwithstanding, regime-type serves as a background condition – not a constitutive element – of power concentration. We assume the causes of regime-type are not identical to the causes of concentration.
Causes
Extant research on our topic is focused mostly on the vertical dimension of power – especially constitutional federalism and fiscal federalism – and on proximal causes of centralization, for example, the dynamics of party competition, the interplay between national and subnational elites, and economic crisis (e.g. Crémer and Palfrey, Reference Crémer and Palfrey1999; Manor, Reference Manor1999; Eaton and Dickovick, Reference Eaton and Dickovick2004; Montero and Samuels, Reference Montero and Samuels2004; Falleti, Reference Falleti2005, Reference Falleti2010; O’Neill, Reference O’Neill2005; Wibbels, Reference Wibbels2006; Dickovick, Reference Dickovick2011; Benz and Broschek, Reference Benz and Broschek2013; Grossman and Lewis, Reference Grossman and Lewis2014).
While proximal factors are obviously important, we should not lose sight of less visible distal factors that may be operating beneath the surface. This includes technology (communications, transport, military), geography, economic development, urbanization, inequality, globalization, external threats (including outright war), colonial heritage, ethnocultural diversity, and regime-type (Veliz, Reference Veliz1980; Manor, Reference Manor1999; Garrett and Rodden, Reference Garrett and Rodden2003; Eaton and Dickovick, Reference Eaton and Dickovick2004; Arzaghi and Henderson, Reference Arzaghi and Henderson2005; Letelier, Reference Letelier2005; Wibbels, Reference Wibbels2005; Gibler, Reference Gibler2010; Hooghe et al., Reference Hooghe, Marks and Schakel2010; Dickovick, Reference Dickovick2011; Hooghe and Marks, Reference Hooghe and Marks2013). We suspect that most of these factors are limited in purview: they may affect some aspects of power concentration but not others. Some evidence will be offered for this conjecture, though it is not our goal to comprehensively assess all possible influences on this outcome.
Our goal is to home in on one distal cause that, we conjecture, is fairly universal, namely, the size of a polity, understood as the number of permanent residents within its boundaries. This provides the foundation for a general theory of power concentration.
By way of entrée, let us consider an example of nested polity types: (1) United Nations (global), (2) European Union (supra-national), (3) France (national), (4) Midi-Pyrenees (regional), (5) Haute-Garonne (departmental), (6) Toulouse Métropole (metropolitan), and (7) Toulouse (commune). Because these governing units are nested within each other, we can compare political organization across levels, holding constant some of the historical and cultural factors that might be expected to influence constitutional choices. A glance at our exemplars suggests that power at top levels is fairly diffuse, with numerous limitations on the exercise of executive power and most consequential decisions reserved for lower levels. Power at bottom levels is more concentrated, with fewer horizontal or vertical constraints.
Of course, polities at lower levels face constraints from above – France is constrained by the EU just as Toulouse (commune) is constrained by Toulouse Metropole. However, our theory pertains to the internal organization of polities, not external constraints. One must also appreciate that comparisons across levels of government are fraught with complications since each level carries a different constitutional mandate, and some of the institutional features of interest to us may derive from those differing mandates. That is why most of the analyses to follow in the empirical section of this study focus on comparisons across the same type of polity. Nonetheless, it is consistent with our theory that variations across different levels of government usually correspond to variations in power concentration. The highest-level polities tend to be the least centralized; the lowest-level polities are generally the most centralized.
A schematic illustration of the theorized relationship between size and concentration is provided in Figure 1. Here, we visualize three exemplars, where the size of each shape indicates the size of its total population and where each box is roughly the same size. The large polity has 39 population units, the mid-sized polity has 14, and the small polity only 1. One can imagine that each unit contains a certain number of people, for example, 10,000, 100,000, or one million.

Figure 1 Schematic rendering of polity size and concentration. Subdivisions within a polity, symbolized by squares, represent independent power centers. These may be organized vertically (e.g. varying levels of centralization) and/or horizontally (institutional fragmentation at a single level).
Vertical divisions within these polities are represented by tiers. The large polity has three tiers (e.g. national, regional, and local), the mid-sized polity has two, and the small polity has only one. Horizontal divisions within each tier are represented by boxes, which represent independent power centers – groups or organizations that influence (or perhaps even possess a veto over) policymaking at that level, for example, a branch or agency of government or a political party or interest group that holds a share of power within government. The large polity features many independent power centers – three at the top tier, 13 at the second tier, and 23 at the lowest tier. The mid-sized polity has a smaller number of independent power centers, and the small polity only one.
Size thus corresponds to power de-concentration, with the largest polity having the most dispersed political institutions and the smallest polity having the most concentrated institutions – indeed, no divisions at all, either vertical or horizontal. The modular quality of these diagrams corresponds to our theory, though it must be stressed that this is a highly stylized representation.
To explain the apparent connection between demography and institutions we identify two likely causal mechanisms – heterogeneity and trust. In sketching out these mechanisms, we consider the dynamic that obtains when the population of a polity grows while other conditions remain the same. In this setting, we surmise that leaders face pressure to place limits on the exercise of power, either by fragmenting power at the center (horizontal de-concentration) and/or devolving power from the center to periphery (vertical de-concentration). Sometimes, these institutional reforms are undertaken in an explicit and intentional fashion, for example, by statute or constitutional reform. At other times they occur slowly and unobtrusively.
Heterogeneity
Larger communities are more heterogeneous. Heterogeneity, of course, can mean many things. It might refer to cultural characteristics of a population, for example, their ethnic, religious, linguistic, or racial composition. It might refer to the characteristics of an economy, that is, diversification among sectors, products, occupations, and social classes. It might refer to ideological characteristics, that is, strongly held values and preferences. However, understood, larger communities are apt to contain greater variety than smaller, similarly situated communities, for example, communities in the same region and at the same level of socioeconomic development.
Granted, the distribution of features (cultural, economic, ideological, etc.) may not be different across small and large communities. If one is sampling from a population randomly, there is no reason to expect a larger sample to have a different distribution than a smaller sample. Indeed, distribution-based measures of heterogeneity such as the Herfindahl index of fractionalization do not reveal a robust relationship to country size. Our point is that the number of (non-miniscule) groups is greater in large communities than in small communities. There are more languages spoken in India than in the Maldives, for example. Since sizeable groups – but not miniscule groups – are likely to have political consequences, we regard this as an appropriate conceptualization of heterogeneity.
Because of their heterogeneity, large communities may be difficult to govern in a concentrated fashion – or, they will not be perceived as satisfactory, which amounts to much the same thing. Informational inputs are a lot more complicated and one-size-fits-all solutions are unlikely to be very satisfactory. To accommodate this diversity, power is likely to be de-concentrated. This serves as an efficient solution for leaders and citizens alike.
Horizontal de-concentration involves the development of different institutions to serve different functions or different constituencies – for example, native courts and colonial courts, as in the classic modality of indirect rule (Morris, Reference Morris1972; Lange, Reference Lange2009), or laws that apply differentially to citizens of diverse faiths (Waldron, Reference Waldron2002), and so forth. Vertical de-concentration is efficient if preferences are geographically organized and if externalities across regions are limited (Oates, Reference Oates1972; Alesina et al., Reference Alesina, Perotti and Spolaore1995: 754; Bolton and Roland, Reference Bolton and Roland1997; Besley and Coate, Reference Besley and Coate2003: 1057–1058; Hooghe and Marks, Reference Hooghe and Marks2013: 181). Here, too, size also makes a contribution, as a larger polity is more likely to have subnational regions that can successfully internalize costs and benefits (Oates, Reference Oates2005: 357; Hooghe and Marks, Reference Hooghe and Marks2013: 181). It is therefore easier to decentralize power without introducing negative externalities in a large polity than in a small polity.
Trust
Trust, in the words of one expert, ‘reflects evaluations of whether or not political authorities and institutions are performing in accordance with normative expectations held by the public … In brief, an expression of trust in government is a summary judgment that the system is responsive and will do what is right even in the absence of constant scrutiny’ (Listhaug, Reference Listhaug1995: 358). We regard expressions of trust as convergent with (and as an empirical matter, virtually indistinguishable from) expressions of confidence, support, and satisfaction. All of these concepts are thus grouped together as part of an omnibus concept of trust.
While efficiency is assessed according to material metrics of well-being, for example, income, health, education, infrastructure, and the like, trust engages a different dimension and calls forth somewhat different demands on government. Note that the problem of trust cannot be solved simply by adjusting policy outputs, and often runs contrary to considerations of efficiency. Trust engages questions of security and respect, that is, non-tangible goods. Trust is also forward-looking; it concerns actions that may (or may not) be taken in the future. When a group distrusts government, it means that they are anxious about what that government might do next. Concentrated bodies, by their very nature, are incapable of achieving credible commitment to policies that they might pursue in the future (North and Weingast, Reference North and Weingast1989). As such, the problem of trust augurs for institutional solutions, that is, constraints on the center that cannot be easily overcome, regardless of who happens to control the executive.
Research suggests that feelings toward government are affected by the purview of government. A government that rules over large masses of people is likely to be distrusted while a government that rules over a small, and presumably local, group of people likely to be deemed more trustworthy. Across municipalities with identical functions, larger jurisdictions garner lower trust than smaller jurisdictions (Denters, Reference Denters2002; Rahn and Rudolph, Reference Rahn and Rudolph2005; Denters et al., Reference Denters, Goldsmith, Ladner, Mourtizen and Rose2014: Part III). In a quasi-experimental study of mergers across local governments in Denmark, municipalities that were merged saw a decline in trust while those that were un-merged remained stable or declined only slightly (Hansen, Reference Hansen2013). Trust in large states seems to be considerably lower than in small states (Matsubayashi, Reference Matsubayashi2007; Turner, Reference Turner2011). Likewise, when we compare units at different levels, those which are smaller elicit higher levels of trust. Local institutions are more trusted than regional institutions, regional institutions are more trusted than national institutions, and national institutions are more trusted than supra-national institutions (Nielsen, Reference Nielsen1981; Berezina and Diez-Medrano, Reference Berezina and Diez-Medrano2008). In sum, a body that stands closer in proximity to the citizen is apt to be trusted more than one that stands afar, all other things being equal.
A polity need not be democratic in order for considerations of trust to come into play. Even when state elites are not inclined to implement citizen demands they must be cognizant of the costs of maintaining a form of political organization that is not perceived as legitimate. Illegitimacy may result in lax observance of the laws, tax avoidance, refusal of military service, and at the limit, secession – costs that even the most authoritarian ruler is obliged to reckon with.
By way of illustration, let us consider an oft-noted dynamic in the founding or reform of polities. Here, fissiparous groups may be granted a share of power, a guarantee of rights, or a constitutional settlement that assures their rights, as a condition of their agreement to join (or remain within) a larger polity (Riker, Reference Riker1964; Lijphart, Reference Lijphart1977). In this manner, vertical or horizontal de-concentration serves as a pre-condition for the birth or survival of a polity. Of course, changes to the structure of a polity are not always based on threats of dissolution. Many changes, especially those that do not involve constitutional features of a polity, occur in an incremental fashion and are scarcely perceptible except over long periods of time. This would include levels of revenue and expenditure and other more nuanced measures of relative power (see second section). Insofar as demography functions as a cause of anything at a macro-level it is often a subtle relationship, more apparent in spreadsheets than in newspaper headlines or history texts. Even so, the highly visible, macro-level negotiations noted above may be indicative of a pervasive political dynamic, one that affects power negotiations at every level.
Analyses
While the relationship of size to democracy is a storied topic (Dahl and Tufte, Reference Dahl and Tufte1973; Veenendaal, Reference Veenendaal2013), the relationship of size to political concentration is less often attended to. Five recent cross-national studies attempt to probe this relationship with non-negligible samples (Panizza, Reference Panizza1999; Garrett and Rodden, Reference Garrett and Rodden2003; Arzaghi and Henderson, Reference Arzaghi and Henderson2005; Treisman, Reference Treisman2006; Hooghe and Marks, Reference Hooghe and Marks2013). Among these studies, country samples vary from 39 to 66 (with an average of 52), temporal coverage varies from 3 to 57 years (with an average of about 7), and four outcomes are considered – government consumption, constitutional federalism, regional authority, and fiscal decentralization – as summarized in Table 1.
Table 1 Recent cross-national studies

Units of analysis=countries or country-years; Countries/period=refers to the largest sample in which population or land area is included as part of the analysis; Finding=size appears to serve as a cause of dispersed power in a cross-sectionally dominated analysis (+) or not (0).
All five studies test both population and territory as predictors of de-concentration. These measures are transformed by the natural logarithm in accordance with the established notion that their impact on various outcomes depreciates in a sub-linear fashion. Most analyses are cross-sectionally dominated, as the variables of interest tend to be sluggish and offer few opportunities for through-time analysis. (Where authors include both, we focus on the cross-sectional analysis.) Territory fares better as a predictor of de-concentration, achieving statistical significance and robustness (in various specification tests) in four out of six analyses, as shown in the final columns of Table 1. The population is vindicated in only two out of six analyses.
One must bear in mind that the chosen samples in these studies are relatively small and centered on the OECD, and thus un-representative of the universe of nation-states. Likewise, only four measures of de-concentration are tested, a rather meager representation of this vast and difficult-to-operationalize subject. Note that constitutional federalism can be defined and measured in many different ways; as a result, extant measures demonstrate little convergent validity (Blume and Voigt, Reference Blume and Voigt2011). Fiscal decentralization, as measured by the International Monetary Fund (IMF)’s Government Finance Statistics (GFS), leaves aside the question of autonomy (Are local revenue raisers able to set their own rates and spend money in ways they see fit?). Moreover, none of the studies reviewed in Table 1 address horizontal measures of concentration.
Outcomes
In situations where individual measures of a concept are problematic, it makes sense to draw on multiple measures. We regard this as a form of triangulation. If a relationship demonstrates persistence across many indicators, measurement error is less worrisome. Broadening the empirical field should also make the theory more falsifiable, as it has more chances to fail. Additionally, we may be able to provide clues to the probable scope of the theory. For all these reasons, a wide-angle approach seems worthwhile.
Our analysis encompasses all facets of power concentration, including both horizontal and vertical dimensions, so long as they can be measured reliably across a large number of countries (100+), representing all regions of the world. Where multiple indicators purport to measure the same concept, we choose that indicator in which we have the greatest confidence and/or which offers the most extensive coverage.
In this fashion, we arrive at a set of fifteen measures. Many are derived from the recently completed Varieties of Democracy project (‘V-Dem’; Coppedge et al., Reference Coppedge, Gerring, Lindberg, Teorell, Altman, Bernhard, Fish, Glynn, Hicken, Knutsen, McMann, Pemstein, Reif, Skaaning, Staton, Tzelgov, Wang and Zimmerman2015). Others are constructed from the Database of Political Institutions (‘DPI’; Beck et al., Reference Beck, Clarke, Groff, Keefer and Walsh2001), the Political Constraints index (‘PolCon’; Henisz, Reference Henisz2002), ‘GFS’ (IMF), World Development Indicators (‘WDI’; World Bank, 2005, 2007, 2012, 2016), and Centripetalism (Gerring and Thacker, Reference Gerring and Thacker2008). Readers are referred to these sources for in-depth discussion of coding procedures and sources. One variable is constructed from the original data collection by the authors, as described below.
The first set of indicators focuses primarily on vertical concentration (i.e. centralization). Federalism is understood as an institutionalized division or sharing of responsibilities between national authority and semiautonomous regional units, usually codified in a constitution. Following Gerring and Thacker (Reference Gerring and Thacker2008: 88), polities are coded 0 if they are non-federal (regional governments, if they exist, are granted minimal policy-making power), 1 if they are semifederal (there are elective governments at the regional level, but constitutional sovereignty is reserved to the national government), or 2 if they are fully federal (elective regional governments plus constitutional recognition of subnational authority). Subnational government layers are comprised of two variables measuring whether (a) local or (b) regional governments exist, as coded by research assistants and regional experts enlisted by V-Dem. These are added together to form a three-level index: 0=none, 1=one level, or 3=both levels. Subnational elections measure the existence or non-existence of elections at subnational levels, as coded by country experts enlisted by the V-Dem project. Autonomous regions measure the existence/non-existence of regions enjoying substantial autonomy from the national government, as coded by the DPI. Revenue decentralization is subnational revenue considered as a share of total public revenue, based on the GFS and compiled by Enikolopov and Zhuravskaya (Reference Enikolopov and Zhuravskaya2007). Government consumption includes all (central) government current expenditures for purchases of goods and services, including payment of employees and most expenditures on national defense and security (but not those considered part of government capital formation), considered as a share of GDP, as compiled by the WDI.
The second set of indicators focuses primarily on horizontal concentration at national levels. Separate powers are coded as 1 if the dominant executive (either the head of state or head of government) is directly elected, 0 otherwise, based on coding by research assistants enlisted by the V-Dem project. Divided party control measures the extent to which a single party or coalition controls both the executive and legislative branches of national government, based on coding by country experts enlisted by the V-Dem project. Decentralized parties measures how decentralized the process of candidate selection for the national legislature is – specifically, the extent to which national party leaders control the process or share power with constituents and local and regional party actors, as judged by country experts enlisted by the V-Dem project. The judicial review attempts to judge whether any court in the judiciary has the legal authority to invalidate governmental policies (e.g. statutes, regulations, decrees, administrative actions) on the grounds that they violate a constitutional provision, as coded by country experts enlisted for the V-Dem project. Bicameralism measures the existence of two chambers in the national legislature and – if they exist – how closely matched their powers are, based on the coding of country experts enlisted by the V-Dem project. (If one chamber overshadows the other we regard this as an example of weak bicameralism.) Legislative fractionalization measures the probability that two randomly drawn representatives from the lower (or unicameral) chamber of the legislature will be from different parties, as measured by the PolCon data set. Political constraints refers to ‘the extent to which a change in the preferences of any one actor may lead to a change in government policy’ (Henisz, Reference Henisz2002: 363), taking into account the number of independent branches of government and the preferences of each of these branches, as measured by the PolCon data set. Checks and balances refers to ‘the number of veto players in a political system, adjusting for whether these veto players are independent of each other, as determined by the level of electoral competitiveness in a system, their respective party affiliations, and the electoral rules’ (Beck et al., Reference Beck, Clarke, Groff, Keefer and Walsh2001), as measured by the DPI and transformed by the natural logarithm.
A final indicator, the Capital city, encompasses both vertical and horizontal dimensions of power concentration. Here, we measure the population of the capital city in a polity as a share of that polity’s total population, transformed by the natural logarithm (Authors). This is regarded as a summary measure of concentration, following the assumption that in polities where power is concentrated both material resources and human resources will be concentrated at the center. Note that most of the tests that follow include a covariate measuring overall urbanization, so as not to confuse the status of the capital city with demographic conditions obtaining in the country at large.
This set of 15 indicators of concentration offers a broad – but certainly not comprehensive – a survey of the topic. Note that virtually any feature of government may be viewed as indicative of power concentration; as such, our topic is unbounded. One might, for example, examine particular policy areas to gauge which actors are actively engaged in policymaking and, accordingly, how concentrated that policy-area is. Sophisticated efforts of this nature (e.g. Hooghe and Marks, Reference Hooghe and Marks2009) are limited in coverage and thus not relevant for present purposes. Nonetheless, there is no reason in principle why finely honed indicators could not be expanded to include a broader sample of countries.
Summary features of the chosen outcomes are listed in Table 2. In addition to sources, we indicate coverage – the number of countries, years, and observations – for each measure of concentration. We also show descriptive statistics – mean, standard deviation, and the scale of the index. Note that chosen indicators include a mix of continuous, left-censored, ordinal, and binary scales. All are re-scaled to 0–1 (maintaining the original scales, which are ordinal or interval, and in one case binary) so that results can be easily compared.
Table 2 Outcome measures and estimation strategies

All variables re-scaled from 0 to 1.
H=hypothesized relationship to polity size; V-Dem=Varieties of Democracy project; O. logit=ordered logit; OLS=ordinary least squares; RE=random effects; DPI=Database of Political Institutions; GFS=Government Finance Statistics; WDI=World Development Indicators; PolCon=Political Constraints index.
In the final columns of Table 2 we preview an extensive set of empirical tests. Following the distributions suggested by each scale, we adopt a variety of estimators in pooled regression tests. Nine of the chosen outcomes are suitable for panel analysis, which is to say there are a sufficiently long time-series with significant variation over time in the outcome of interest. These outcomes are analyzed with a random effects estimator and a lagged dependent variable. Finally, we note the anticipated relationship of polity size to the chosen indicator. Measures of concentration (Government consumption and Capital city) are expected to be negatively correlated with polity size, while measures of dispersion (all others) are expected to be positively correlated.
Initial tests
In the Online Appendix B, each outcome is analyzed separately in a battery of regression tests. This is the preferred format for testing multiple outcomes that are not highly correlated (see Table A3), and hence likely represent different dimensions of power concentration.
Since it is not possible to present all of these analyses here, we focus instead on a composite index. We begin by imputing missing data using the Amelia multiple-imputation algorithm (Honaker and King, Reference Honaker and King2010). This is essential to overcome the widely varying coverage of our indicators. Next, we conduct a principal component analysis (of all 15 indicators) on each of the 20 imputed data sets (see Table A4). Finally, we average the first component from each analysis to form a Power concentration index.
Country scores on this index are shown in Table A5. Across the course of the 20th century, the United States and Switzerland appear as the least concentrated polities, and North Korea and Angola as the most concentrated polities. This may be regarded as evidence of face validity, as it confirms common impressions of the world.
In Table 3, we summarize a broad array of tests focused on the population as a predictor of power concentration, using the Power concentration index as the dependent variable. Units of analysis are country-years with right-side variables measured at t−1, unless otherwise noted.
Table 3 Cross-country tests of power concentration

FE=fixed effects; OLS=ordinary least squares; OPEC = organization of the petroleum exporting countries; RE=random effects; GDPpc=GDP per capita;
Power concentration index is the dependent variable (DV). Right-side variables measured at t−1 except in Model 4, where they are measured at t−50 and Models 5–6, where population is measured in 1900. Standard errors clustered by country except in Model 6 where they are robust. Socialist legal origin is the reference group for legal origin.
*P<0.10; **P<0.05; ***P<0.01.
Model 1 is a bivariate analysis in which our measure of concentration is regressed against population (logged). While this minimal specification may seem implausible, it has the virtue of dispensing with any possible post-treatment confounding – an important consideration in situations where many covariates are likely to be influenced by the causal factor of interest. The estimated coefficient for the population is correctly signed and statistically significant (P<0.01) in this simple model.
Model 2 tests a basic specification including per capita GDP (logged), Urbanization, Legal origin (dummies for English, French, German, Scandinavian, Socialist), Latitude (distance from equator, logged), Muslim (share of population), Protestant (share of population), Organization of the Petroleum Exporting Countries (OPEC) (dummy), Region (dummies for Eastern Europe & Central Asia, Latin America, Middle East & North Africa, sub-Saharan Africa, Western Europe and North America, East Asia, Southeast Asia, Pacific, Caribbean), and Year (dummies for each year in the panel). We shall regard this as our benchmark model since all of these factors have been identified as possible causes of power concentration and all are plausibly exogenous.
Model 3 builds on the benchmark model with the addition of four covariates often regarded as causes of (de)concentration: democracy, measured by the Lexical index of electoral democracy (Skaaning et al., Reference Skaaning, Gerring and Bartusevičius2015), ethnolinguistic fractionalization (the probability of two randomly chosen individuals belonging to the same ethnolinguistic group), and both internal and external armed conflict.
Model 4 returns to the benchmark specification, this time lagging right-side variables 50 years (rather than a single year). To the extent that relationships persist, this reduces concerns about X:Y endogeneity and common-cause confounders.
Model 5 takes this approach further, measuring population in 1900 while other right-side variables are measured at t−1. Samples are therefore limited to the 20th and 21st centuries. Since the population is fixed at one point in time, it cannot be affected by developments occurring later in the century, which might otherwise serve as confounders.
Model 6 continues to measure population in 1900 while measuring all other variables in 2000. This purely cross-sectional analysis has the benefit of weighting all countries equally and – arguably – measuring outcomes at a point when they have moved closer to equilibrium. It also allows us to test the possibility of a very long-memoried causal relationship between demography and political structure.
Model 7 deals with potential bias arising from missing data by imputing full data sets, again utilizing the Amelia multiple-imputation algorithm. With an imputation model that takes into account the time-series cross-sectional nature of the data, we impute missing data for all variables beginning with the first year of observed data for each measure of power concentration. We then run each model on 20 imputed data sets. The coefficient estimates are quite close to the benchmark model, suggesting that our sample is not systematically biased.
Model 8 restricts the analysis to country-years in which multiparty elections are on course, as measured by the Lexical index of electoral democracy, where Lexical>2. This is a fairly low threshold, indicating the existence – but not the quality or competitiveness – of multi-party elections for the legislature and executive. It is an important probe, nonetheless, as institutions may operate differently in democratic and autocratic contexts. Again, the estimated coefficients are comparable to coefficients estimated for our benchmark model. Viewed alongside results for Model 3 (where Lexical serves as a covariate), this suggests that relationships between population and various measures of concentration are not dependent on regime-type, or only marginally so.
Model 9 departs from our pooled regression approach by adopting a panel format. Here, we adopt a random effects estimator and add a lagged dependent variable to the benchmark specification. (Note that coefficients in a lagged dependent variable model measure the short-term effect of a change in population, and are therefore not directly comparable to coefficients estimated in other models.)
Instrumental-variable test
Model 10 provides an instrumental-variable analysis in which two factors are utilized as instruments: territory and arable land. The territorial expanse is measured by the land area of a polity (square kilometers), transformed by the natural logarithm. Arable land (as a share of the total land area) is measured in 1960, the first year for which broad coverage is available from the Food and Agriculture Organization (collated by the WDI). While it might be preferable to measure this factor in 1900, this statistic is extremely sluggish over the observable period (1960–2010), and we expect it to be equally sluggish in the previous historical period.
Encouragingly, territory and arable land together explain 75% of the variation in the population (logged). However, to serve as viable instruments we must also assume that whatever effect territory and arable land have on power concentration operates through the population and not through other channels, conditional on observed covariates. We must also assume that there is no reciprocal causation (from Y to X), and that there is no interference across units. Several potential problems deserve discussion.
First, we consider the possibility that territory affects power concentration directly, rather than indirectly. This is explored in a set of analyses presented in the Online Appendix D, where we show that population generally outperforms territory as a predictor of power concentration. Empirically, territory behaves more like an indirect cause than a direct cause – though this of course does not rule out the possibility that in some instances, or to some degree, it may function as a direct cause.
Second, one might be concerned that arable land influences modernization, which in turn may affect political structures. However, our model conditions on per capita GDP and urbanization, so this potential source of bias is presumably blocked.
Third, it is possible that political structures affect the territory of a country, with highly concentrated states preferring larger countries (Alesina and Spolaore, Reference Alesina and Spolaore2003: 69). There is no easy solution to this selection effect. However, to the extent that it affects the data-generating process it introduces a conservative bias into the analysis, making it harder to reject the null. Accordingly, estimates from this instrumental-variable analysis may be regarded as establishing a lower bound for the true (unbiased) causal relationship.
Fourth, many studies have noted that country boundaries are affected by international-system factors such as economies of scale, burdens of heterogeneity, the necessity of self-defense, the prominence of international trade, technological developments affecting transport, communications, warfare, and administration, and threats to sovereignty (Alesina and Spolaore, Reference Alesina and Spolaore2003). However, because these factors affect all countries equally they lie orthogonal to our cross-country analysis. To the extent that international-system factors change over time their influence should be captured by annual dummies in our models.
A confusing element of our analysis is that the boundaries of countries are mutually constituted. A change in one country’s borders (in the modern era) affects another country’s borders, and hence its population. This violates a strict interpretation of the stable unit treatment value assumption. However, as noted, border changes are modest over the period under observation. Most polities in our data set retain similar boundaries from the time of independence to the present-day. Limiting the analysis to the post-1960 period or to countries that have retained stable borders in that period (or since independence) has little impact on the results reported in this analysis.
For these reasons, we regard the instrumental-variable analysis shown in Model 10 of Table 3 as a highly plausible identification strategy. However, because this analysis depends upon assumptions that cannot be proven, and are certainly open to question, we regard Model 10 as a robustness test, not a primary identification strategy.
Discussion
Any single analysis using observational data at the country-level is open to skepticism. That is why we have enlisted a large number of empirical tests that incorporate multiple measures of power concentration, multiple specifications, and multiple estimators, including cross-sectional, panel estimators, and instrumental-variable estimators, as shown in Table 3 and tables contained in the Online Appendix B. Reassuringly, estimated coefficients for the key variable of theoretical interest are fairly stable across these tests. (As noted, Model 9 is a dynamic model and hence not comparable to the results of pooled regressions shown elsewhere in Table 2.)
Granted, each of these 15 outcomes could have been modeled differently in tests shown in the Online Appendix B, and we might have endeavored to provide a unique specification for each outcome. However, introducing novel features to each analysis would enhance the possibility of ‘just-so’ specifications, cherry-picked to prove our hypothesis. By adopting a common framework, we limit options for selecting covariates and estimators that support our favored thesis. In the event, the addition (or subtraction) of covariates, or of new estimators, is unlikely to change the overall pattern of findings, which seem consistent across a wide variety of settings. The balance of the evidence suggests that the population of a country impacts constitutional arrangements such that power is more dispersed when a polity is more populous.
By contrast, none of the other structural factors tested in our models – including per capita GDP, urbanization, legal origin, latitude, Muslim, Protestant, OPEC, democracy, ethnic fractionalization, or region – is consistently related to concentration, as shown in Table 3 and Tables B1–B19. The population appears to be the only generalizable (distal) cause.
To gauge the extent of this effect we construct a graph showing predicted values of the index at different population levels based on our benchmark model (Model 2, Table 3). Predicted values, shown in Figure 2, are bracketed by 95% confidence intervals, suggesting the variability of these estimates. Estimates are more precise near the left and center of the population distribution, as is to be expected – given that this is where most of the data are concentrated (there are many more small- and medium-sized countries than large countries). Following our logarithmic scale, the impact of a given shift in population is much greater at lower population levels than at higher population levels. As the population of a hypothetical country increases from one to ten million, our model anticipates a decrease in power concentration equivalent to about one half of a standard deviation on that index.
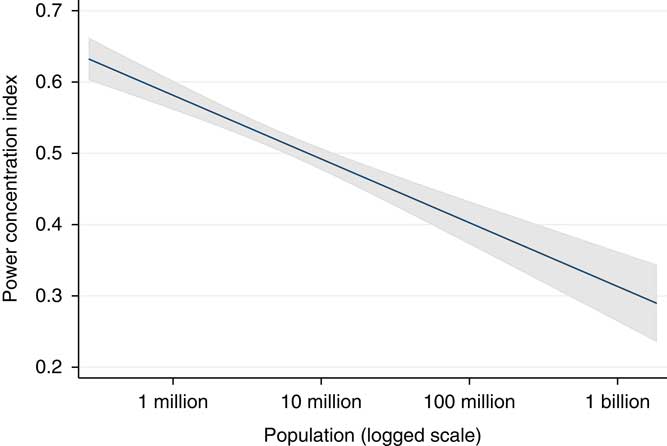
Figure 2 Predicted values. Predicted values for the power concentration index as population (logged) increases while holding other variables at their means, based on estimates from Model 2, Table 3, and surrounded by 95% confidence intervals. Power concentration index: min=0; max=1; mean=0.561; std. dev.=0.202.
In the Online Appendix C, we explore these relationships at subnational levels within the United States. Note that assumptions required for causal inference are generally less problematic when comparing regions or localities within a single national state. Of course, institutional forms do not vary as much within countries as across countries, limiting our choice of outcome measures. Nonetheless, there is substantial variation in the degree to which power is concentrated within states, counties, and cities across the United States, and such variation as exists is less subject to confounding. In analyses reported in Table C3, we explore institutional variation at state, county, and city levels. All of these analyses support our contention that size is inversely related to power concentration.
Tradeoffs
We have argued that the size of a polity in the modern era affects its institutional form, with larger (more populous) polities developing less concentrated systems of rule. We have presented evidence for this pattern across nation-states and across subnational units (states, counties, and cities), using a wide variety of outcome measures focused on the vertical and horizontal dimensions of power concentration. The reasons for this persistent relationship, we theorized, rest on considerations of social heterogeneity and political trust.
If our argument is correct, there is an important tradeoff between extensive and intensive rules. Increasing the size of a polity decreases its probable concentration of power, while decreasing its size increases its probable concentration. It follows that polities may be organized to rule intensively (in a concentrated fashion) over a small populace or extensively (in a de-concentrated fashion) over a large populace.
This tradeoff faced the New England colonists in the 18th century just as it faces the current members, and prospective members, of the European Union today. Our theory suggests that had the 13 colonies evolved into independent states, rather than joining together in a confederation, they would have developed fairly concentrated systems of rule. Our theory also suggests that the larger the EU becomes the more fissiparous its governance structure is likely to become, and the more it is likely to emulate the previous condition of Europe as a region of (formally) independent states.
The intensive/extensive tradeoff has important implications for problems of coordination, and hence for governance. Briefly, where states are small (and unified), problems of coordination arise between states. Where states are large (and fragmented), problems of coordination arise within states while coordination problems between states are mitigated by their smaller numbers.
The intensive/extensive tradeoff also has important implications for democratic theory. When one considers opportunities for participation, the achievement of accountability, and other democratic virtues, the position of a citizen in a small polity with concentrated institutions may be roughly equivalent to the position of a citizen in a large polity with dispersed institutions. Citizens may be loosely governed by a larger, more fragmented polity in which considerable power is delegated to local officials. Or they may be tightly governed by a smaller, more centralized polity.
One must also consider that larger polities usually enjoy greater de facto sovereignty, which may be understood in terms of military power (Hendershot, Reference Hendershot1973), soft power (Nye, Reference Nye2005), or freedom from external obligations and constraints (Lake, Reference Lake2009). While large states delegate ‘down’ (to various institutions within the state), small states delegate ‘up’ (to international organizations), surrendering some aspects of sovereignty in the process (Hawkins et al., Reference Hawkins, Lake, Nielson and Tierney2006). This means that the citizen of a large polity enjoys greater self-rule than the citizen of a small polity, being less dependent upon the actions of international institutions, bilateral and multilateral agreements, foreign countries, and the vagaries of international trade. Insofar as democracy presumes sovereignty, the citizen in a larger polity enjoys a greater degree of that ineffable quantity.
The strongest formulation of our argument suggests that there is an equilibrating feature inherent in the political organization in the modern era such that a similar level of citizen engagement and influence, sovereignty, and overall coordination is retained regardless of the size of the political unit(s). An implication of this argument is that the size question (how large should a polity be?), which has preoccupied scholars and state-makers for millennia, is no longer as consequential as it once was. Large polities reproduce the features of small polities by diffusing power internally, both vertically and horizontally. Small polities reproduce the features of large polities by delegating power externally.
Of course, we do not mean to suggest that all things are truly equal, and that size is therefore irrelevant. The European Union is different from the set of independent European states that it replaced, just as the United States is different from the independent states that might have arisen in its place. So the argument for functional equivalence is only very partially correct. It is an important tendency, nonetheless. Substantive differences arising from polity size are sometimes overdrawn. Size affects the structure in ways that are partially re-equilibrating.
Acknowledgment
This research project was supported by Riksbankens Jubileumsfond, Grant M13-0559:1, PI: Staffan I. Lindberg, V-Dem Institute, University of Gothenburg, Sweden. The authors also wish to acknowledge Lawrence Broz, Zach Elkins, Gary Feinman, Tom Ginsburg, Gary Marks, Stelios Michalopoulos, and Jessica Trounstine for valuable assistance or feedback.
Supplementary material
To view supplementary material for this article, please visit https://doi.org/10.1017/S175577391800005X


