Introduction
Major depressive disorder (MDD) manifested with the core symptoms of low mood and anhedonia (Muller et al., Reference Muller, Cieslik, Serbanescu, Laird, Fox and Eickhoff2017) is closely related to the reward circuitry of brain. The ventral striatum, characterized by the ventral pallidum, is an important convergent structure at the interface of the motivational and reward circuitry (Pessiglione et al., Reference Pessiglione, Schmidt, Draganski, Kalisch, Lau, Dolan and Frith2007; Smith et al., Reference Smith, Tindell, Aldridge and Berridge2009). The ventral striatum receives dense inputs from the prefrontal cortex (PFC) and other components of the mesolimbic reward pathway, and transmits information to downstream targets, such as the ventral tegmental area and the lateral habenula (Sturup et al., Reference Sturup, Kristiansson and Lindqvist2011; Root et al., Reference Root, Melendez, Zaborszky and Napier2015; Hanson et al., Reference Hanson, Knodt, Brigidi and Hariri2018). Recent study has confirmed the role of ventral pallidal neural populations in mediating depressive symptoms (Knowland et al., Reference Knowland, Lilascharoen, Pacia, Shin, Wang and Lim2017). Moreover, previous neuroimaging studies also demonstrated that abnormal task activation and altered functional connectivity (FC) of the reward system, especially the neural activity in the ventral striatum was correlated with the depression severity (Hamilton et al., Reference Hamilton, Chen, Thomason, Schwartz and Gotlib2011; Kaiser et al., Reference Kaiser, Andrews-Hanna, Wager and Pizzagalli2015). These evidences support that altered striatal connectivity could be closely related to the pathogenesis of depression.
Increasing evidence indicates that inflammation may play an important role in the pathophysiology of MDD (Miller et al., Reference Miller, Maletic and Raison2009; Kim et al., Reference Kim, Nunes, Oliveira, Young and Lafer2016). Various inflammatory cytokines, including tumor necrosis factor-α (TNF-α), interleukin-6 (IL-6), and IL-β, were found elevated in the serum of MDD patients and correlated with the depressed mood (Schmidt et al., Reference Schmidt, Shelton and Duman2011; Hughes et al., Reference Hughes, Connor and Harkin2016; Kim et al., Reference Kim, Nunes, Oliveira, Young and Lafer2016). Notably, genome-based evidence showed that, among the various proinflammatory cytokines related to MDD, the TNF-α was the only one found with significant association with MDD at genome-wide level (Boomsma et al., Reference Boomsma, Willemsen, Sullivan, Heutink, Meijer, Sondervan, Kluft, Smit, Nolen, Zitman, Smit, Hoogendijk, van Dyck, de Geus and Penninx2008). Similarly, the role of TNF-α overproduction in depression has been widely reported and highlighted by meta-analyses (Dowlati et al., Reference Dowlati, Herrmann, Swardfager, Liu, Sham, Reim and Lanctot2010; Oglodek et al., Reference Oglodek, Just, Szromek and Araszkiewicz2017).
Preclinical studies reported that the TNF-α has a direct inhibitory effect on neurogenesis to attenuate antidepressant efficacy (Monje et al., Reference Monje, Toda and Palmer2003; Iosif et al., Reference Iosif, Ekdahl, Ahlenius, Pronk, Bonde, Kokaia, Jacobsen and Lindvall2006). MDD individuals with abnormal allelic variants of the genes of TNF-α demonstrated attenuated therapeutic response to antidepressant treatment (Eller et al., Reference Eller, Vasar, Shlik and Maron2008; Schmidt et al., Reference Schmidt, Shelton and Duman2011). On the contrary, the cyclooxygenase-2 inhibitor celecoxib that inhibits the production of pro-inflammatory cytokines (including TNF-α) could induce a rapid antidepressant response in patients with MDD (Muller et al., Reference Muller, Schwarz, Dehning, Douhe, Cerovecki, Goldstein-Muller, Spellmann, Hetzel, Maino, Kleindienst, Moller, Arolt and Riedel2006). Taken together, these evidences confirmed the role of TNF-α in disturbing the response to antidepressant treatment in MDD patients.
However, based on the existing findings, it is still difficult to explicit the specific neurobiological process of the inhibitory effect of TNF-α on antidepressant treatment in vivo. Notably, recent preclinical studies showed increased expression of TNF-α and altered mRNA transcription of TNF-α in the striatum in lipopolysaccharide-stressed mice/rat (Bay-Richter et al., Reference Bay-Richter, Janelidze, Hallberg and Brundin2011; Zhao et al., Reference Zhao, Cao, Liu, Li, Xu, Liu, Zhang, Yang, Yi, Xu, Fan and Ma2017). Moreover, other evidences suggested that inflammation was associated with the alteration of FC (Felger et al., Reference Felger, Li, Haroon, Woolwine, Jung, Hu and Miller2016) as well as dopamine metabolism (Petrulli et al., Reference Petrulli, Kalish, Nabulsi, Huang, Hannestad and Morris2017) in the striatal reward system. These findings may lead to the speculation that the reward system (esp. the striatum) may be one important target of TNF-α in the brain to induce disturbance effect during antidepressant treatment. Therefore, by conducting a longitudinal observation in this study, we focused on the striatal FC in MDD patients and for the first time investigated its relationship to selective serotonin reuptake inhibitor (SSRI) treatment and serum TNF-α level. We hypothesize that the effect of SSRI treatment on striatal connectivity is depending on the level of TNF-α in patients with MDD.
Materials and methods
Subjects
This study was registered on Chinese Clinical Trial Registry (http://www.chictr.org.cn) with a registration number ChiCTR-IPR-14005427. The blood sample and magnetic resonance imaging (MRI) data were collected from all enrolled participants. Each participant was informed of all procedures of the study and signed the written informed consent. The ethics committees of all institutions involved in data collection approved the project.
Initially, resting-state functional MRI (rs-fMRI) data, blood sample, and clinical data were collected from 109 participants, including 74 patients with a primary diagnosis of MDD and 35 healthy controls recruited through advertisements. The inclusion criteria for all the subjects were (1) right-handed Han-Chinese and (2) aged from 18 to 65. Additional inclusion criteria for MDD group were: (1) meeting the diagnosis criteria for MDD according to the Structured Clinical Interview for DSM-IV (First et al., Reference First, Gibbon and Williams2002); (2) having a 24-item Hamilton Rating Scale for Depression (HAMD) score⩾17; and (3) free of psychotropic medications within the 2 weeks before MR scan and blood sampling, including antidepressants, mood stabilizers, antipsychotics, stimulants, sedative hypnotics, and benzodiazepines. Additional inclusion criteria for controls were: (1) not meet the diagnosis criteria for MDD; (2) free of any medication for a minimum of 4 weeks before the study; and (3) without family history of psychiatric disorder. Exclusion criteria for all the subjects included (1) any history of substance abuse or dependence (excluding nicotine); (2) head trauma with loss of consciousness; (3) any organic lesion in brain; (4) hepatorenal/cardiopulmonary dysfunction or endocrine disease; (5) documented intellectual impairment; (6) suicidal ideation or behavior; (7) any contraindications for MRI scanning; and (8) excessive head motion during MR scan. Due to the specific purpose of this study, we specifically investigated information associated with inflammation and excluded the subjects with (9) any evidence of active infections at the time of MR scan (fever, increased level of C-reaction protein or white blood cell, etc.); (10) any history of chronic diseases relating to a chronic inflammatory status (including chronic hepatitis, nephritis, pulmonary disease, and autoimmune disorders); (11) free of medications known to affect the immune system, including nonsteroidal/steroidal anti-inflammatories, statins/angiotensin 2 receptor inhibitors, etc. Moreover, additional exclusion criteria for MDDs included (1) not available at follow-up and (2) lifetime psychiatric disorders other than depression.
Finally, 25 patients with MDD (MDD group) having follow-up data were included (see online Supplementary Fig. S1 for detailed process of subject enrollment). Another 35 healthy controls matched for age, gender, education level, and body mass index (BMI) were included as the control (CON) group. For the MDD group, 14 of the 25 patients had recurrent MDD, and the other 11 were experiencing a first episode MDD. The mean current duration of disease before MR scan was 6.7 months. Depression severity was assessed using the HAMD at baseline and week-6 respectively (Ho et al., Reference Ho, Yang, Wu, Cassey, Brown, Hoang, Chan, Connolly, Henje-Blom, Duncan, Chesney, Paulus, Max, Patel, Simmons and Yang2014). During a 6-week follow-up, all MDD patients were treated with the paroxetine 20–60 mg per day after finishing the baseline examinations. Medication dose was decided according to the physical status and depression severity of the patients.
Blood sample analyses
Blood sample was taken from each participant within 24 h before or after the MR scan. The analysis of serum TNF-α was performed in accordance with previously described procedures (Liu et al., Reference Liu, Liu, Wang, Xu, Liu, Sun, Su, Wang and Jiang2014). Briefly, cytokine standards and samples (50 µL) were mixed with 50 µL of the antibody-coupled microsphere set (Milliplex MAP Human Adipokine Magnetic Bead Penal 2, kit lot #: 2922078) (2000 beads/well) for 30 min at room temperature on a plate shaker (300 r/min) in the dark. Here, to avoid the measurement bias caused by using another plate, we randomly selected the samples from 25 controls out of all the 35 controls then filled up the 96-well plate. Then, the mixture was filter-washed three times with 100 µL of washing buffer. After washing, the mixture was added to 25 µL/well of freshly diluted secondary/detection antibody, incubated at room temperature on a plate shaker at 300 r/min for 30 min in the dark, and filter-washed with 100 µL of washing buffer three times. Afterward, 50 µL of streptavidin-PE was added to each well, and the plate was incubated at room temperature on a plate shaker. The bound beads were washed three times with 100 µL of washing buffer. Assay buffer (125 µL) was then added to each well, and the plate was placed on a plate shaker at 500 r/min for 1 min. Quantification of the cytokines/chemokines was performed using the Luminex 200 system (Luminex, Austin, TX, USA) in accordance with the manufacturer's instructions. All measurements were done for each subject with three to four replicates.
MRI acquisition
All MR images were acquired on a clinical 3.0T scanner (Achieva, Philips Medical Systems, Best, The Netherlands) equipped with a quadrature head coil. For brain segmentation and normalization (Kong et al., Reference Kong, Deng and Dai2015), a turbo field echo sequence was used to collect the whole-brain high-resolution three-dimensional T1-weighted images (3D-T1WI) with the following parameters: time of repetition (TR) = 8.2 ms, time of echo (TE) = 3.8 ms, flip angle = 7°, bandwidth = 191 Hz, field of view (FOV) = 256 × 256 mm2, voxel size = 1.0 × 1.0 × 1.0 mm3. rs-fMRI data were acquired using a field-echo echo-planar imaging sequence with the following parameters: TR = 2000 ms, TE = 30 ms, flip angle = 90°, bandwidth = 4131 Hz, FOV = 240 × 240 mm2, voxel size = 3.4 × 3.4 × 3.4 mm3, 33 axial slices, and total volumes = 240. Besides, routine sequences including T1WI, T2-WI, and fluid attenuated inversion recovery imaging were scanned for each subject to detect and exclude any clinical brain abnormalities.
Data preprocessing
All the acquired rs-fMRI images were preprocessed utilizing Statistical Parametric Mapping (SPM8, Wellcome Department of Cognitive Neurology, http://www.fil.ion.ucl.ac.uk/spm/). See ‘1. Data preprocessing’ in Supplementary Appendix for detailed procedures of data processing.
Calculation of striatal FC
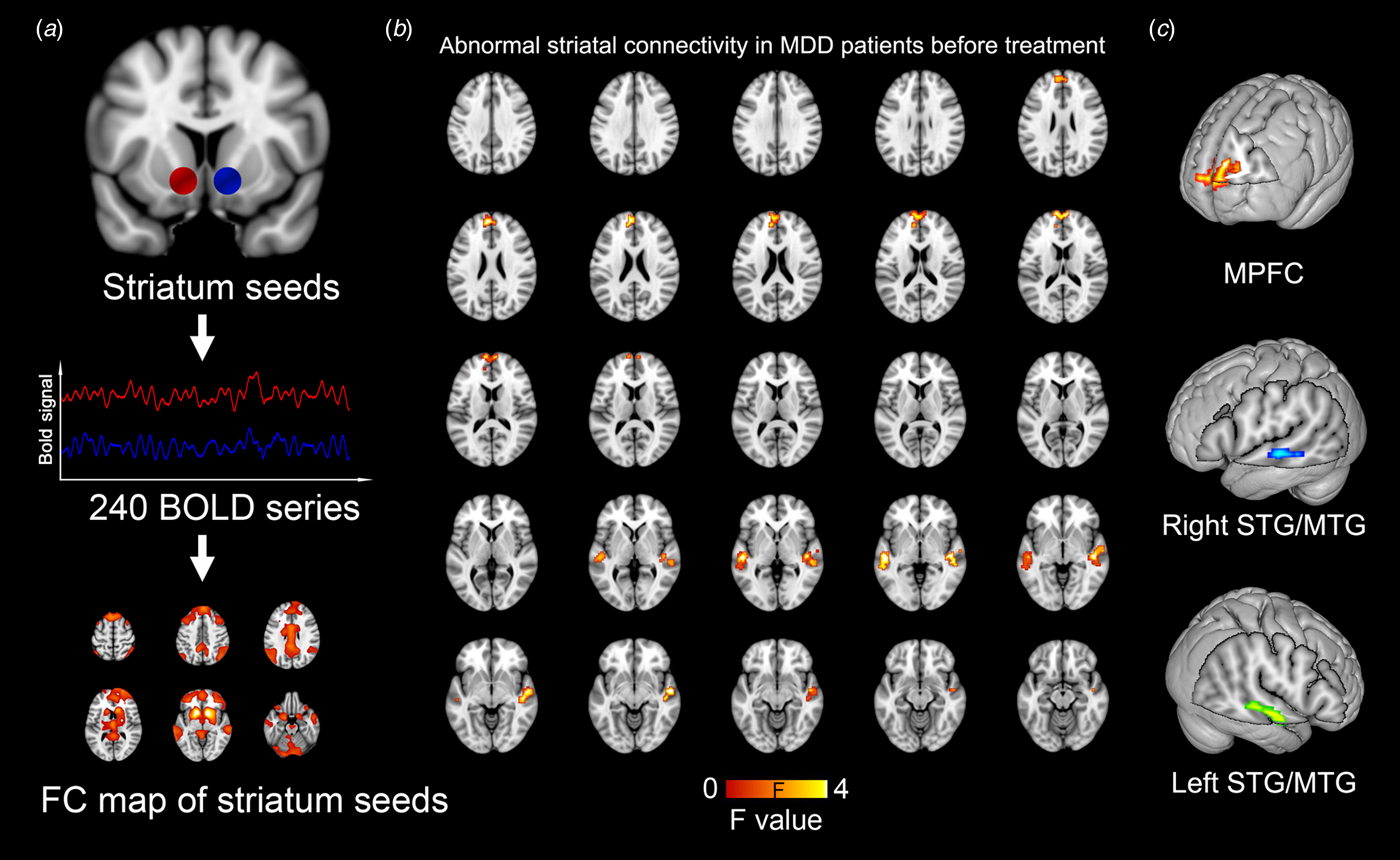
The region of interest (ROI) of striatum in the brain was defined based on the previously reported meta-analysis by Bartra et al. (Reference Bartra, McGuire and Kable2013), and this definition was adopted by multiple studies (Satterthwaite et al., Reference Satterthwaite, Kable, Vandekar, Katchmar, Bassett, Baldassano, Ruparel, Elliott, Sheline, Gur, Gur, Davatzikos, Leibenluft, Thase and Wolf2015; Pan et al., Reference Pan, Sato, Salum, Rohde, Gadelha, Zugman, Mari, Jackowski, Picon, Miguel, Pine, Leibenluft, Bressan and Stringaris2017). Two spherical ROIs centered at the Montreal Neurological Institute (MNI) coordinates of (left: −12, 12, −6; right: 12, 10, −6) were created as seed regions of striatums with a radius of 5 mm (Fig. 1a). For a single subject, whole-brain resting-state FC (RSFC) map was created by calculating the Pearson correlation coefficient between the blood-oxygen-level dependent time series extracted from the seed ROI of striatum and the time series from all other brain voxels. To increase the data normality, a fisher-Z-transformation was performed for each voxel before group-level statistical analyses in further steps. Due to the biological significance of the negative correlation still be unclear (Weissenbacher et al., Reference Weissenbacher, Kasess, Gerstl, Lanzenberger, Moser and Windischberger2009), we restricted our analysis to positive correlations by replacing negative correlations to zero. It was noted that the RSFC maps of left and right striatum were highly similar to each other (with a voxel-wise correlation coefficient of 0.915). Therefore, to limit the number of statistical tests and for ease of presentation, we followed previous approaches (Luking et al., Reference Luking, Repovs, Belden, Gaffrey, Botteron, Luby and Barch2011; Cullen et al., Reference Cullen, Westlund, Klimes-Dougan, Mueller, Houri, Eberly and Lim2014) by averaging each individual's bilateral striatum RSFC maps.

Fig. 1. Abnormal striatal connectivity in MDD patients as compared with healthy controls before treatment. Whole-brain RSFC map is created based on the blood oxygen level dependent time series from spherical seed regions of striatums (a) The striatal RSFC difference is evaluated between MDD and the control group with a statistical significance level of p = 0.001 (uncorrected). (b) Three clusters with statistical significance are identified, including the MPFC and bilateral STG/MTG (c).
Statistical analysis
Differences in age, education, BMI, daily cigarette use, brain volume, mean frame-wise displacement (FWD), HAMD, Hamilton Rating Scale for Anxiety (HAMA), and TNF-α level between MDD and CON groups were evaluated using the two-sample t test, or Mann–Whitney U test for non-normally distributed data. Differences in gender and family history were assessed using the χ2 test. The SPSS software (version 16.0) was used. A p = 0.05 (two-sided) was considered statistically significant.
The statistical analyses on striatal FC maps were performed using the SPM8. First, a two-sample t test was performed to locate the significant abnormal striatal connectivity in MDD patients as compared with healthy before treatment. A statistical significance threshold of p = 0.001 (uncorrected, with cluster size >30 voxels) was adopted. It's worth noting that the head motion effect on FC has been emphasized in recent years (Power et al., Reference Power, Mitra, Laumann, Snyder, Schlaggar and Petersen2014; Zeng et al., Reference Zeng, Wang, Fox, Sabuncu, Hu, Ge, Buckner and Liu2014). Therefore, we added the mean FWD along with age and gender as covariates to exclude their confounding effects. A power estimation was done by using software of The Power and Sample Size Calculations (Version 3.1.2) based on the mean FC values of the significant clusters at a significance level of p = 0.001. Second, the mean FC value (Fisher-Z transformed) of each resultant cluster with significant between-group difference in previous step was extracted for each MDD individuals. Then, the interaction effect between ‘TNF-α’ (high or low TNF-α level, respectively defined as > or <the median of serum TNF-α level of control group) and ‘treatment’ (before or after SSRI treatment) on striatal connectivity was evaluated for each significant cluster in MDD patients to reveal whether the treatment-related FC changes were depending on the level of TNF-α. Here, the level of TNF-α was only observed at baseline and then used as a moderator to predict the treatment effect in the MDD group. For the cluster-level analysis, a full-factorial design was used with a significance threshold of p = 0.05 with the Bonferroni correction for the number of clusters, and age and gender were added as covariates (i.e. ‘Striatal_FC = b 0 + b 1 × treatment + b 2 × TNF-α + b 3 × treatment × TNF-α + b 4 × age + b 5 × gender + b 6 × FWD + b 7 × episodes’).
Furthermore, the correlations of treatment-related changes of striatal FC to the disease severity and baseline TNF-α were assessed. First, the HAMD scores of MDD patients before and after treatment was compared using repeated measures (with a significance level of p = 0.05) to test whether there was a significant improvement of the symptoms after SSRI treatment. Second, to evaluate the behavioral relevance of striatal connectivity change in MDD patients, the pre- to post-treatment change of HAMD score was correlated with the pre- to post-treatment difference of mean FC values for each significant cluster (in previous step) in MDD patients. Similarly, the correlation between the pre- to post-treatment FC differences and the level of baseline TNF-α was assessed. Spearman correlation was used with a significance threshold of p = 0.05 (Bonferroni correction for the number of clusters), and partial correlation was further performed to adjust the influence of age, gender, head motion, and episode of the disease. Third, the interaction effect of ‘TNF-α × treatment’ on HAMD was assessed in MDD patients to test whether the treatment-related change of disease severity was depending on the level of baseline TNF-α. A p < 0.05 was considered statistically significant, and age, gender, and episode of disease were added as covariates.
Finally, to evaluate the influences of a series of confounding factors on the striatal FC of interest, linear regressions were performed by adding the baseline striatal FC value and the pre- to post-treatment FC difference as the dependent variable, respectively (see ‘2. Regression analysis’ in Supplementary Appendix for more details).
Results
Demographic and clinical characteristics
There was no significant difference in age, gender, education, BMI, daily cigarette use, brain size, head motion during MR scan, and serum TNF-α (p = 0.372) between the two groups of MDD and CON. Patients with MDD showed significantly increased scores of HAMD and HAMA (both ps <0.001). The ratio of positive family history of MDD was significantly higher in MDD group (p < 0.001). See Table 1 for more details.
Table 1. Demographic and clinical characteristics of participates with MDD and healthy controls (CON)

FWD, frame-wise displacement; HAMD, Hamilton depression scale; HAMA, Hamilton anxiety scale; TNF, tumor necrosis factor.
*Stands for having statistical significance; ‘mean ± s.d.’ is applied for normally distributed data, and ‘median (range)’ is used otherwise.
Abnormal striatal connectivity in MDD patients before treatment
The voxel-wise between-group comparison revealed three cortical regions with significantly different striatal FC in MDD patients before treatment as compared with healthy controls (p < 0.001, uncorrected), including the medial prefrontal cortex (MPFC) and the bilateral middle/superior temporal gyrus (MTG/STG). All the three regions showed significantly increased FC to the striatum in MDD patients (Fig. 1, Table 2). Moreover, based on our striatal FC data, power analyses indicated that a comparison with 25 MDDs and 35 controls could achieve a power of 0.885 to detect a between-group difference.
Table 2. Brain regions with significant difference of striatal connectivity between the healthy controls and the patients with MDD at baseline
M., medial; L., left; R., right; PFC, prefrontal cortex; STG/MTG, superior/middle temporal gyrus; BA, Brodmann area; MNI, Montreal Neurological Institute.
p = 0.001 with a cluster threshold of 30 voxels is used as the significance level.
Interaction effect of TNF-α × treatment on the striatal connectivity with abnormality in MDD patients
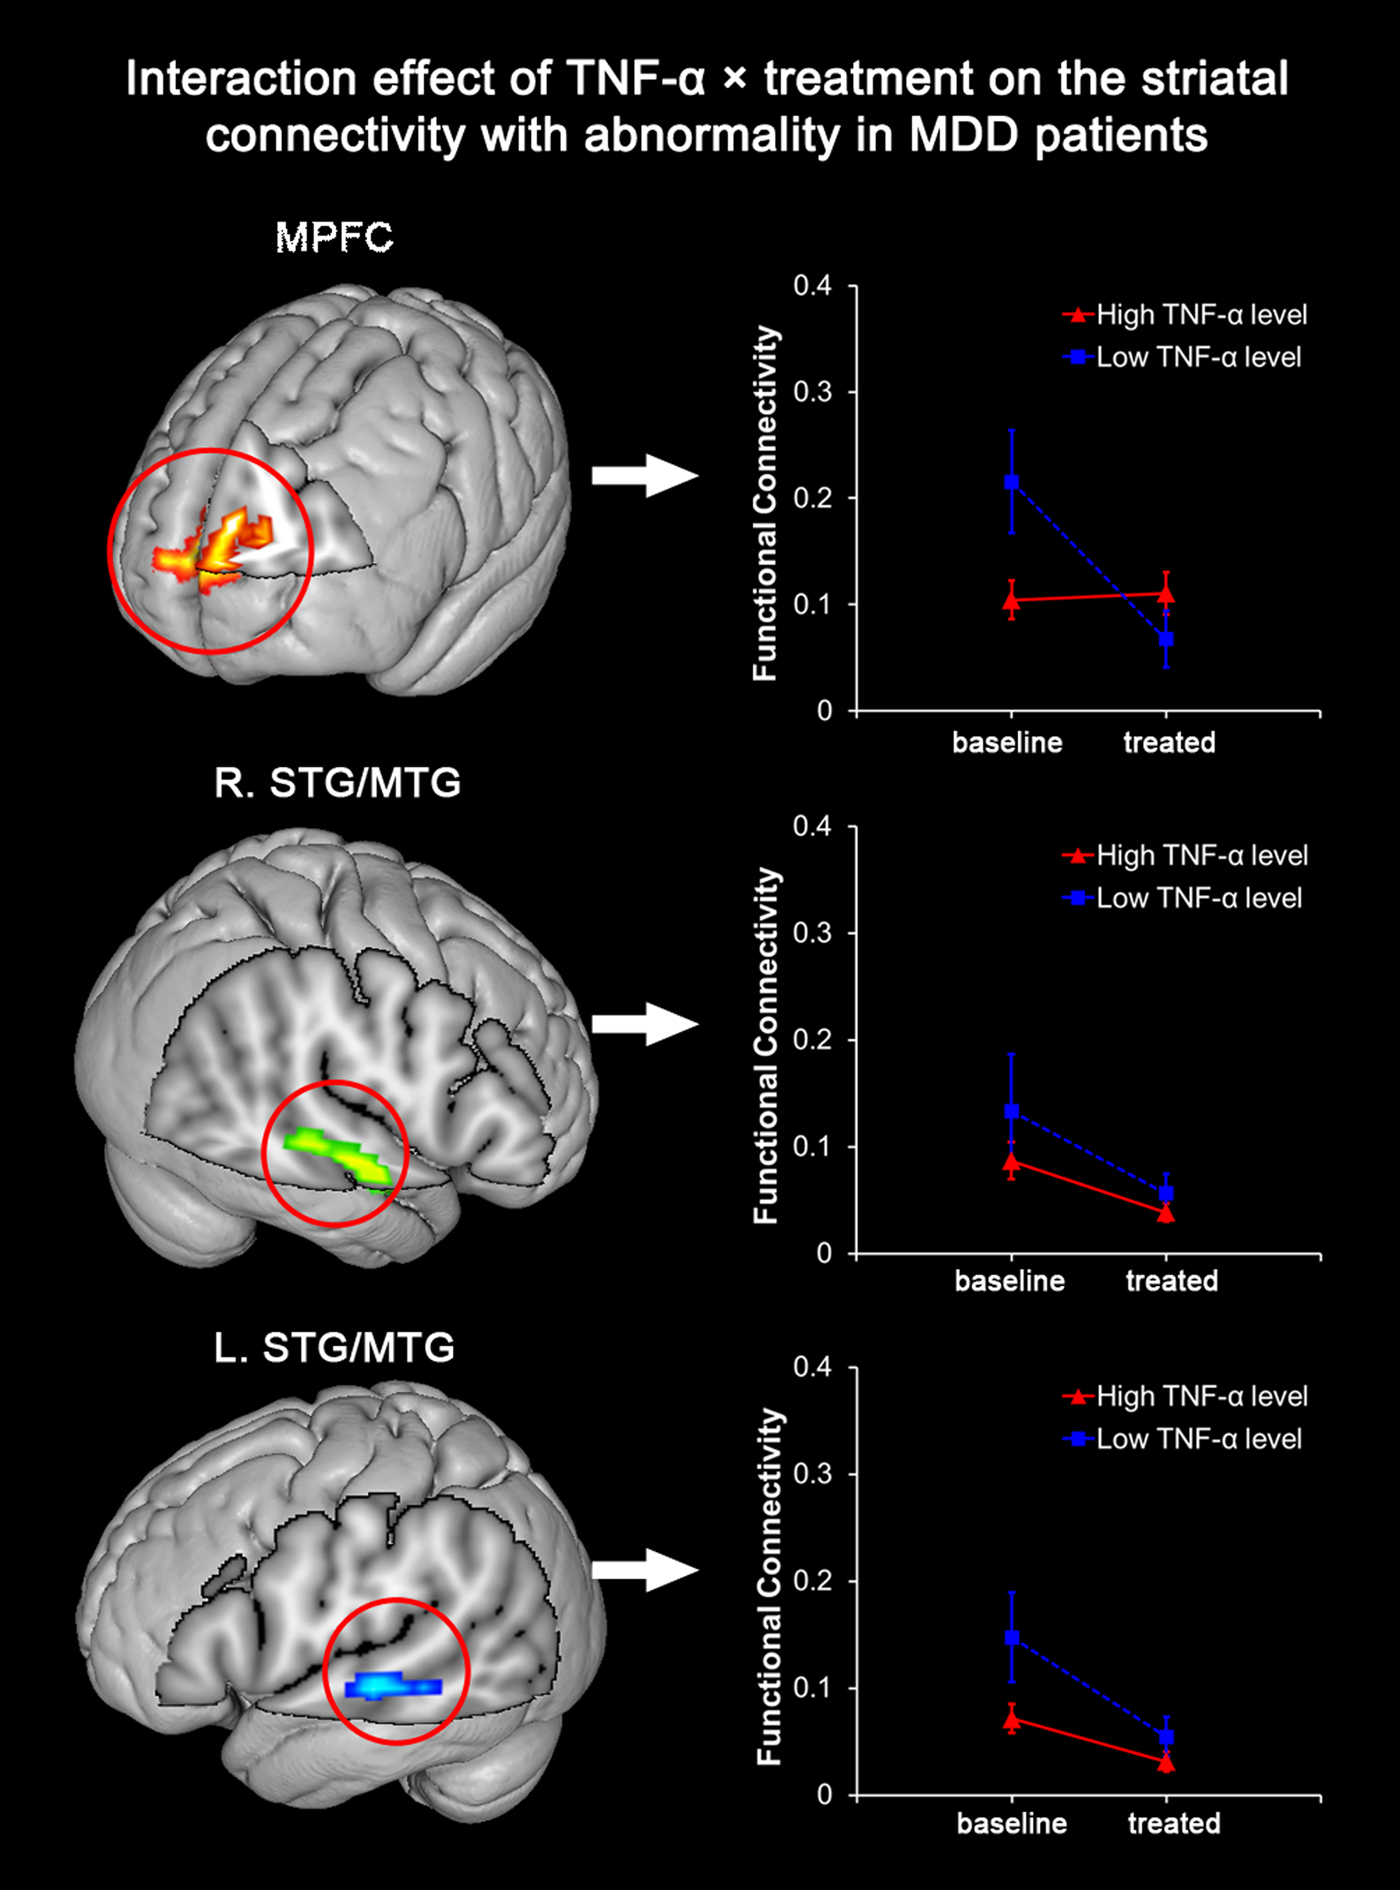
Among the three cortical clusters with abnormally elevated striatal FC in MDD patients before treatment, the MPFC was found with a significant interaction of TNF-α × treatment (p = 0.002). In another word, the extent of post- to pre-treatment striatal FC decrease during SSRI treatment in the MPFC was significantly dependent on the level of baseline TNF-α. MDD patients with a high level of TNF-α were observed with a less significant longitudinal decrease of MPFC-striatum connectivity after SSRI treatment (Fig. 2). After adjusting for age, gender, head motion, and episode of disease, the observed interaction effect on striatal FC of the MPFC remained significant (p = 0.002). On the other hand, the interaction of TNF-α × treatment on the striatal FC of the bilateral STG/MTG regions was insignificant before (right: p = 0.584; left: p = 0.132) or after adjustment (right: p = 0.286; left: p = 0.125).

Fig. 2. Interaction between TNF-α level and SSRI treatment on striatal connectivity in patients with MDD. Among the three clusters with significantly abnormal striatal connectivity before SSRI treatment, the MPFC is found with significant interaction between ‘TNF-α level’ (high or low TNF-α level) and ‘SSRI treatment’ (before or after SSRI treatment) in MDD patients (p = 0.002). A significant longitudinal decrease of MPFC-striatum connectivity is observed in MDDs with a low level of TNF-α after treatment, but not in those with a high level of TNF-α.
Correlations of striatal FC change to HAMD change and TNF-α level
After SSRI treatment, the HAMD scores of MDD patients were significantly decreased (F = 15.787, p < 0.001, Fig. 3a). Among the three significant clusters, the pre- to post-treatment striatal FC difference of the MPFC was negatively correlated with the baseline TNF-α level in the MDD group (r = −0.499, p = 0.011). In another word, a lower level of TNF-α at baseline was related to a more significant decrease of striatal FC after treatment in MDD patients (Fig. 3b). However, after adjusting for age, gender, head motion, and episode of disease, this correlation between TNF-α level and striatal FC decrease in MPFC (r = −0.515, p = 0.017) didn't survived the Bonferroni correction (i.e. 0.017). Moreover, the correlation between the decrease of HAMD score and the decrease of striatal FC in MDD patients was insignificant in MPFC (r = 0.068, p = 0.769), right STG/MTG (r = 0.231, p = 0.314), and left STG/MTG (r = 0.331, p = 0.142). Finally, the interaction effect of TNF-α × treatment on HAMD score in MDD patients was of no statistical significance (p = 0.330, Fig. 3c).

Fig. 3. Relationship of the striatal FC change to HAMD change and level of TNF-α. (a) The HAMD scores in MDD patients are significantly decreased after SSRI treatment (F = 15.787, p < 0.001). (b) The interaction effect of ‘TNF-α × treatment’ on HAMD score in MDD patients is of no statistical significance (p = 0.350). (c) The post- to pre-treatment FC decrease between striatum and MPFC is negatively correlated with the baseline level of TNF-α (r = −0.499, p = 0.011).
Possible influences of confounding factors on the MPFC-striatum connectivity
After stepwise regression, the significant contributors of MPFC-striatum connectivity at baseline were head motion (p = 0.033) and depression (p < 0.001), and the baseline TNF-α level (p = 0.002) was the only significant predictor of MPFC-striatum connectivity decrease after treatment. See online Supplementary Appendix for more details.
Discussion
To date, this is the first study that explored the combined influence of TNF-α level and SSRI treatment on the striatal FC in patients with MDD. The results confirmed that the treatment-related prefrontal-striatal FC decrease was significantly dependent on the serum TNF-α level in MDD patients. In another word, the extent of FC decrease between striatum and prefrontal cortices after SSRI treatment was less significant in MDD individuals with a high level of TNF-α. Therefore, this finding may suggest that elevated TNF-α level possibly disturbs the effect of SSRI on the striatal connectivity in MDD patients.
Hyperconnectivity of striatum has been recognized as one important neurobiological substrate that relates to the pathogenesis of MDD. As one of the key components of reward and emotion regulation networks, the striatum were consistently found with elevated FC to dorsal lateral PFC and MPFC in MDD by previous studies (Kuhn and Gallinat, Reference Kuhn and Gallinat2013; Heller, Reference Heller2016; Hanson et al., Reference Hanson, Knodt, Brigidi and Hariri2018; Quevedo et al., Reference Quevedo, Ng, Scott, Kodavaganti, Smyda, Diwadkar and Phillips2017). The input from the PFC to the striatum is related to the processing of self-relevant feedback and integrate this information into one's self-concept or internal motivational states (Sturup et al., Reference Sturup, Kristiansson and Lindqvist2011; Hanson et al., Reference Hanson, Knodt, Brigidi and Hariri2018). The increased FC between striatum and PFC was considered to be associated with increased self-focus and negative self-attribution in depressed patients (Grimm et al., Reference Grimm, Ernst, Boesiger, Schuepbach, Hell, Boeker and Northoff2009; Sheline et al., Reference Sheline, Price, Yan and Mintun2010; Marchetti et al., Reference Marchetti, Koster, Sonuga-Barke and De Raedt2012). These findings are well consistent with our current result of a hyper MPFC-striatum connectivity found in MDD individuals.
This study provides evidence that TNF-α may disturb the effect of antidepressant on reducing the abnormal striatal FC. Based on previous evidences, TNF-α could inhibit the effect of SSRI by two possible mechanisms. First, as has been widely reported, TNF-α could reduce 5-hydroxytryptamine (5-HT) availability by activating serotonin transporters (SERT) (Zhu et al., Reference Zhu, Blakely and Hewlett2006; Manosso et al., Reference Manosso, Neis, Moretti, Daufenbach, Freitas, Colla and Rodrigues2013). For example, Zhu et al. found that TNF-α motivated the 5-HT uptake in mouse midbrain and striatal synaptosomes (Zhu et al., Reference Zhu, Blakely and Hewlett2006). On the other hand, knockout of TNF-α receptors in mice increased the levels of 5-HT in the synaptic cleft (Yamada et al., Reference Yamada, Iida, Miyamoto, Saito, Sekikawa, Seishima and Nabeshima2000). Thus, high-level TNF-α may disturb the therapeutic outcome of SSRI by antagonizing the effect of SSRI on SERT. Second, and perhaps more importantly, TNF-α could disturb the metabolism of tryptophan mainly by stimulating the indoleamine 2,3-dioxygenase (IDO) (Myint and Kim, Reference Myint and Kim2014; Ma et al., Reference Ma, Zhang and Baloch2016). Tryptophan is metabolized in two ways – the kynurenine (KYN) pathway and the serotonin-synthesis pathway, and IDO is the key enzyme of the KYN pathway. On the one hand, TNF-α-mediated IDO activation boosts the KYN pathway thus simultaneously attenuates the conversion of tryptophan into serotonin, and thus finally antagonizes the effect of SSRI by decreasing the levels of serotonin. On the other hand, the accumulated production of quinolinic acid by the KYN pathway may result in excitotoxicity to neurons (Guillemin et al., Reference Guillemin, Smythe, Takikawa and Brew2005). Therefore, this neural excitotoxicity may correspond to the status of hyperconnectivity as currently observed in MDDs, and is possibly modified by the TNF-α level during SSRI treatment. Moreover, there has been evidence that this metabolic imbalance between KYN and serotonin-synthesis pathways could not be reversed after 6-week treatment with SSRIs (Myint et al., Reference Myint, Kim, Verkerk, Scharpe, Steinbusch and Leonard2007), thus possibly indicating that the TNF-α-mediated KYN pathway enhancement and subsequent neural excitotoxicity is not responsive to the SSRI treatment. This evidence is particularly consistent with our result that the MPFC-striatum connectivity which significantly dropped in MDDs with low TNF-α level, was not decreased but slightly elevated in those with high TNF-α level during the 6-week SSRI treatment (Gadek-Michalska et al., Reference Gadek-Michalska, Tadeusz, Rachwalska and Bugajski2013; Ma et al., Reference Ma, Zhang and Baloch2016). Meanwhile, it's worth noting that the striatal FC to temporal cortices, though also found with a significant drop in MDD patients after SSRI treatment, was not significantly mediated by the level of TNF-α. Therefore, our results may support that the PFC-striatum circuit is one important target of TNF-α in MDDs’ brain to mediate the observed inhibitory effect on SSRI treatment.
However, it should be noted that our results showed an insignificant interaction of treatment × TNF-α on HAMD score. On the one hand, since a trend was noted that the longitudinal decrease of HAMD after treatment was slightly greater in MDDs with a low TNF-α level (mean HAMD dropped by 21.11) than in those with a high TNF-α level (mean HAMD dropped by 18.81), we may attribute the current insignificant interaction to the limited sample size of our cohort, especially considering that the HAMD data primarily based on subjective evaluation might be not stable with limited sample size. On the other hand, this insignificant finding perhaps suggested that the inhibitory effect of TNF-α on SSRI-induced prefrontal-striatal connectivity decrease may not be directly responsible for the divergent treatment outcomes at behavioral level, or may be only one of the contributors that partly lead to attenuated antidepressant efficacy. Therefore, based on the current results, it should be noted that the prefrontal-striatal connectivity change is not equal to the therapeutic efficacy, and thus should be taken with caution.
Several strengths of this study included highly selected sample, a longitudinal follow-up for all MDD subjects, full-set individual data collected in single-center within 24 h (blood sample, fMRI, clinical data) etc. However, it should be noted that the sample size was relatively small. Meanwhile, due to the exploratory nature of this study, we adopted a less conservative significance threshold of p < 0.001 without correction for voxel-wise analysis. Therefore, future studies with larger sample size are still needed to reinforce the current conclusion. Second, regarding the grouping strategy, introducing a placebo-control group of MDDs was not realized in this study, thus may complicated the evaluation of antidepressant effect. Besides, a secondary analysis respectively for only recurrent and first episode MDDs was not performed in this study for the same reason of sample size limitation. Such a specialized secondary analysis is helpful to better elucidate the specific patterns of FC changes relating to different mechanisms of the disease, and is highly encouraged in future work. The third limitation is that a repeated MR scan was not performed for control group. Thus, a longitudinal between-group comparison which may help to better clarify the effect of treatment was prohibited. Finally, anti-inflammatory therapy was not introduced in this study. In line with our speculation, it is possible that the anti-inflammatory therapy may improve the response of striatal FC to antidepressant in MDD patients with a high-level TNF-α. Thus, further study focusing on the collaborative effect of SSRI and anti-inflammatory treatments on improving the prefrontal-striatal connectivity may help to provide more conclusive evidence.
Conclusion
In summary, based on a longitudinal observation by combining fMRI and biochemical analyses, this study evaluated the effect of TNF-α level on the abnormal connectivities in MDDs during SSRI treatment. The results revealed that post- to pre-treatment prefrontal-striatal FC decrease was significantly dependent on the serum TNF-α level in MDD patients. Therefore, our finding may provide evidence that the TNF-α may play a role in disturbing the treatment-related effect of SSRI, and the PFC-striatum connectivity possibly serves as one important target for this process in the brain of MDD patients.
Supplementary material
The supplementary material for this article can be found at https://doi.org/10.1017/S0033291718003616.
Author ORCIDs
Zhiping Lv 0000-0003-0025-8098
Acknowledgements
The study was supported by the grants from the National Natural Science Foundation of China (Nos. 81230085 and 81701674), Guangdong Natural Science Foundation (Nos. 2017A030313903 and 2018030310296), the Combined Science Technology Project of Guangdong Provincial Department of Science and Technology and Guangdong Provincial Academy of Traditional Chinese Medicine (No. 2014A020221011), the Guangdong Province Bureau of Traditional Chinese Medicine Scientific Research Project (No. 20161161), the Science and Technology Program of Guangzhou (No. 201607010357), and also supported by the grant from Open fund of Key Laboratory of Ministry of Education for TCM Viscera-State Theory and Applications, Liaoning University of Traditional Chinese Medicine (No. zyzx1802).
Conflict of interest
All the authors declare no conflict of interest.
Ethical standards
This study was registered on Chinese Clinical Trial Registry (http://www.chictr.org.cn) with a registration number of ChiCTR-IPR-14005427. All procedures performed in studies involving human participants were in accordance with the ethical standards of the institutional research committee and with the 1964 Helsinki declaration and its later amendments or comparable ethical standards. The ethics committees of all institutions involved in the study approved the project.
Informed consent
Informed consent was obtained from all individual participants included in the study.