


Background
The Glasgow Coma Scale (GCS) was developed in 1974 by Graham Teasdale and Bryan Jennet to assess the level of consciousness and brain function in neurosurgical patients. The scale was developed as a way to complement existing measures of assessing cognitive function; however, the scale’s ease of use and overall simplicity led to its wide adoption and eventual promotion to the primary method of assessing brain injury in the acute setting. The GCS is now used in over 80 countries and has been translated into the national languages of 74% of countries. Reference Teasdale, Maas, Lecky, Manley, Stocchetti and Murray1
The GCS is broken up into three main areas to assess brain function: eye movement, response to verbal commands, and motor function. Each of these three areas is assigned a numerical grade based on the patient response, and a cumulative grade out of 15 is then assigned to the patient. Eye opening response is graded out of four, with four being normal spontaneous eye movement; verbal response is graded out of five, with five being normally oriented conversation and verbalization of words; and motor response is graded out of six, with a six being normal obeying of commands for movement. A GCS cumulative grade of 13-14 indicates mild head injury; a GCS grade of 9-12 indicates a moderate head injury; and a GCS score of eight or less indicates a severe head injury, with a score of three indicating coma (no eye opening, inability to follow commands, no word verbalizations). Reference Fischer and Mathieson2 The grade assigned to patients is often used to determine subsequent treatment; for example, some trauma management algorithms dictate that all patients with GCS of eight or less require intubation.
The study hypothesis is that there is considerable variation in the use of this scale among different nations. This hypothesis arose from two main factors. First, the GCS was not intended by its initial authors to assess acute brain trauma, nor was it their intention to have a summative score of three distinct sections that would constitute a formal trauma score out of 15. Reference Mattei and Teasdale3 Second, it is well-documented that Emergency Medical Services (EMS) personnel are often inaccurate at assigning GCS scores in the field. Reference Kupas, Melnychuk and Young4 These two factors alone warrant some skepticism in the accuracy of the recorded scores for trauma patients, not to mention the possibility of variation in score assignment based on regional differences in the assessment of brain function.
Inconsistencies between nations may suggest issues with the clinical application of the scale and that a new, alternative method of assessing brain function in the setting of acute trauma may be needed, several of which have already been validated (eg, the Simplified Motor Score). Reference Caterino and Raubenolt5
Therefore, the goal of this study was to determine if there are significant discrepancies in the mean GCS scores (component and total) between different countries.
Methods
This was a descriptive study using data extracted from the Pan-Asian Trauma Outcomes Study (PATOS) database.
Ethical Compliance
Data for this study were obtained from the PATOS database. Permission for data use was granted by the PATOS Clinical Research Network following a peer-review process. The study was deemed not human subjects research by the Yale University institutional review board (New Haven, Connecticut USA; Protocol 1609018451) as all patient data were de-identified.
The PATOS is “an international, multicenter, and observational research network to collect trauma cases transported by Emergency Medical Services (EMS) providers” with the goal of providing “comparison of the trauma EMS systems and to benchmark best practice with participating communities.” Reference Kong, Shin and Tanaka6 Among the data collected from this large study are GCS scores assigned to patients by EMS personnel in the participating countries. The second author has been a member of the PATOS Research Advisory Committee since its inception in 2013 and has participated in efforts to assure accurate data entry and avoid potential sources of bias in the database.
Study Population
The population of interest was patients who were assigned a three-component GCS score (eyes, verbal, and motor), as recorded by EMS personnel, from January 2015 through December 2018.
Inclusion Criteria—Trauma patients in the PATOS database who were assigned a three-component GCS score by EMS were included. Reference Kong, Shin and Tanaka6 Any patient who was assigned more than one GCS score for whatever reason had only his or her first score considered. Table 1 shows total cases by country.
Table 1. Number of Component and Total GCS Values by Country used in Final Analysis

Abbreviations: GCS, Glasgow Coma Scale; JP, Japan; KR, Korea; MY, Malaysia; TH, Thailand; TW, Taiwan; VN, Vietnam.
Exclusion Criteria—Trauma patients in the PATOS database who were assigned only a one-component or two-component GCS score by EMS personnel; patients who were not assigned any GCS score by EMS personnel; and patients for whom an AVPU (alert, voice, pain, unresponsive) score was assigned instead of a GCS score were excluded. Countries with insufficient data (<30 EMS assigned GCS scores) were excluded from the analysis (Figure 1).

Figure 1. Inclusion/Exclusion Criteria.
Abbreviation: GCS, Glasgow Coma Scale.
Statistical Analysis
The distributions of mean component (eye, verbal, motor) and total GCS scores from six countries were assessed: Japan, Korea, Malaysia, Taiwan, Thailand, and Vietnam. The data were provided in a password-protected Excel (Microsoft Corp.; Redmond, Washington USA) spreadsheet by the PATOS Research Coordinator, based at the Laboratory of Emergency Medical Services, Biomedical Research Institute, Seoul National University Hospital in Seoul, Korea. After all GCS scores were sorted by country, SPSS (IBM Corp.; Armonk, New York USA) data analytics software was used to run one-way ANOVA and Bonferroni post-hoc tests to compare the means of the component and total scores among the countries. The post-hoc tests allowed for analysis of the data from each individual country and how that country’s mean scores compared to those of the other five. Results from the ANOVA were deemed significant if P <.05. It has become standard practice to evaluate the GCS as a continuous scale, as opposed to an ordinal scale, in terms of statistical analysis. As such, means were used for comparison as opposed to analyses otherwise used to evaluate ordinal variables.
Results
From 97,093 patients in the PATOS database, 15,173 met the inclusion criteria with the others being excluded as per Figure 1. Data from the 15,173 cases across these six countries showed significant differences in mean total GCS score among countries (P <.001) as well as in mean component GCS scores (P <.001 for each of eye, verbal, and motor). Using the Bonferroni post-hoc test, the difference between each individual country’s mean GCS scores (total and component) from all the other nations in the study was determined.
Eye
For the eye component, Japan, Malaysia, and Vietnam did not differ significantly from each other but did individually differ significantly from Korea, Taiwan, and Thailand. Korea, Taiwan, and Thailand differed significantly from all other countries (Table 2, Figure 2).
Table 2. Mean Difference in GCS Eye Component by Country

Note: Bolded values indicate statistically significant difference (P <.001).
Abbreviations: GCS, Glasgow Coma Scale; JP, Japan; KR, Korea; MY, Malaysia; TH, Thailand; TW, Taiwan; VN, Vietnam.

Figure 2. Mean GCS Eye Score by Country.
Abbreviations: GCS, Glasgow Coma Scale; JP, Japan; KR, Korea; MY, Malaysia; TH, Thailand; TW, Taiwan; VN, Vietnam.
Verbal
For the verbal component, Malaysia and Vietnam did not differ significantly from each other but differed significantly from all other countries. Similarly, Taiwan and Thailand did not differ significantly from each other but differed significantly from all other countries. Japan and Korea both differed significantly from all other countries (Table 3, Figure 3).
Table 3. Mean Difference in GCS Verbal Component by Country

Note: Bolded values indicate statistically significant difference (P <.001).
Abbreviations: GCS, Glasgow Coma Scale; JP, Japan; KR, Korea; MY, Malaysia; TH, Thailand; TW, Taiwan; VN, Vietnam.

Figure 3. Mean GCS Verbal by Country.
Abbreviations: GCS, Glasgow Coma Scale; JP, Japan; KR, Korea; MY, Malaysia; TH, Thailand; TW, Taiwan; VN, Vietnam.
Motor
For the motor component, again Japan, Malaysia, and Vietnam did not differ significantly from each other but did individually differ from all other countries. Taiwan and Thailand did not differ from each other significantly but did individually differ from all other countries. Korea differed significantly from all other countries (Table 4, Figure 4).
Table 4. Mean Difference in GCS Motor Component by Country

Note: Bolded values indicate statistically significant difference (P <.001).
Abbreviations: GCS, Glasgow Coma Scale; JP, Japan; KR, Korea; MY, Malaysia; TH, Thailand; TW, Taiwan; VN, Vietnam.

Figure 4. Mean GCS Motor by Country.
Abbreviations: GCS, Glasgow Coma Scale; JP, Japan; KR, Korea; MY, Malaysia; TH, Thailand; TW, Taiwan; VN, Vietnam.
Total
For total GCS scores, the results were the same as the eye and motor components: Japan, Malaysia, and Vietnam did not differ from each other significantly but did individually differ from all other countries. Taiwan and Thailand did not differ from each other but did individually differ from all other countries. Korea differed significantly from all other countries (Table 5, Figure 5). Percentages of each individual GCS total score by country are shown in Figures 6a and 6b.
Table 5. Mean Difference in Total GCS Score by Country
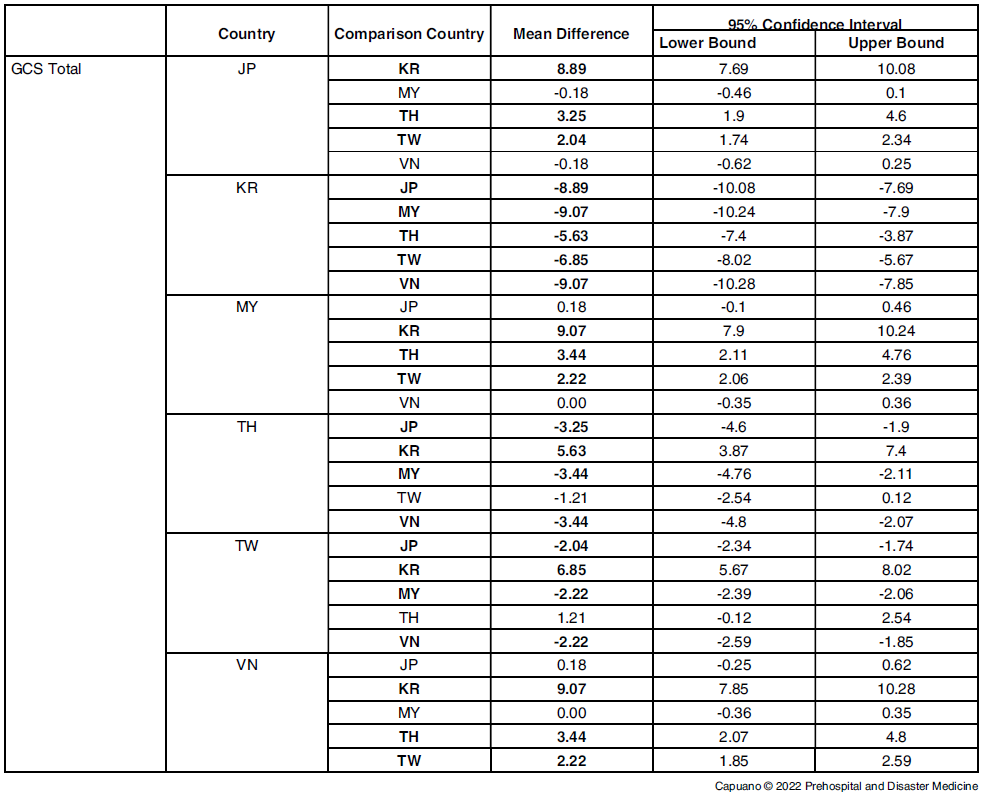
Note: Bolded values indicate statistically significant difference (P <.001).
Abbreviations: GCS, Glasgow Coma Scale; JP, Japan; KR, Korea; MY, Malaysia; TH, Thailand; TW, Taiwan; VN, Vietnam.

Figure 5. Mean GCS Total by Country.
Abbreviations: GCS, Glasgow Coma Scale; JP, Japan; KR, Korea; MY, Malaysia; TH, Thailand; TW, Taiwan; VN, Vietnam.
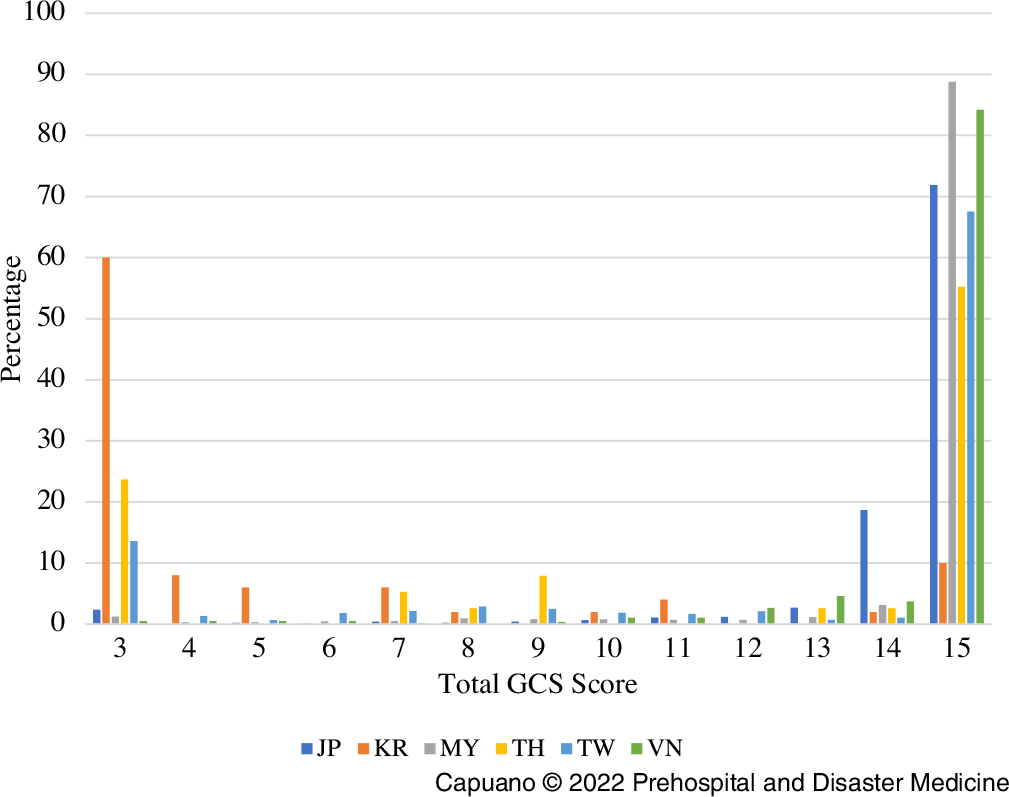
Figure 6a. Percentage of Each GCS Total Score Assigned by Country.
Abbreviations: GCS, Glasgow Coma Scale; JP, Japan; KR, Korea; MY, Malaysia; TH, Thailand; TW, Taiwan; VN, Vietnam.
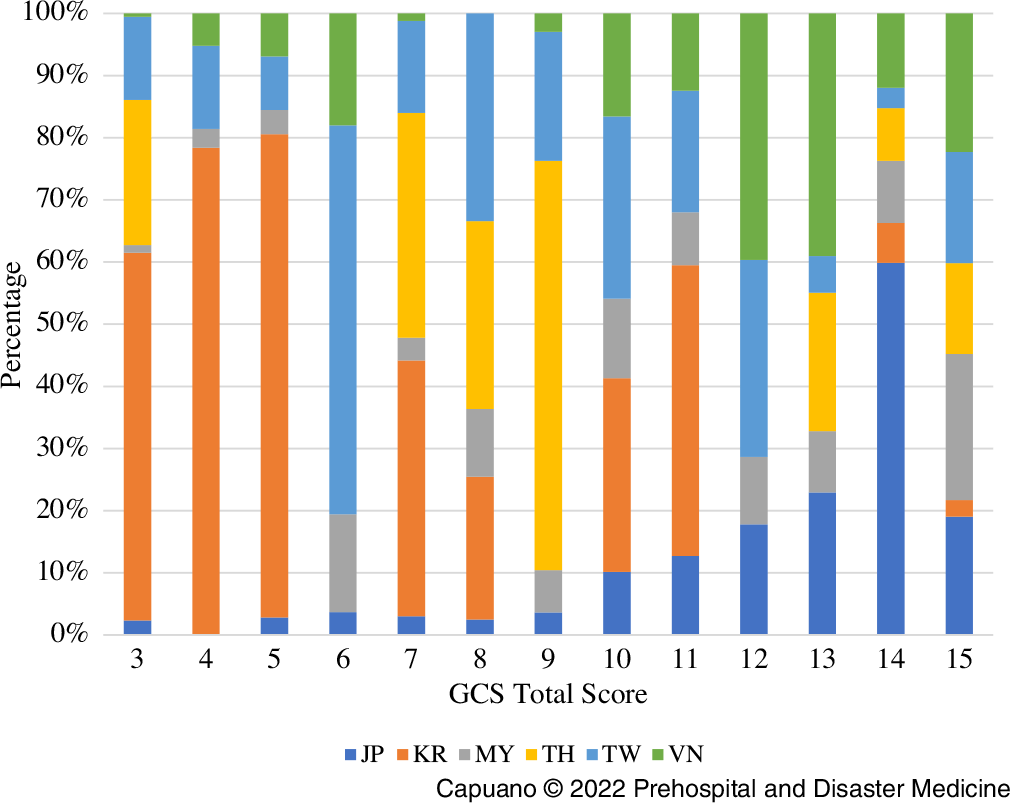
Figure 6b. Percentage of Each GCS Total Score Assigned by Country (Alternative).
Abbreviations: GCS, Glasgow Coma Scale; JP, Japan; KR, Korea; MY, Malaysia; TH, Thailand; TW, Taiwan; VN, Vietnam.
Discussion
The analysis of these six Asian countries demonstrates that there are statistically significant differences in the mean component and total GCS score assignments. There are several different ways that countries vary from each other: some differ significantly in one component score but not in total scores (eg, Taiwan and Thailand differ significantly in the “eye” category, but not in total); some countries differ significantly only in one category but not in total score (eg, Japan differs significantly from all other countries in the “verbal” category but not in other components or total score); some countries differ significantly from all other countries in every component and total (Korea).
What is perhaps the most important part of this analysis is the total score and how the countries differed in that category. The total score is important because it is ultimately what influences patient care. In the total score category, there are three distinct clusters of countries: Japan, Malaysia, and Vietnam assigned similar total scores to one another but differed significantly from all others; Thailand and Taiwan assigned similar scores but differed significantly from all others (lower average score assignment than Japan, Malaysia, and Vietnam and a higher average score than Korea); and Korea differed significantly in total score assignment from all other countries (lower average score assignment than all other countries).
What is important about these results is that they may demonstrate clinically as well as statistically significant differences in the way that total GCS scores are assigned across different countries. However, the analysis only explored whether these differences existed, not why they exist. That is an important future study, because determining the reason for these differences would help answer the question of whether the scale is being used in the same manner across countries; or perhaps, these different countries simply have different types of trauma populations from one another (eg, lower rate of helmet usage among motorcyclists); or perhaps, the scale is being used differently across countries and it is not the most objective metric in determining cognitive function in the acute setting.
Additionally, the clinical significance of these differences in score assignments across countries is not known. The fact that statistically significant differences exist in component and total GCS score assignments is important, but it is unclear if these differences are directly affecting patient care or outcomes.
Limitations
Limitations of this study mostly involved the dataset available. The dataset included at least twelve different countries that participated in PATOS and submitted data. However, only six countries submitted sufficient EMS GCS data to be included in the study. Several large countries, including China and India, did not provide enough EMS GCS data to be included. Having more data from more countries would make the analysis more robust. Additionally, the amount of GCS data provided from each country was not evenly distributed. Some countries submitted several thousand unique pieces of data while some submitted less than one hundred. Having more evenly distributed amounts of data might have improved this study. Lastly, there were incomplete data for other variables that would have allowed for secondary analyses to explore the possible reasons for the differences in GCS scores that were discovered. Variables such as Glasgow Outcomes Scale, which provides information on patient outcomes after traumatic brain injury, would have allowed for a correlation analysis between mean GCS scores in a given country and the average patient outcome. An analysis like this would have potentially given more insight into the question of whether these differences in mean GCS scores across countries represent real differences in the way the scale is being used. Seeing as the PATOS project is on-going, more data will likely become available in the future allowing these additional inquiries to be completed.
Conclusion
This study demonstrated that there are statistically significant differences in the mean component and total GCS scores across six countries in Asia. The reasons for these differences, and their clinical significance, require further exploration as more data become available from PATOS.
Conflicts of interest/funding
Dr. Cone is a non-compensated member of the PATOS Research Advisory Committee, and has been reimbursed by PATOS for travel expenses incurred in teaching at the annual PATOS Research Workshop in Seoul, Korea in 2015, 2017, and 2019. Poster presentation: National Association of EMS Physicians Annual Meeting, San Diego, California USA January 2020.


