INTRODUCTION
Currently, exports of Scotch whisky are worth over 4 billion pounds sterling ($4.9 billion) to the UK and in particular the Scottish economy, with the USA representing the industry’s largest market at 1.04 billion pounds sterling ($1.27 billion) in 2017 (Scotch Whisky Association 2019)
Scotch whisky takes two basic forms:
1. Single Malt Scotch Whisky: This is defined by law as whisky produced by batch distillation in a copper pot still, and made from 100% malted barley (C3 plant) and water. The process must be carried out within a single distillery and the spirit aged for a minimum of three years in oak barrels not exceeding 700 liters capacity.
2. Single Grain Whisky: This uses malted barley and other malted or un-malted cereals (often maize [C4 plant] but more recently, mainly wheat [C3 plant]). Distillation is carried out in a column still within a single distillery. Again, the spirit must be aged for a minimum of 3 years in oak barrels not exceeding 700 liters capacity.
Thereafter, two or more single malt whiskies from different distilleries can be mixed to produce blended malt whiskies. Similarly, grain whiskies from two or more distilleries can be mixed to produce blended grain whiskies.
The definition of Blended Scotch Whisky is a combination of one or more Single Malt Scotch Whiskies with one or more Single Grain Scotch Whiskies (Scotch Whisky Regulations 2009).
A major threat to the Scotch whisky industry is the production of fraudulent products that are now sold globally. These include: (i) mass produced alcohols of varying quality, purporting to be relatively recent Scotch whisky blends and (ii) individual bottles of what appear to be rare, single malt whiskies, purported to have been distilled between the 19th and mid-20th century, but are in fact very recently distilled products. The first is of significant interest to the distillers as it can result in a financial loss and damage to the brand image. The latter is of major importance to the collectors of rare malt whiskies and again, to the distillers, because of damage to the brand equity. The latter also has major consequences for auction houses and retailers where the sale of whiskies later found to be fake can have a major effect on their reputations. In addition, the private seller market, peer to peer on-line sales and the burgeoning rare whisky broker market can all be negatively impacted should operators be seen to sell “fakes”. In this way, consumer/buyer confidence is eroded.
In the UK, the number of bottles of rare Single Malt Scotch whisky sold at auction in 2018 increased by 28.9% to 107,890 as compared to 83,713 in 2017. Similarly, the total value of these auction sales rose by 62.7% to a record high of over 40 million pounds sterling ($49 million) (Rare Whisky 101 Annual Report 2018). The most expensive bottle of whisky sold during 2018 was a 1926 Macallan Valerio Adami, fetching 848,750 pounds sterling (>$1 million). From our results, this massively increasing interest in the purchase of these rare products as investments has resulted in an accompanying increase in the production of fraudulent products that are difficult to detect.
Over many years, the Scotch whisky industry and independent researchers have developed many techniques to fight counterfeiting operations and confirm the authenticity of Scotch whisky. These have taken many forms:
(a) the comparison of congener profiles of genuine Scotch whisky with those of counterfeit products (Aylott et al. Reference Aylott, Clyne, Fox and Walker1994). Congeners are the trace components formed during the fermentation and maturation processes that give a whisky its characteristic taste. For example, a combination of gas chromatography (GC) and high-performance liquid chromatography (HPLC) has been used to study the higher alcohol components in a range of blended Scotch samples. While the continuous distillation process employed in the production of grain whisky tends to recover congeners up to the volatility of iso-butanol, malt whiskies produce the same congeners as well as isoamyl alcohol and other higher boiling point compounds. The authors concluded that the isoamyl alcohol content could therefore be used to estimate the percentage of malt whisky in the blended Scotch. Furthermore, pyrolysis mass spectrometry was used to measure the higher alcohol profiles, together with cask-extractive and volatile phenolic congener concentrations to demonstrate that it was possible to identify different brands (Aylott et al. Reference Aylott, Clyne, Fox and Walker1994). Additional studies have used (i) GC to determine volatile congeners, (ii) gas chromatography–mass spectrometry (GC-MS) for trace congeners and (iii) HPLC to determine trace maturation congeners, using both the concentrations and concentration ratios of the major volatile congeners to determine authenticity. In addition, the absence of congeners known to be present in Scotch whisky, and abnormal congener profiles, were also used in the authenticity process (Aylott and MacKenzie Reference Aylott and MacKenzie2010).
(b) The use of near infra-red spectroscopy on an optofluidic chip has been proposed for monitoring the quality of single malt Scotch whisky (Ashok et al. Reference Ashok, Praveen and Dholakia2011). Using a partial least square calibration, the authors demonstrated that the alcohol content could be determined to within 1% of the true value. In addition, principal component analysis was used to classify whiskies based on their age, barrel type and whisky type (Ashok et al. Reference Ashok, Praveen and Dholakia2011). The authors demonstrated that (i) the Raman spectra of different-aged whisky from a single distillery could be determined due to changes in congener profile with age, where age is the length of time maturing in oak barrels, (ii) the type of barrel containing 10-year-old malt from a single distillery could be determined and (iii) whiskies from a range of distilleries could be differentiated, again based on the aromatic features of the samples.
(c) A proof-of-concept study using thermal conversion-isotope ratio mass spectrometry (TC/EA-IRMS) measured δ2H and δ18O in both the local source water used for whisky production and in the whiskies themselves (Meier-Augenstein et al. Reference Meier-Augenstein, Kemp and Hardie2012). The authors determined R2 values of 0.71 and 0.88 for δ2H and δ18O, respectively. Using a bivariate plot of values from genuine whiskies, the study confirmed the nature of several whiskies supplied by the Scotch Whisky Research Institute that were known to be counterfeit. 13C/12C ratios (δ13C) have also been used for authentication purposes. Typically, this is to detect the use of sugars deriving from C4 plants such as maize and sugar cane which give much higher δ13C values than C3 plants such as barley and wheat (Goodall et al. 2004).
The above discussion gives an indication of the range of techniques that have been used, and further information can be gained from more comprehensive reviews (Aylott Reference Aylott2013; Lachenmeier Reference Lachenmeier and Downey2016).
However, a major limitation of all the above methods is that none can provide information on the year of distillation. This is particularly important in relation to rare, very old and potentially extremely valuable single malt whiskies. A recent phenomenon is that old, genuine, empty malt whisky bottles are being purchased on-line and filled with relatively modern distilled spirits. The overall effect can be very realistic and in the absence of any dating technique, potentially difficult for the sector to identify, particularly if they are basing their interpretation on the packaging, i.e. the bottle, label and closure materials.
In recent years, the anthropogenic radiocarbon (14C) signal produced from atmospheric nuclear weapons testing that occurred in the 1950s and early 1960s has been useful as a dating tool for several important areas including:
(i) forensic science, to aid the accurate estimation of year of birth and death of human skeletal remains (Spalding et al. Reference Spalding, Buchholz, Bergman, Druid and Frisen2005; Cook et al. Reference Cook, Dunbar, Black and Xu2006, Reference Cook, Ainscough and Dunbar2015; Ubelaker and Parra Reference Ubelaker and Parra2011),
(ii) the time of harvest of illicit drugs such as opium and heroin (Zoppi et al. Reference Zoppi, Skopec and Skopec2004) and
(iii) the determination of wine vintages (Zoppi et al. Reference Zoppi, Skopec and Skopec2004) or wine adulteration (Lopes et al. Reference Lopes, Pinto and Almendra1975).
In the case of wines or spirits, this is particularly successful where the product was produced from a single year’s plant growth. In recent years, the SUERC Radiocarbon Laboratory has received many enquiries from individuals looking to obtain verification of whisky products. This prompted us to look seriously at this question. In addition, it was felt appropriate that a Scottish radiocarbon laboratory should take the lead in this research.
Until now, the determination of age has relied on comparing radiocarbon (14C) measurements made on the spirit against the bomb calibration curves within calibration programs such as OxCal (Bronk Ramsey Reference Bronk Ramsey2017) or Calib (Stuiver et al. Reference Stuiver, Reimer and Reimer2018). These have some disadvantages for estimating whisky ages, namely: (i) The existing calibration curves are produced from 14C measurements made on atmospheric CO2 and tree rings. However, as radiocarbon research expands, and measurement techniques become ever more precise, there have been suggestions of offsets in datasets on regional and even seasonal bases. (ii) Year of distillation of whisky can vary by up to two years after the year of barley growth and harvest (i.e. barley is not malted and mashed immediately and converted into spirit). Barley harvest is an annual occurrence, therefore, distillers must “stockpile” it to last them from harvest one year to the next. (iii) Some single malts may contain small volumes of an older vintage than its marketed age. (iv) Finally, it is rare that the Scotch industry uses virgin oak casks/barrels. The casks that are to be filled with malt whisky will contain residues from previous fills of alcoholic drinks such as bourbon and sherry. Discussions with representatives from throughout the industry put these volumes anywhere between 2 and 10 liters of “in drink” and of course this could have an influence on the apparent age of the malt.
Therefore, to provide confidence to the whisky industry that the age data we produce are accurate, it was felt important that a calibration curve was constructed using whiskies of known year of distillation. This removes any question of the relevance of the current bomb calibration data and any problems associated with “contamination” with another spirit of a different age. Here, we discuss the laboratory procedures for measuring the fraction of modern (F14C) values of ethanol derived from malt whisky samples for the construction of an extensive bespoke whisky calibration curve. We then present several cases in which F14C determination was crucial in determining the authenticity of what were purported to be bottles of old, very rare and potentially very valuable single malt whiskies.
MATERIALS AND METHODS
Small whisky samples of known distillation year, mainly from archives, were provided by a range of companies. These came from distilleries throughout Scotland; from the Western Isles and Orkney Islands and throughout mainland Scotland. They were further distilled to remove the bulk of the components that derive from the oak barrels in which they were matured and to concentrate the ethanol component. Samples in the form of new make spirit (high alcohol percentage and no maturation in oak barrels) required no distillation. 20 μL samples are placed in quartz tubes (comprising a 12 mm o.d. body and 6 mm o.d. stem) containing 0.5 g copper oxide and a small piece of silver foil and are pre-sealed at the 12 mm o.d. end. On addition of the spirit, each tube is connected to a vacuum line and immediately frozen using liquid nitrogen. The tube is opened to the vacuum line and pumped for a few seconds until a vacuum of 10–2 mbar is reached. It is then sealed using a glassblowing torch (Dunbar et al. Reference Dunbar, Cook, Naysmith, Tripney and Xu2016). The sealed tubes are placed in a furnace employing stepped temperature increments over several hours to a maximum of 850°C for 4 hr. When cooled, the tubes are cracked open within a vacuum line. Water vapor is trapped out in a spiral trap held at –80ºC using a mix of solid CO2 and ethanol. The CO2 is isolated using a further spiral trap held at –196ºC using liquid nitrogen. The solid sample CO2 is then pumped on to enhance the purity. Finally, the CO2 is allowed to sublime, and the total volume is measured. A 3 mL sub-sample is removed and converted to graphite using the method of Slota et al. (Reference Slota, Jull, Linick and Toolin1987).
The graphite from each sample is then pressed into an aluminium cathode for measurement by AMS using either our 5 MV Tandem Accelerator Mass Spectrometer or our 250 kV single stage AMS (SSAMS), both manufactured by National Electrostatics Corporation, Wisconsin. These spectrometers feature high intensity sputter ion sources that receive samples sequentially from wheels of up to 134 graphite samples, including primary, secondary and background standards. Since measurements of such large numbers of samples can last several days, our procedures must cope with potential changes in measurement conditions. To allow for this, samples are measured to completion in groups of 10 in only a few hours, with Oxalic Acid II primary standards spanning groups to check inter-group consistency. Each group of 10 samples typically contains: (i) one Oxalic Acid II primary standard, (ii) one humic acid secondary standard of less than one half-life in age (used in the Sixth International Radiocarbon Inter-comparison as SIRI Sample N, with a consensus F14C value of 0.657 ± 0.0042) (Scott et al. Reference Scott, Naysmith and Cook2017), (iii) either a modern secondary standard material from the Third International Radiocarbon Inter-comparison (TIRI Sample A which is a barley mash from the whisky industry with a consensus F14C value from the study of 1.1635 ± 0.0084 (Scott et al. Reference Scott, Naysmith and Cook2018) or a background standard (interglacial wood, infinite age bone or geological carbonate depending on the type of unknowns being measured), and (iv) 7 unknown age samples. In addition, when undertaking whisky analyses, we also include a graphite sample synthesized from a 2007 new make spirit sample and a background graphite made from kerosene.
The rapid analysis of groups of 10 is relatively insensitive to longer-term drifts and changes are quickly apparent in the repeat measurements of individual samples, including primary and secondary standards. Each sample is automatically measured within its group of 10 until the total counting statistics and the scatter of the repeat 14C/13C measurements exceeds a quality threshold of 2.5‰. Under these circumstances, operator intervention to adjust the spectrometer or to change sample measurement parameters can be fast. Finally, time trends remaining in the completed data sets can be compensated for in subsequent data reduction and normalization. Following data reduction, F14C values are calculated. Mean secondary standard activities are compared to the consensus values from the inter-calibration studies to check the accuracy of the data. The standard deviations on the secondary standards data are used to inform the precision on the whisky sample measurements.
A further 1 mL sample of CO2 is taken for stable carbon measurement using a VG SIRA 11 isotope ratio mass spectrometer. The 13C results are expressed using the δ notation (Craig Reference Craig1957) as per mil deviations from the VPDB standard, with 1σ precision of ± 0.1‰. CO2 samples from secondary standards are also prepared and measured daily to verify the quality of the data. The δ13C values are used for offline normalization of sample 14C/13C ratios in 14C activity calculations. They can also provide certain information on the type of whisky being analyzed and in the case of malt whiskies, which are made solely from barley, they can help distinguish between spirits distilled early within the nuclear era and much more recent distillations.
RESULTS AND DISCUSSION
In this study, for calibration curve construction, we are determining the sample’s activity at the year of distillation, or more correctly, the year of barley growth/death, and hence the absolute F14C value is determined (Abs F14C). This requires the OXII standard to be corrected for radioactive decay between 1950 and the year of measurement. Also, the sample’s activity must be corrected for decay between year of production and year of measurement as follows:
F14C values were determined for the ethanol content of 221 single malt whisky and new make spirit samples where the year of distillation was known and ranged between 1950 and 2015. Known-age whiskies of pre-1950s distillation year are very rare and so we have used the available five-year span data between 1850 and 1950 from IntCal13 to cover this period but with an offset as described below. Taken together, these data provide a calibration curve covering almost the entire time period within which bottled whiskies might be produced and against which the distillation year of unknown age, single malt whiskies could be determined.
Because of the nature of 14C variations during the pre-1950 period, it is not possible to achieve the precision that is obtainable from the nuclear era. Nevertheless, we are currently attempting to obtain barley samples of known growing season from 1850 onwards. These come from a UK-held research resource and are a reasonable substitute for the actual whisky and would enable us to produce a single-year calibration.
In terms of the F14C calculations based on the analysis of the known age samples, we must assume that year of barley growth and year of distillation are the same although in practice, a difference of up to 2 years is feasible. Thus,
 $$ {F^{14}}C = {{\left( {{{14} \over {13}}} \right)W \times \left[ {1 - \left( {25 + {\delta ^{13}}{C_W}} \right)/1000} \right]} \over {0.7459 \times \left( {{{14} \over {13}}} \right)OXII \times \left[ {1 - \left( {25 + {\delta ^{13}}{C_{OXII}}} \right)/1000} \right]}} = {{14 \over 13}_{WN} \over {14 \over 13}_{ON}}$$
Where:
 $ \left( {{{14} \over {13}}} \right)W$ = 14C/13C atom ratio in the whisky sample
- $ {\delta ^{13}}{C_W} = {{{R_W} - {R_{STD}}} \over {{R_{STD}}}} = {{{R_W}} \over {{R_{STD}}}} - 1$ where R is the 13C/12C atom ratio in the whisky (W) and VPDB primary standard (STD)
- $ \left[ {1 - \left( {25 + {\delta ^{13}}{C_W}} \right)/1000} \right] $ = 14C fractionation correction on the whisky relative to -25‰
- $ \left( {\frac{{14}} \over {{13}}} \right)OXII$ = 14C/13C atom ratio in the Oxalic Acid II primary standard
- $ {\delta ^{13}}{C_{OXII}} = {{{R_{OXII}} - {R_{STD}}} \over {{R_{STD}}}} = {{{R_{OXII}}} \over {{R_{STD}}}} - 1$ where R is the 13C/12C atom ratio in the Oxalic Acid II primary 14C standard (OXII) and the VPDB primary standard (STD)
- $ \left[ {1 - \left( {25 + {\delta ^{13}}{C_{OXII}}} \right)/1000} \right]$ = 14C fractionation correction on the OXII primary standard relative to -25‰


hence
- ${{14} \over {13}}$WN is the fractionation corrected (normalized) ratio of 14C/13C atoms in the whisky and;
- ${{14} \over {13}}$ON is the fractionation corrected (normalized) ratio of 14C/13C atoms in the OXII primary standard


Thereafter, allowance is made for decay of the 14C in the Oxalic Acid II standard between 1950 and the year of measurement. Allowance is also made for 14C decay in the whisky sample between the year of distillation (as a proxy for barley growth) and the year of measurement. These corrections enable us to calculate the absolute F14C value as follows:
 $$ Abs {F^{14}}C = {{{{{{14} \over {13}}}_{WN}}{e^{\lambda \left( {y - x} \right)}}} \over {{{{{14} \over {13}}}_{ON}}{e^{\lambda \left( {y - 1950} \right)}}}}$$
where λ = decay constant for 14C, based on its true physical half-life of 5730 years:
 $$\lambda = {{{\rm{ln}}\left( 2 \right)} \over {5730}}{y^{ - 1}}$$
hence
 $$ Abs{F^{14}}C = {{{{14} \over {13}}WN \times {e^{\left( {1950 - x} \right)}}} \over {{{14} \over {13}}ON}}$$
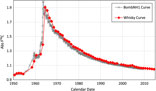
These results are presented in Figure 1. In each year for which we had more than one sample, which was most, a weighted mean value was calculated and plotted. The AbsF14C values give a shape that is very close to that of the northern hemisphere (NH1) bomb curve (Hua et al. Reference Hua, Barbetti and Rakowski2013), which is based on atmospheric CO2 and tree-ring measurements (the NH1 curve is also illustrated in Figure 1). The exception is that the NH1 curve shows much more detail due to measurements being made on a sub-annual basis. Also, there is an offset between the two curves of around one year as the year of barley growth and the year of distillation will vary, as discussed above. An important point to note is that the offset is consistently around one year and so the effects of any “in drink” from the previous fill, and indeed any other potential problems, appear to be negligible.

Figure 1 Close correspondence in the absolute F14C values of the ethanol component of malt whisky, (i.e. from year of distillation) and the Northern Hemisphere (NH1) Bomb Curve showing a ca. 1-year offset, consistent with the time between barley harvest and distillation.
Figure 2 illustrates the variation in stable carbon ratios (13C/12C ratio) of the ethanol distilled from the whisky samples, expressed as δ13C values. Here, a general trend of decreasing δ13C values can be observed between the 1950s and present day as a result of fossil fuel burning. There is scatter in the data that will reflect different climatic conditions as, in the past, some barley has been sourced from outside of Scotland, including the rest of the UK, Europe and even Australia. However, the data are useful when determining whether a sample derives from the mid to late 1950s or from post-2000, which is often critical to the conclusion regarding distillation year. In comparison, δ13C data from southwest Scotland on oak (Quercus robur) latewood cellulose shows a similar but reduced trend from a maximum value of ca. –25‰ in 1950 to ca. –28‰ in 2000 (Loader et al. Reference Loader, Santillo, Woodman-Ralpha, Rolfe, Hall, Gagen, Robertson, Wilson, Froyd and McCarroll2008). In this instance, the authors are dealing with a very long-lived species from a single geographic location that forms its latewood cellulose over a number of weeks.

Figure 2 Variation of δ13C values of ethanol distilled from whisky by year of production. Values are for whiskies appearing in Figure 1 that derive from distilleries throughout mainland Scotland and its neighboring islands.
Table 1 presents results for the 14C measurements on a range of whiskies purported to have been distilled over the last ca. 150 years. These were submitted to the laboratory from private individuals [3], an auction house [1], and a limited company [4]. The samples were prepared and measured as described above and their calibrated age ranges determined using the whisky calibration curve. All results for these are given as F14C values as the year of distillation is regarded as unknown. The difference between AbsF14C and F14C is small and does not significantly influence the calculation.
Table 1 Radiocarbon (F14C) and stable isotope (δ13C) results for a range of whisky samples

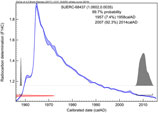
The Talisker 1863 has an F14C value of 1.0602 ± 0.0035, immediately indicating that the alcohol was derived from grain grown within the nuclear era, i.e. post-1955 distillation. Therefore, this whisky, as portrayed on the label, is fake. Calibration produces two possible age ranges; 1957–1958 or 2007–2014 (Figure 3). The δ13C value for the ethanol distilled from the whisky (–26.0‰) is indicative of the later range being the true age (see Figure 2).

Figure 3 Calibration of the Talisker whisky sample (Laboratory code: SUERC-68437 and F14C value = 1.0602 ± 0.0035) with a purported year of distillation of 1863. Calibration is against the Whisky curve using OxCal 4.3.2 (Bronk Ramsey Reference Bronk Ramsey2017).
The Tobermory ca. 1880 has an F14C value that is consistent with alcohol from the distillation of malted grain grown prior to 1955. Calibration does include the period from 1834–1878, which is consistent with the purported age. This is currently the best estimate that can be produced from a 14C measurement.
The Laphroaig 1903 has an F14C value of 1.0470 ± 0.0031. Again, this immediately informs us that this alcohol was distilled from malted grain that was grown during the nuclear era and that the product is fake. Calibration puts the year of distillation as either 1957–1958 or post-2011 (Figure 4). However, the δ13C value for the ethanol distilled from the whisky (–25.6‰) is indicative of the later distillation period being the true age (see Figure 2).

Figure 4 Calibration of the Lagavulin whisky sample (Laboratory code: SUERC-75787 and F14C value = 0.9780 ± 0.0031) with a purported year of distillation of ca. 1920. Calibration is against the Whisky curve using OxCal 4.3.2 (Bronk Ramsey Reference Bronk Ramsey2017).
Like the Tobermory ca. 1880, the Lagavulin ca. 1920 has an F14C value significantly <1, which is consistent with distillation of malted grain grown prior to 1955. It calibrates to pre-1821–1889 or 1913–1954, with the latter range being consistent with the purported age, albeit a rather imprecise estimate.
The Ardbeg 1964 has an F14C value of 1.1192 ± 0.0023 which calibrates to 1958–1959 or 1995–2000 or 2003–2004. It is most unlikely that a whisky distilled significantly earlier than 1964 would be sold as 1964 vintage as it would be significantly more valuable. Indeed, the δ13C value for the ethanol distilled from the whisky (–26.4‰) is indicative of barley grown much later, i.e. post-1995 (see Figure 2).
The Tormore 1966 has an F14C value of 1.8535 ± 0.0040 and calibrates to between 1964 and 1966. The δ13C value for the ethanol distilled from the whisky (–23.5‰) is consistent with values for that period (see Figure 2). Therefore, this is a genuine product. This is illustrated in Figure 5 as an example of what can be determined within the post-1955 period.
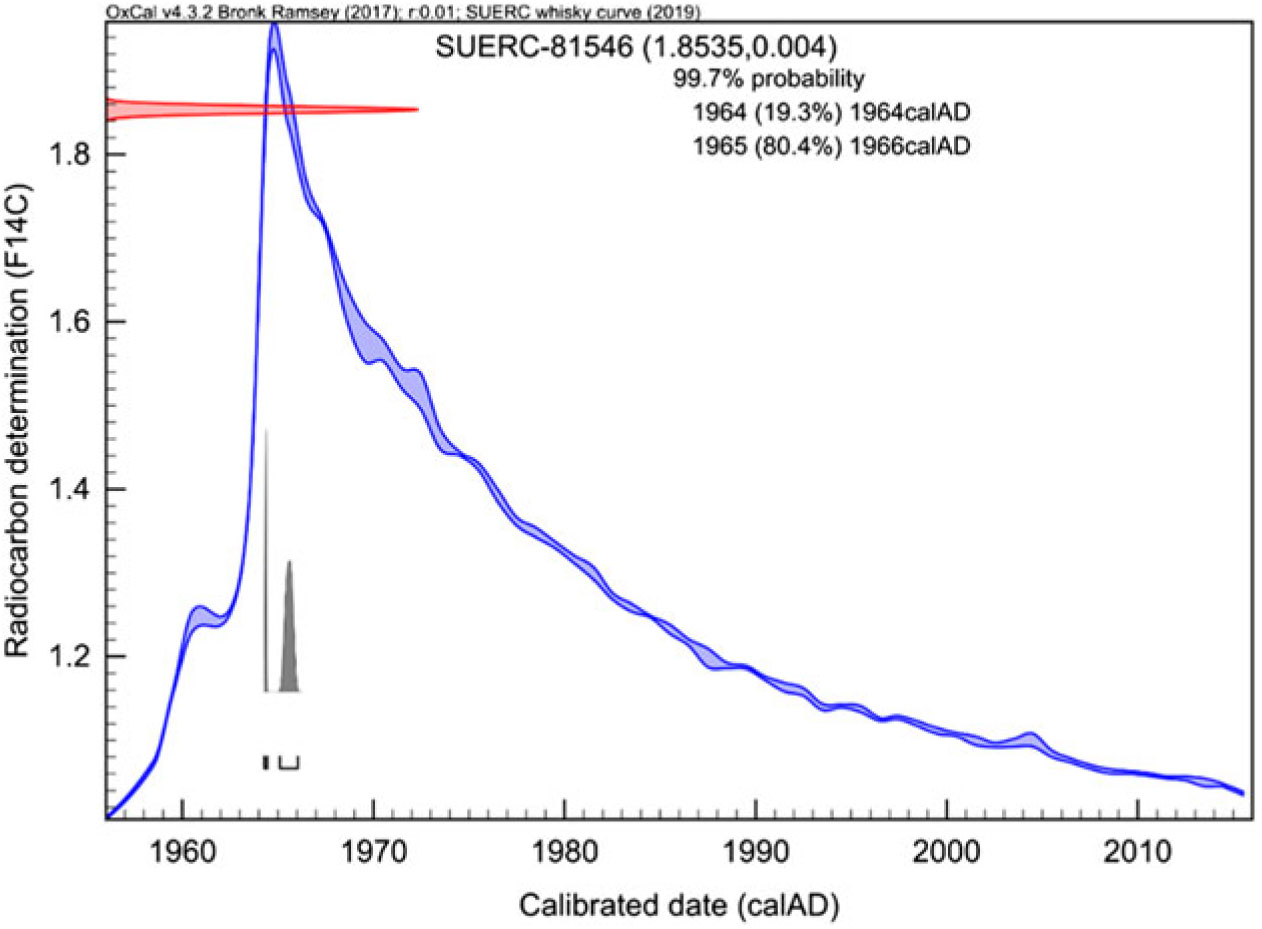
Figure 5 Calibration of the Tormore whisky sample (Laboratory code: SUERC-81546 and F14C value = 1.8535 ± 0.0040) with a purported year of distillation of 1966. Calibration is against the Whisky curve using OxCal 4.3.2 (Bronk Ramsey Reference Bronk Ramsey2017).
The Cask Reserve 1978 has an F14C value of 1.3258 ± 0.0023, which calibrates to 1963 or between 1978 and 1981, demonstrating that this is genuine.
Finally, we analyzed a sample of what was purported to be 1847 Baker’s Rye Whiskey for a contact in the USA. The ethanol had a δ13C value of –17.8‰ which is entirely consistent with a whiskey made from a mix of C3 and C4 grain (rye and corn [maize], respectively). The F14C value is <1, consistent with pre-1955 distillation and calibration includes a range of 1833–1889, which is consistent with the 1847 distillation date, albeit an imprecise estimate.
CONCLUSIONS
Rare, early, single malt Scotch whiskies have become much sought-after products, initially by connoisseurs and collectors and now often acquired as alternative investments. For context, there were 265 bottles sold in UK auctions last year that fetched at least 10,000 pounds sterling ($12,100) per bottle. While analysis of nuclear-aged materials, including spirits, is not new, we have taken the discipline to a new level for whisky by creating a specific calibration curve (1950–2015) using single malt whisky and new make spirit samples of known distillation year. This removes any question of the relevance of the current IntCal13 NH1 “bomb curve” that is created from 14C measurements made on single-year tree rings and atmospheric CO2. The curve is, on average, one-year offset from the IntCal NH1 curve and we attribute this to the fact that there is a ca. one-year delay between harvesting of the barley and the malting/distillation processes. This one-year offset also demonstrates that the influence of any residual liquid of a potentially different age, derived from the previous filling of the casks, must be insignificant. In combination with a trend in the stable 13C/12C isotope ratio (δ13C) with time, due to fossil fuel burning, the use of radiocarbon measurements is providing an invaluable tool for identifying fraudulent products (of course, the stable isotope trend also has wider applications for studying the influence of fossil fuel burning on our atmosphere). Our experiences have suggested that there are a significant number of fake products being sold (approaching 50% of our analyses). The results outlined here are typical of the samples that are analyzed, and with the additional use of δ13C data, in many cases we can estimate the age of post-1955 whiskies to within 1–3 years. We are unable to provide the same precision for pre-1950s products but are actively seeking samples of annually grown barley from 1850 onwards, which may allow us to provide better precision than is currently possible. Finally, it should be borne in mind that the use of δ13C values as an indicator of whether a whisky derives from the early nuclear era or a much later period is confined only to malt whiskies that are made solely from barley (C3 plant). This cannot be applied to other forms of whisky that may be a mix of C3 and C4 grains.
ACKNOWLEDGMENTS
The authors thank Diageo plc, Edrington and Rare Whisky 101 for the provision of whisky samples. Thanks are also due to the staff of the SUERC AMS and Radiocarbon Laboratories for technical support. This research was not supported by any external funding.