INTRODUCTION
The White Sea is the northern distribution boundary for a number of European boreal species that are sensitive to environmental change (Holt & Keitt, Reference Holt and Keitt2005), and particularly sensitive to climate fluctuations (IPCC, Reference Field, Barros, Dokken, Mach, Mastrandrea, Bilir, Chatterjee, Ebi, Estrada, Genova, Girma, Kissel, Levy, MacCracken, Mastrandrea and White2014). Pressure on biota from anthropogenic factors, such as industrial pollution, shipping and fisheries, is very weak in this sea and likely does not affect ecosystem functioning (Filatov & Terzhevik, Reference Filatov and Terzhevik2007). Therefore, most changes in White Sea biota can be attributed to natural factors.
One recent change is the rapid growth of the three-spined stickleback Gasterosteus aculeatus (Linnaeus, 1758) population (Lajus et al., Reference Lajus, Ivanova, Shatskikh and Ivanov2013b). Three-spined sticklebacks are widely distributed in the northern part of the Atlantic and Pacific Oceans (Berg, Reference Berg1949; Miller & Hubbs, Reference Miller and Hubbs1969; Amaoka & Haruta, Reference Amaoka and Haruta1972; Bell, Reference Bell and Turner1984). Although numerous in the early 1930s, White Sea sticklebacks gradually declined and became rare during the 1960–1990s. Since the late 1990s, however, stickleback abundance has increased again. Now it approaches maximum historical densities and is likely the most numerous fish in this sea (Lajus et al., Reference Lajus, Ivanova, Ivanov, Shatskikh, Nemova, Murzina and Mescheriakova2013a, Reference Lajus, Ivanova, Shatskikh and Ivanovb). Sticklebacks are representative of a boreal species complex and changing climate is probably a key factor causing the observed growth in the White Sea population (Lajus et al., Reference Lajus, Ivanova, Shatskikh and Ivanov2013b; Lefébure et al., Reference Lefébure, Larsson and Byström2014).
Rapid increase in a numerous species should noticeably alter local food webs in coastal and pelagic communities. Sticklebacks play an important ecological role in the White Sea. Along with herring, they form the so-called ‘wasp waist’ of the ecosystem, in which a few species of small pelagic fish control a majority of the energy flow between more diverse upper and lower trophic levels: predatory fishes and birds, and zooplankton (Cury et al., Reference Cury, Bakun, Crawford, Jarre, Quinones, Shannon and Verheye2000; Bakun, Reference Bakun2006; Fauchald et al., Reference Fauchald, Skov, Skern-Mauritzen, Johns and Tveraa2011). Given their position in food webs, the dynamics of wasp-waist species are especially informative for understanding the dynamics of the entire ecosystem. Therefore, studying the White Sea three-spined stickleback population may not only reveal the effects of climate change on this species, but also help develop a climate model for the marine ecosystem as a whole. Climate may affect stickleback populations directly by increasing their fitness and performance (Lefebure et al., Reference Lefebure, Larsson and Bystrom2011), or indirectly via widening their niche in terms of habitat or food resources (Lefébure et al., Reference Lefébure, Larsson and Byström2014).
Despite the large body of literature on the feeding ecology of massive pelagic fishes (Dalpadado et al., Reference Dalpadado, Ellertsen, Melle and Dommasnes2000; Mollmann et al., Reference Mollmann, Kornilovs, Fetter and Koster2004; Prokopchuk & Sentyabov, Reference Prokopchuk and Sentyabov2006), information on stickleback feeding habits is scarce (Wootton, Reference Wootton1984; Ziuganov, Reference Ziuganov1991, Lankov et al., Reference Lankov, Ojaveer, Simm, Pöllupüü and Möllmann2010), especially for juveniles (but see Swarup, Reference Swarup1958; Hangelin & Vuorinen, Reference Hangelin and Vuorinen1988; Short et al., Reference Short, Metaxas and Daigle2013). Understanding juvenile feeding behaviour is important because the early life stages of fish are known to be critical in determining overall population size, and might be even be more relevant for species like sticklebacks, where juveniles and adults occupy different habitats.
In the White Sea, sticklebacks spawn in shallow areas, preferring seagrass beds (Shatskikh et al., Reference Shatskikh, Lajus and Ivanova2010; Lajus et al., Reference Lajus, Ivanova, Ivanov, Shatskikh and Maksimovich2011) where juveniles live for several weeks before migrating offshore to winter in deeper places (Mukhomediarov, Reference Mukhomediarov1966). In these locations, other species of similar trophic status are absent (Lajus et al., Reference Lajus, Ivanova, Ivanov, Shatskikh and Maksimovich2011), and sticklebacks reach relatively high densities, up to 3000 ind. m−2 (E. Shatskikh, T. Ivanova, unpublished data). The short warm season is crucial for juvenile survival and growth in the subarctic zone, where the winter is cold and long. However, knowledge of juvenile feeding during this critical period is limited (but see Abdel-Malek, Reference Abdel-Malek1968), particularly knowledge of changing phenology or prey electivity due to individual growth or seasonal conditions.
The main goal of this study is to analyse relationships between potentially available food and the stomach contents of juvenile sticklebacks during their early ontogenesis in seagrass beds. We tested the following hypotheses: (i) juveniles do not select prey organisms by species and size, i.e. food electivity is absent, (ii) the prey composition of juveniles changes during growth.
MATERIALS AND METHODS
Study site and field sampling
Samples were collected during August–September, 2011–2013, over 10-day intervals in the Seldianaya Inlet of Kandalaksha Bay, on the White Sea (66°20′14.5″N 33°37′27.8″E). For analysis, sampling dates were standardized as sequentially numbered weeks, the first week being 21–27 July (Table 1).
Table 1. Sampling dates over different years showing the correspondence between dates and sequential week numbers

The Seldianaya Inlet (2 m deep in high tide and 0.5 m in low tide) has dense eelgrass Zostera marina (Linnaeus, 1753) beds where sticklebacks intensively spawn. It also supplies a congenial habitat for juveniles. Sampling was performed during low tide with a 7.5 m-long beach seine with wings 1.5 m high, a mesh-size of 5 mm on the wings and 1 mm on the top. Three groups of sticklebacks per sampling date, 10 specimens in each, were selected for analysis: (a) small, with body length 9–14 mm, (b) medium, 15–20 mm, and (c) large, > 21 mm. When fewer fish were collected in each group, all specimens were analysed together. The maximum length of juveniles in our study was 27 mm. Specimens were fixed with 4% formaldehyde. The percentage of different size groups in a sample was estimated at each sampling site.
When collecting fish, we simultaneously sampled zooplankton and the benthos to analyse the density of food organisms. Zooplankton samples in one replicate were collected in 2012 and 2013 with a plankton net (size 93 μm) by filtering 100 L of surface water (Vinberg, Reference Vinberg1984). The benthos was sampled in two replicates using three angular scrapers with gripping width of 0.15 m towed for 0.5 m (McIntyre & Eleftheriou, Reference McIntyre and Eleftheriou2005). In total, 14 planktonic and 28 benthic samples were analysed.
Sample processing
Stickleback body length was measured using a ruler accurate to 0.5 mm. Food organisms from stomachs (n = 432) were identified to the lowest possible taxonomic rank (usually species or genus) and counted (N). The best-preserved specimens (up to 10) were measured with a micrometer eyepiece scale (up to 0.03 mm) for additional calculations of their biomass, which was estimated as a sum of weights based on allometric equations (Chislenko, Reference Chislenko1968; Balushkina & Vinberg, Reference Balushkina, Vinberg and Vinberg1979) or ready-average mass (Pertzova, Reference Pertzova1967). We also weighed unidentified stomach contents (up to 0.05 mg). In the benthos samples, we counted larvae of Orthocladiinae (subfamily of family Chironomidae) in 2011–2013 and Oligochaeta in 2013. During the entire period of study, these two taxa predominated in fish stomachs. Population densities were calculated for plankton (ind. m−3) and benthic species (ind. m−2), and prey species were numbered to facilitate analysis.
We examined the role of a particular prey item in the feeding patterns of juveniles using its frequency of occurrence (F) and relative wet mass (I i) (Hyslop, Reference Hyslop1980). Frequency of occurrence was estimated as
where N i is the number of fish with food category i in their stomachs and N the total number of analysed fish; and relative wet mass estimated as
where S i is the mass of food category i and S t is the total stomach content mass.
Feeding patterns were visualized using Costello graphics (Costello, Reference Costello1990).
The effect of two factors – inter-annual variability (Year), and length of fish (Size) on the relative wet mass (I i) of major prey organisms was studied using Kruskal–Wallis ANOVA (KW). We also performed homogeneity of variances tests (Levene's test) for these prey components. In some cases, factors affected the magnitude of variance without affecting the mean, and differences in variance revealed different feeding patterns.
In addition to Year and Size we studied the seasonal dynamics of stomach contents using correlations between prey abundance during August and relative wet mass (I i). Correlations were analysed separately for 2012 and 2013 using Spearman's coefficient, excluding, however, the smallest size group of fish (<14 mm), which were absent in late August. The significance of seasonal variation in the main planktonic and benthic prey organisms was determined using Kruskal–Wallis ANOVA.
Selectivity of feeding was characterized by the formula (Ivlev, Reference Ivlev1961; Wootton, Reference Wootton1984):
where E is the electivity index, r i is the proportion of prey species i in fish stomachs, and p i is the proportion of prey species i in the sea.
Possible values for the index vary from −1 to +1, with positive values indicating preference for prey type i and negative values indicating avoidance or inaccessibility (Ivlev, Reference Ivlev1961; Wootton, Reference Wootton1984). To test whether the feeding selectivity of a series of samples is positive or negative, we compared the number of positive and negative electivity indices using the sign-test. Food selectivity was estimated for planktonic organisms, but not for benthic organisms, because total benthic biomass available in the environment was not measured or estimated.
Box and whisker plots in this paper demonstrate the mean, SE and 95% confidence interval. All statistical analyses were performed using Statistica 7.0.
RESULTS
Zooplankton and zoobenthos composition and abundance in the sea
The copepods Temora longicornis (Müller, 1785), Microsetella norvegica (Boeck, 1865) and cladoceran Podon leuckarti (Sars, 1862) formed a dominant group of zooplankton species, present in all years in high abundance. A subdominant group showed large fluctuations, with alternating periods of high and low abundance – this group was comprised of the copepods Centropages hamatus (Lilljeborg, 1853), Oithona similis (Claus, 1866), and Ciliophora Helicostomella subulata (Ehrenberg, 1833; Jörgensen, 1924). This second group of plankton species was very abundant in 2012 but only rarely found in 2013 (Table 2). Abundance of M. norvegica significantly differed among years during August (KW, P = 0.0400) showing peaks in 2012 (Table 2).
Table 2. Density (ind. m−3) of the most abundant zooplankton species in the Seldianaya Inlet in 2012 and 2013. (Date (week) corresponds to Table 1.)

In benthos samples, Orthocladiinae density was higher in early and mid-August in 2011 and 2013 than in 2012 (Kruskal–Wallis ANOVA, P = 0.0239; Table 3). However, it decreased in late August in all years (Kruskal–Wallis ANOVA, P = 0.0038). Oligochaeta density increased during August (Spearman correlation coefficient (Rs = 0.9, P < 0.05, Table 3).
Table 3. Density of benthic organisms (ind. m−2) in the Seldianaya Inlet in 2011–2013. (Date (week) corresponds to Table 1.)

SE, standard error.
Diet composition of juveniles
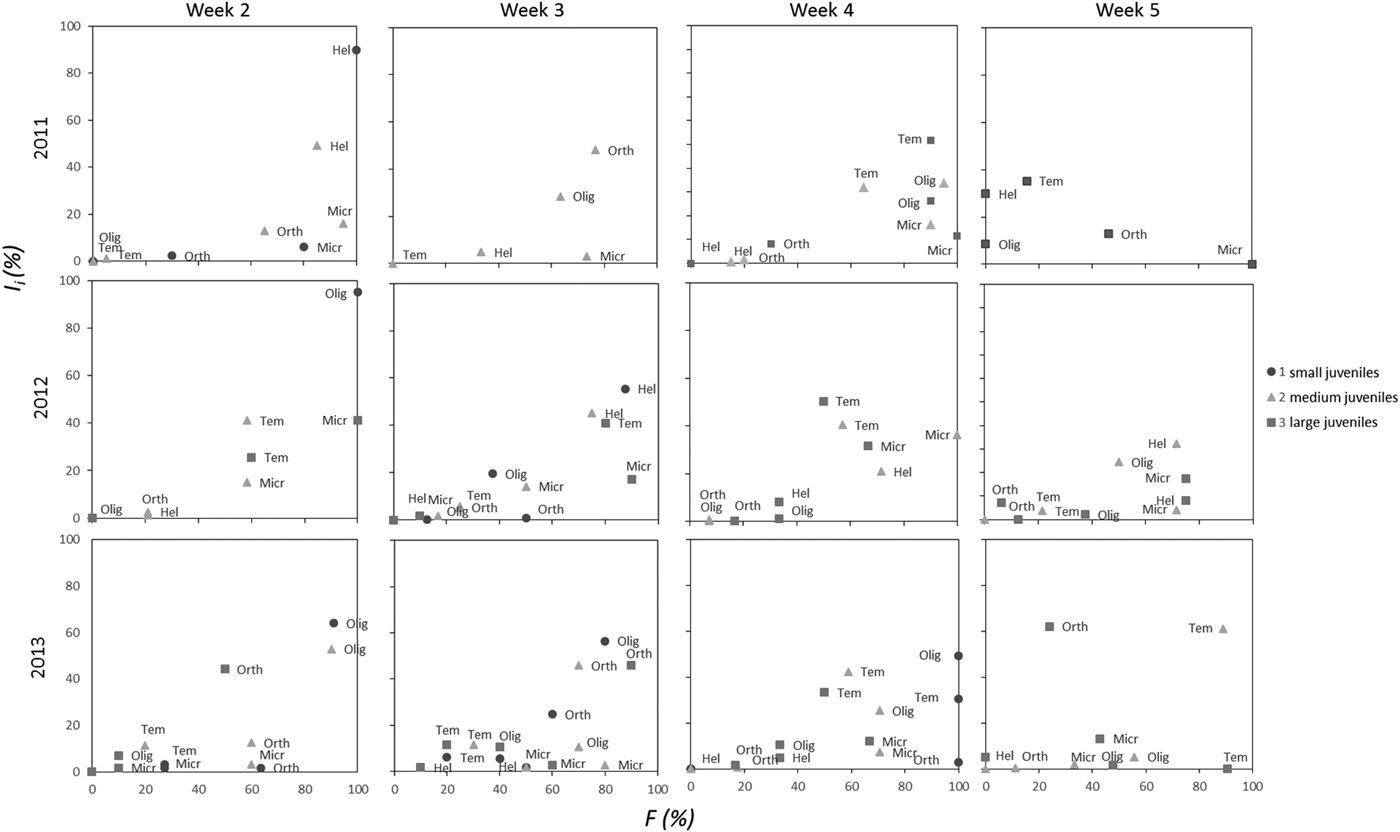
Dominant taxa in the stomachs were T. longicornis, M. norvegica, Orthocladiinae, Oligochaeta and H. subulata, together accounting for more than 50% of the biomass of food and appearing in more than 40% of stomachs (Figure 1). In addition, organisms such as P. leuckarti, copepod nauplii, Evadne nordmanni (Loven, 1836), and others were often present in the stomachs, each comprising on average 1–10% of I i and not exceeding 30–50% of the total stomach contents. F and I i for the five main food objects are presented in Costello-plots (Figure 1). Notably, some potential food organisms that are common in the sea, such as C. hamatus and O. similis, were not found in the stomachs.

Fig. 1. Seasonal changes of Costello-plots (frequency of occurrence F and relative wet mass of stomach contents I i) for different size groups of juvenile stickleback in different years.
INTER-ANNUAL DIFFERENCES
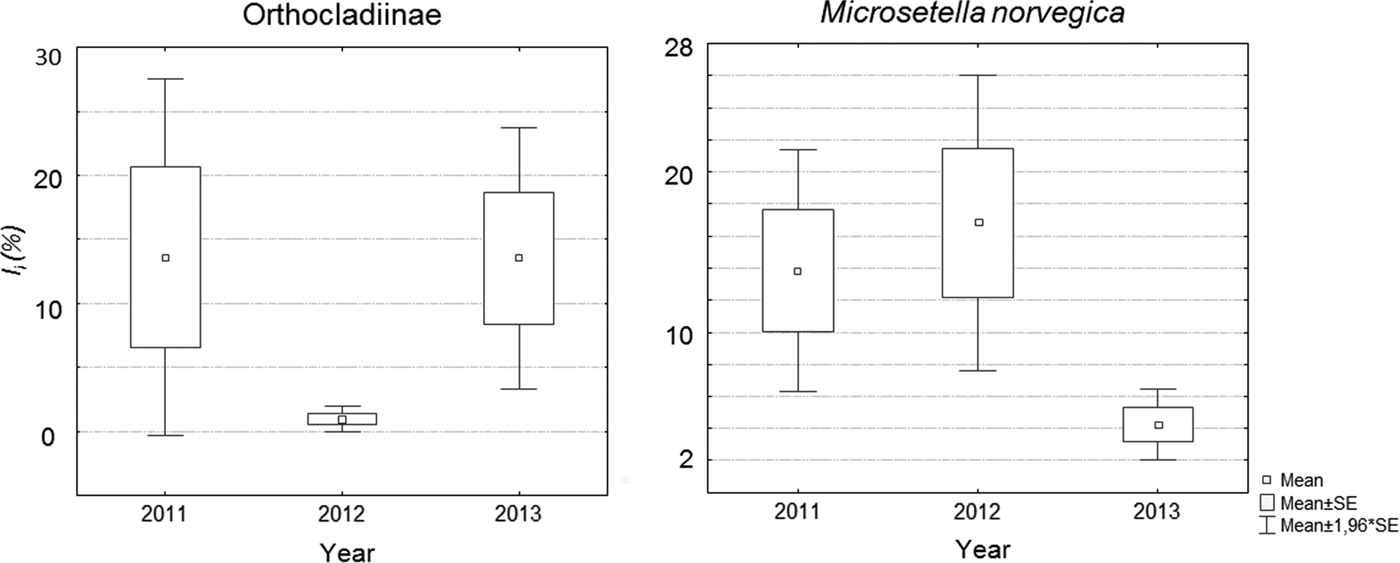
Inter-annual variation was pronounced in three of five major food taxa: Orthocladiinae, M. norvegica and H. subulata. We found a lower occurrence of Orthocladiinae in stomachs in 2012 (1–25%) in comparison with 2011 and 2013 (37–56%) (Figures 1 & 2). I i differed across years in a similar way (Table 4). Microsetella norvegica, on the contrary, were more frequent in 2011 and 2012, than in 2013 (75–90% and 46–53%, respectively; Figure 1). In this species we also found significant inter-annual variability in I i (Table 4, Figure 2). Finally, the contribution of H. subulata to food biomass (I i) decreased from 33% in 2012 to <5% in 2013 (Figure 1).

Fig. 2. Average values of I i observed in different years for Orthocladiinae and M. norvegica.
Table 4. Significance of effect of Year and Size on I i for most important prey organisms (results of Kruskal–Wallis ANOVA are presented). Significant (P < 0.05) correlations are in bold.

INFLUENCE OF FISH SIZE
Predictably, the percentage of larger size groups of juveniles increased with time: in early August small fish comprised about 70% of the population with the rest represented mostly by medium fish, in late August medium and large fish were about the same percentage, and only large fish exceeding 21 mm were observed in September.
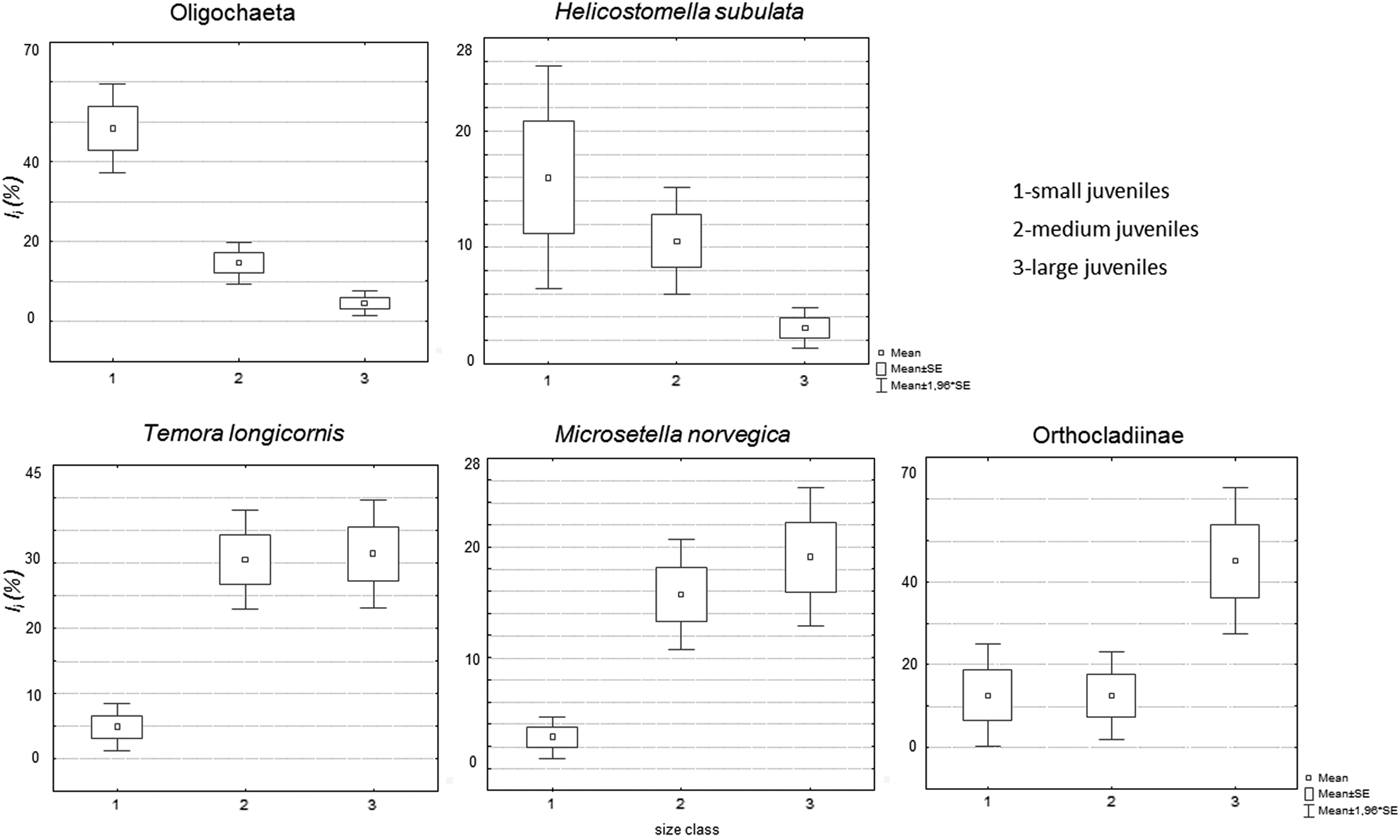
The contribution of T. longicornis, M. norvegica and Orthocladiinae to fish diet (I i) significantly increased with fish size (Table 4). In contrast, it decreased for Oligochaeta. No significant changes were found for H. subulata (Table 4), probably due to its highly variable contribution in small juveniles (Figure 3).

Fig. 3. Average values of I i in the three size groups of juveniles for Oligochaeta, H. subulata, T. longicornis, M. norvegica and Orthocladiinae.
SEASONAL DIET VARIABILITY, AND CORRELATIONS BETWEEN DIET AND FOOD ORGANISM AVAILABILITY
Patterns of seasonal changes in diet were prey-specific. The contribution of H. subulata to diets was positively correlated with its high abundance in plankton in 2012 (Table 5). On the contrary, correlation between I i and N was not found in 2013, when the abundance of H. subulata was low.
Table 5. Correlation (Spearman rank coefficient) between I i of major prey organisms and their abundance in the sea for 2012 and 2013. Significant (P < 0.05) correlations are in bold. ‘–’ indicates lack of data or absence of organism in sea.

* Analysis uses only large size group.
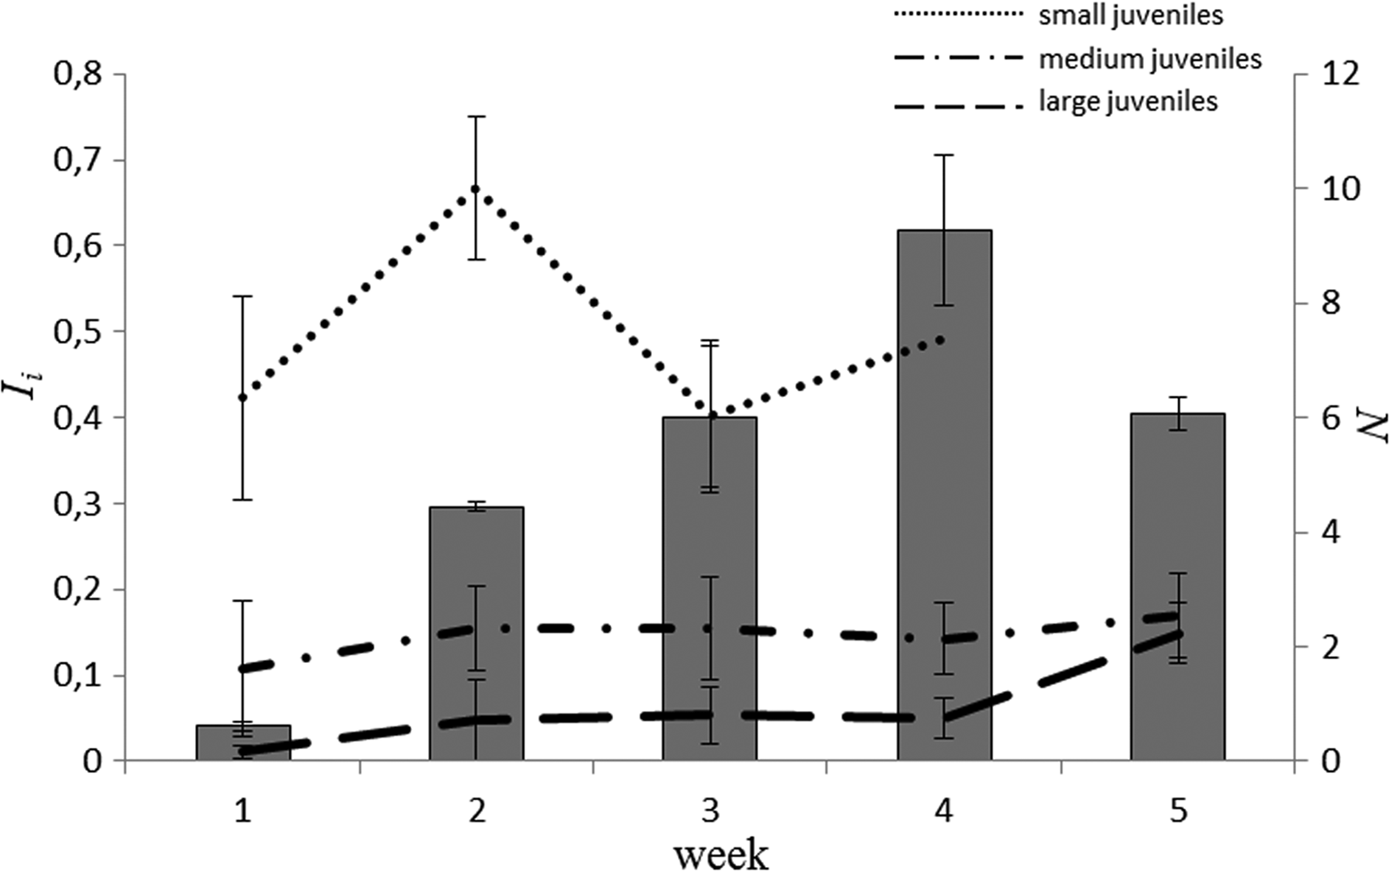
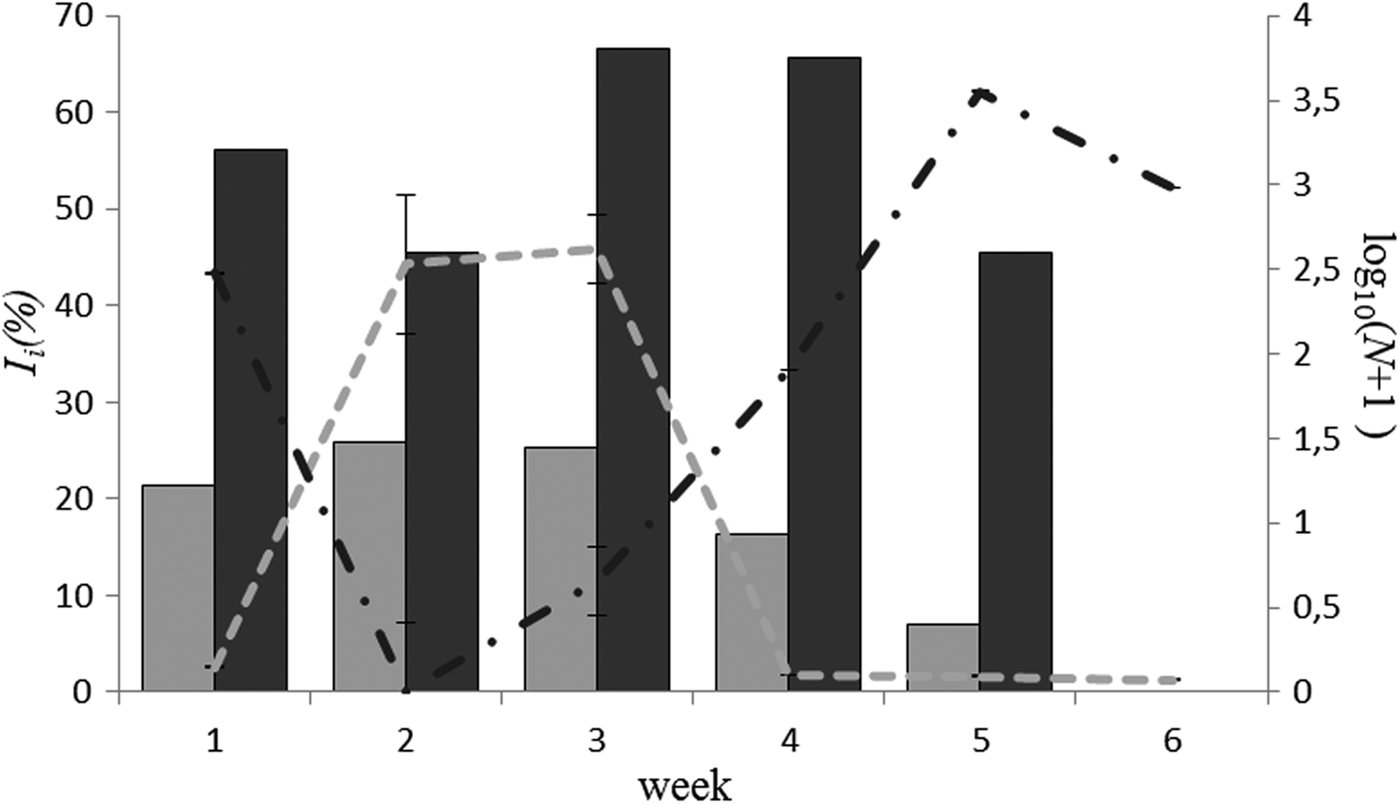
We also found a significant positive correlation between the abundance of Orthocladiinae in the study area and its relative consumption by large juvenile sticklebacks in 2013 (I i) (for large and medium juveniles correlation did not approach significance). Significant changes in I i for T. longicornis also occurred during August 2013. However, these changes were not related to T. longicornis availability, as is shown by the low correlation (Table 5). Interestingly, when we considered these results jointly with the dynamics of N and Ii for Orthocladiinae (Figure 4), it became obvious that decrease in I i for T. longicornis occurred simultaneously with high I i for Orthocladiinae, which is closely related with the abundance of Orthocladiinae in the benthos.

Fig. 4. Dynamics of number of individuals (N) and I i for Orthocladiinae (grey) and T. longicornis (black) in August 2013. Histogram – N, lines – I i. Left axis – % I i, right axis – logarithm of number of individuals (log10(N + 1)).
In Oligochaeta no significant correlation between Ii and abundance in the environment was observed (Table 5), although its abundance, hence its availability, during August significantly increased (Figure 5). Finally, no seasonal variation in the consumption of M. norvegica was found.

Fig. 5. Dynamics of average Ii values of Oligochaeta for the three size groups of juveniles (lines) and abundance of Oligochaeta (ind. m−2) in benthos (histogram) in August 2013.
Electivity
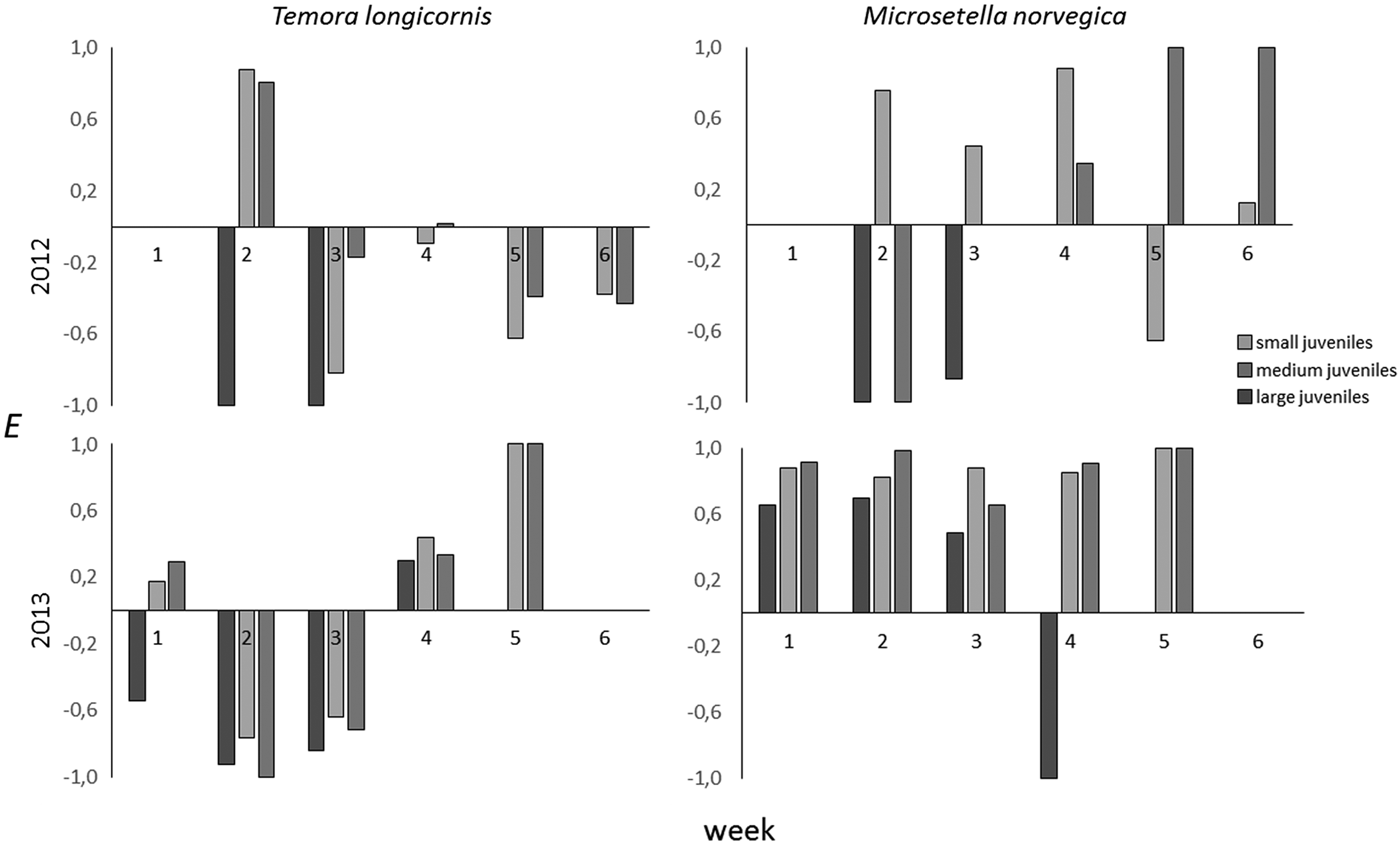
The electivity index of M. norvegica in 2012 varied notably around an average of 0.19, with the number of positive indices not significantly exceeding the number of negative indices (sign. test, P = 0.54). In 2013, indices for all size groups were positive during the entire month of August (sign. test, P = 0.0055) (Figure 6).

Fig. 6. Dynamics of electivity indices for T. longicornis and M. norvegica in 1 (small), 2 (medium) and 3 (large) size classes in 2012 and 2013.
In 2013 T. longicornis showed negative electivity indices for all size groups during the first half of August, but positive indices during the second half of the month (Figure 6). In 2012, electivity for T. longicornis was mostly negative.
It was impossible to assess food selectivity for Orthocladiinae and Oligochaetae without data on their total biomass in the study area. However, we were able to estimate size selectivity for these taxa. We observed a significant increase in Orthocladiinae size at sea in August, 2011 and 2013, from 0.85 ± 0.04 mm to 1.84 ± 0.11 mm, and from 0.96 ± 0.03 mm to 2.32 ± 0.13 mm, respectively (Kruskal–Wallis ANOVA, in both cases P < 0.001). In 2012, no significant prey size trends were observed for Orthocladiinae, likely due to low abundance that year. Despite a significant increase in the size of this taxon at sea in 2011 and 2013, no corresponding increase was found in the size of Orthocladiinae in juvenile stomachs (Kruskal–Wallis ANOVA, P = 0.3700), which was on average 1.11 ± 0.018 mm. Thus, it appeared that fish actively selected Orthocladiinae of medium size (Figure 7). Overall, the size of Oligochaeta both at sea and in stomachs did not significantly change during the entire period of observation (Kruskal–Wallis ANOVA, P = 0.112, with an average length of 0.72 ± 0.003 mm.

Fig. 7. Average size of Orthocladiinae in sea and in stomachs in 2013.
DISCUSSION
Currently, the abundance of three-spined sticklebacks in the White Sea is close to its historical maximum (Lajus et al., Reference Lajus, Ivanova, Shatskikh and Ivanov2013b) and juveniles are very numerous in the inshore zone of Kandalaksha Bay during the second half of summer. They consume many different planktonic and benthic organisms and provide food for predator fish such as cod (Gadus morhua (Linnaeus, 1758)), saffron cod (Eleginus navaga (Pallas, 1814)), and four horn sculpin (Triglopsis quadricornis (Linnaeus, 1758)) (Trofimenko, Reference Trofimenko2013).
The composition of plankton and benthos found in the sea and in fish stomachs was quite similar in the study area in different years, and was dominated by Copepoda and Cladocera – T. longicornis, M. norvegica, P. leucarti, C. hamatus in plankton and by Oligochaeta and Orthocladiinae in the benthos. In the sea, planktonic organisms are common prey for juvenile sticklebacks (e.g. Hangelin & Vuorinen, Reference Hangelin and Vuorinen1988; Short et al., Reference Short, Metaxas and Daigle2013), whereas benthic organisms are mostly present in diets of river- and lake-dwelling juveniles (Hynes, Reference Hynes1950; Walkey, Reference Walkey1967; Sánchez-Gonzáles et al., Reference Sánchez-Gonzáles, Ruiz-Campos and Contreras-Balderas2001). Abdel-Malek studied sticklebacks in the White Sea in the 1960s and found that Oligochaeta played no role in fish diets, and Orthocladiinae played only a minor role (Abdel-Malek, Reference Abdel-Malek1968). Although he studied smaller juveniles (7–18 mm) than we did (9–27 mm), the main plankton food objects were similar in both cases.
Inter-annual differences in the density of food organisms in the sea were probably related to the temperature of surface water layers, which may affect the composition of plankton in the White Sea (Pertzova, Reference Pertzova2000). Average surface water temperature in August 2013 was notably warmer (15.5°C) than in August 2012 (12.4°C) (http://www.rp5.ru). This likely caused T. longicornis, which is a boreal species (Pertzova & Kosobokova, Reference Pertzova and Kosobokova2002), to become more abundant in 2013 than in 2012, which accords with their presence in fish diets in our samples. Microsetella norvegica was more abundant in 2012 and its occurrence was also higher in stickleback stomachs that year. Abundance of the most important benthic organism for young sticklebacks, Orthocladiinae larvae, is also characterized by apparent inter-annual fluctuations, and very strongly correlated with their presence in stomachs. They are likely the preferred food organism for young sticklebacks in eelgrass beds in the White Sea.
Fish size and feeding selectivity are key factors determining the food composition of young sticklebacks. Prey organisms are clearly subdivided into two groups: the first includes the smallest planktonic and benthic organisms – H. subulata and Oligochaeta, most often found in the smallest fish; the second group includes Orthocladiinae, T. longicornis and M. norvegica primarily consumed by larger fish. As juveniles approach approximately 15 mm in length, they shift from the first prey group to the second. This pattern is in accordance with the size-efficiency hypothesis of feeding (Brooks & Dodson, Reference Brooks and Dodson1965) and is commonly observed in juveniles of different fishes (Hansen & Wahl, Reference Hansen and Wahl1981; Rama & Nuutinen, Reference Rama and Nuutinen1984; Hangelin & Vuorinen, Reference Hangelin and Vuorinen1988).
Seasonality also plays an important role in the diet of young sticklebacks, and to a large extent it determines the dynamics of prey organisms in the environment. Seasonal variability in abundance is well expressed only in Orthocladiina, which hatch in late August (Pankratova, Reference Pankratova1970). Since it is the preferred food for sticklebacks, their appearance decreased the consumption of other food organisms (Figure 7). As a result, even organisms with no clear changes in seasonal abundance, such as T. longicornis and M. norvegica, can exhibit high seasonal variability in juvenile diets due to variation in the abundance of the preferred food. Thus our study identified a clear negative relationship between the occurrence of T. longicornis and Orthocladiina in stickleback stomachs. The importance of Chironomidae larvae in stickleback diets has been reported in a number of papers (Hynes, Reference Hynes1950; Walkey, Reference Walkey1967; Sánchez-Gonzáles et al., Reference Sánchez-Gonzáles, Ruiz-Campos and Contreras-Balderas2001).
Stickleback diet is determined not only by fish size, and inter-annual and seasonality variation in prey density, but also the proportion of food organisms in the sea. Sampled data allowed us to deduce the diet preferences of young sticklebacks in relation to different organisms. For larger juveniles, Orthocladiinae are likely the most attractive prey: in periods of high abundance they practically eliminate planktonic organisms such as T. longicornis and M. norvegica from stickleback diet. Microsetella norvegica is an attractive food object, with positive selectivity in periods of low abundance, although it never plays an important role in feeding. Temora longicornis is often a key component of juvenile stomach contents, but it shows positive selectivity only in the absence of more attractive food organisms. Preferences of smaller fish are determined by the size of food organisms, which is why they prefer Oligochaeta and H. subulata.
CONCLUSION
Our study, based on 3 years of observations, reports quantitative and qualitative characteristics of juvenile stickleback diet during active feeding in coastal seagrass beds. Our results contribute to a better understanding of the structure and function of marine trophic webs associated with seagrass beds, a critical environment for the early stages of many marine organisms (Hemminga & Duarte, Reference Hemminga and Duarte2000; Jackson et al., Reference Jackson, Kirby, Berger, Bjorndal, Botsford, Bourque, Bradbury, Cooke, Erlandson, Estes, Hughes, Kidwell, Lange, Lenihan, Pandolfi, Peterson, Steneck, Tegner and Warner2001). Knowledge of stickleback feeding behaviour and diet composition will help us to understand the factors driving long-term changes in abundance, both the pronounced population decline during the last century and the rapid growth experienced in recent decades (Lajus et al., Reference Lajus, Ivanova, Shatskikh and Ivanov2013b). The easy shift from one prey organism to another shows high plasticity in stickleback feeding behaviour, which may suggest that stickleback should thrive as long as potential prey communities are abundant, regardless of their composition. However, further studies of stickleback feeding selectivity, diurnal and tidal rhythms of feeding, etc., are necessary for a better understanding of the trophic relationships of this key species in the White Sea.
ACKNOWLEDGEMENTS
We are grateful to Karen Alexander for English editing.
FINANCIAL SUPPORT
EMM is supported by an ERANET Plus postdoctoral scholarship from the European Commission. The sample processing and data analyses were supported by grant 14-14-00284 from the Russian Scientific Fund.


