


1. Introduction
The basic piggy-back, foreland propagating, thin-skinned style of deformation (Bally, Gordy & Stewart, Reference Bally, Gordy and Stewart1966; Suppe, Reference Suppe1985 among others) accounts for the main structural characteristics of many outer parts of mountain belts. However, the complexities and variations of mountain fronts are increasingly documented. This variability has been linked to several factors that influence the way a tectonic wedge interacts with its foreland during deformation. These factors include, among others, the rheological behaviour of the basal décollement and of the sedimentary pile, the pre-orogenic geometry of the basement, surface processes such as syn-orogenic sedimentation and erosion, the shortening rate and orientation of the main principal stress (Buiter, Reference Buiter2012). Complexities may also arise from the superimposition of several tectonic episodes. The way in which late structures interact with pre-existing crustal anisotropies varies significantly with end-member scenarios corresponding to the reactivation of existing discontinuities and to the formation of new structures.
The Canadian Appalachians record a long-lived history, and the inherent complexity of its mountain front has been underestimated for decades. In Quebec, frontal units were envisioned as a typical fold and thrust belt characterized by a series of structural slices with a relatively well-preserved internal stratigraphy (St Julien & Hubert, Reference St. Julien and Hubert1975; A. Vallières, unpub. Ph.D. thesis, Laval Univ., 1984). Deformation was considered to be the result of the Ordovician Taconian Orogeny, the influence of subsequent tectonic events, if any, being considered as minor (St Julien & Hubert, Reference St. Julien and Hubert1975; A. Vallières, unpub. Ph.D. thesis, Laval Univ., 1984; Tremblay & Pinet, Reference Tremblay and Pinet1994). However, in comparison to classical examples of thin-skinned foreland thrust belts such as the southern Canadian Rocky Mountains (Bally, Gordy & Stewart, Reference Bally, Gordy and Stewart1966; Price, Reference Price, McClay and Price1981 among others), frontal units of the Quebec Appalachians generally exhibit much higher internal deformation, much steeper bedding, no obvious décollement level except at the base of the orogenic wedge and clear evidence of polyphased deformation (S. Séjourné, unpub. Ph.D. thesis, INRS-ÉTÉ, 2007; Sasseville et al. Reference Sasseville, Tremblay, Clauer and Liewig2008; Pinet, Reference Pinet2011a ,Reference Pinet b ).
This contribution addresses the structural complexity of the Appalachian deformation front in the Lower St Lawrence Estuary (eastern Quebec) by using recent seismic and high-resolution magnetic datasets. We present new insights on the geometry of the St Lawrence Platform – Appalachians boundary both in map and cross-section views, on previously poorly documented ENE-trending right-lateral faults, and on structural slices involving the St Lawrence Platform succession.
2. Regional setting
The Humber Zone constitutes the frontal tectonostratigraphic domain of the Canadian Appalachians and it structurally overlies the Palaeozoic autochthonous rocks of the St Lawrence Platform (Williams, Reference Williams1979).
In the St Lawrence lowlands, southwest of Quebec City, the Aston Fault and Logan's Line represent two sub-parallel major structures dipping to the southeast (Fig. 1). The Aston Fault marks the contact between autochthonous and transported (‘parautochthonous’ of St Julien & Hubert, Reference St. Julien and Hubert1975) units of the St Lawrence Platform, whereas Logan's Line marks the NW boundary of allochthonous Humber Zone strata (Konstantinovskaya et al. Reference Konstantinovskaya, Rodriguez, Kirkwood, Harris and Thériault2009; Castonguay et al. Reference Castonguay, Dietrich, Lavoie and Laliberté2010). Northeast of Quebec City, the St Lawrence Platform – Appalachians boundary lies offshore, west of the St Lawrence Estuary islands that all belong to the Appalachian tectonic wedge. Based on multibeam bathymetry and high-resolution seismic datasets, Pinet et al. (Reference Pinet, Lavoie, Keating and Brouillette2008a ) tentatively drew the boundaries of the St Lawrence Platform in the estuary and noted that this domain significantly increases in width towards the northeast, from ~8 km near the Saguenay River to ~45 km at the latitude of Matane (Fig. 1). Towards the Gulf of St Lawrence, the location of major tectonic boundaries is poorly constrained, except between Anticosti Island and the eastern Gaspé Peninsula. In this area, recent interpretation of high-resolution magnetic and seismic datasets (Pinet et al. Reference Pinet, Keating, Lavoie, Dietrich, Duchesne and Brake2012) enhances the need to clearly distinguish the St Lawrence Platform – Appalachians boundary from the deformation front. The St Lawrence Platform – Appalachians boundary corresponds to a strong structural contrast and lies relatively close (~10 km) to the Gaspé Peninsula northern shore. The deformation front is located some 25–45 km further to the north and corresponds to the northern limit of the folded St Lawrence Platform domain (Fig. 1).

Figure 1. Simplified tectonostratigraphic map showing the St Lawrence Platform – Appalachians boundary and the deformation front in southern Quebec, St Lawrence Estuary and Gulf of St Lawrence. Faults: AF – Aston Fault; LL – Logan's Line. Geographical terms: HS – Honguedo Strait; SLR – St Lawrence River; SR – Saguenay River.
In the study area (Fig. 2), the St Lawrence Platform is only exposed locally in the Charlevoix region and Quebec City area where it unconformably overlies or is in fault contact with the Precambrian metamorphic rocks of the Grenville Province (Lemieux, Tremblay & Lavoie, Reference Lemieux, Tremblay and Lavoie2003). In the Charlevoix region, the St Lawrence Platform consists of a relatively thin (< 1 km) sedimentary succession that records the foreland basin stage associated with the development of the Taconian orogenic wedge during the Middle to Late Ordovician (Fig. 3). The succession comprises a basal siliciclastic interval overlain by shallow- to ultimately deep-marine carbonates (Black River and Trenton groups). The succession is topped by an upper siliciclastic interval corresponding to flysch units derived from the Appalachian highlands (Belt, Riva & Bussières, Reference Belt, Riva and Bussières1979). Offshore, the sedimentary succession is thicker and may include younger rocks (Pinet et al. Reference Pinet, Duchesne, Lavoie, Bolduc and Long2008 a).
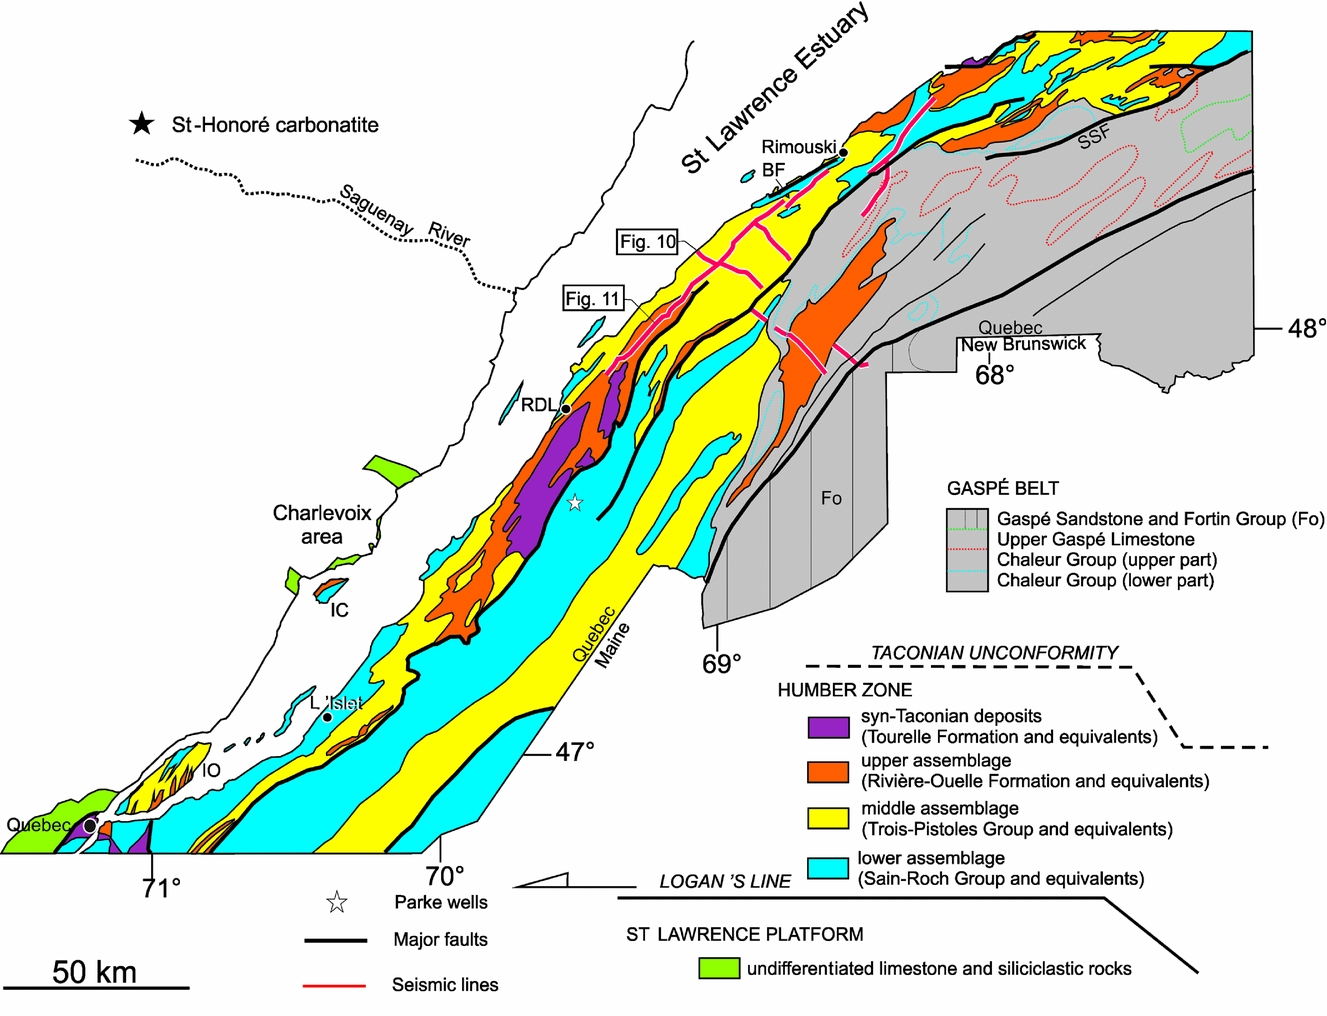
Figure 2. Simplified geological map of the Lower St Lawrence Estuary area. Modified from Brisebois & Nadeau (Reference Brisebois and Nadeau2003). Seismic profiles collected in 2007 and 2008 are indicated. Geographical names: IC – Îles-aux-Coudres; IO – Île-d'Orléans, RDL – Rivière-du-Loup. Faults: BF – Bic Fault; SSF – Shickshock-Sud Fault.
Figure 3. Schematic lithostratigraphic columns of the St Lawrence Platform, Humber Zone and Gaspé Belt.
The platform succession is cut by high-angle normal faults associated with the St Lawrence rift system (Kumarapelli & Saull, Reference Kumarapelli and Saull1966). Normal faults that formed during the Late Proterozoic – Early Cambrian rifting period (Kumarapelli, Reference Kumarapelli1985; O'Brien & van der Pluijm, Reference O'Brien and van der Pluijm2012) have been reactivated during the development and evolution of the distal Taconian foreland basin in Middle to Late Ordovician time (Lavoie, Reference Lavoie1994), in the late Silurian – Early Devonian (Sasseville, Clauer & Tremblay, Reference Sasseville, Clauer and Tremblay2012) and during the Mesozoic opening of the Atlantic Ocean (Carignan, Gariepy & Hillaire-Marcel, Reference Carignan, Gariepy and Hillaire-Marcel1997; Glasmacher et al. Reference Glasmacher, Lopez-Martinez, Tremblay, Zentilli, Wagner and Balcazar2002; Tremblay et al. Reference Tremblay, Roden-Tice, Brandt and Megan2013). Normal faults (including the St Lawrence Fault described by Tremblay, Long & Massé, Reference Tremblay, Long and Massé2003) extend offshore where they form several major NE-trending topographic scarps on the Laurentian Channel NW edge (Pinet et al. Reference Pinet, Brake, Campbell, Duchesne, Gagné and Bolduc2011).
Within the offshore segment of the St Lawrence Platform, shallow-dipping reflections (maximum dip of ~10º) are imaged on high-resolution seismic profiles and define a broad synformal structure that comprises several second-order upright NE-trending open synclines and anticlines (Pinet et al. Reference Pinet, Duchesne, Lavoie, Bolduc and Long2008 a; Pinet, Duchesne & Lavoie, Reference Pinet, Keating, Lavoie and Brouillette2010). East of the studied area, Pinet et al. (Reference Pinet, Keating, Lavoie, Dietrich, Duchesne and Brake2012) described similar folds and determined that folding must postdate the Ordovician Taconian Orogeny as Silurian and possibly Devonian strata are clearly deformed.
The south shore of the St Lawrence Estuary is made up of the external Humber Zone succession that includes Cambrian to Middle Ordovician rift and passive margin slope and rise sedimentary rocks (Lavoie, Burden & Lebel, Reference Lavoie, Burden and Lebel2003) and Middle to Upper Ordovician syn-orogenic flysch deposits (Hiscott, Reference Hiscott and Williams1995). The rift and passive margin succession consists of mainly siliciclastic Cambrian units and mixed siliciclastic/carbonate Ordovician strata with a minor amount of mafic volcanic rocks and few coarse-grained marker horizons (Fig. 3; see Lavoie, Burden & Lebel, Reference Lavoie, Burden and Lebel2003 for a review).
Rocks of the Humber Zone have recorded a complex tectonic history and are involved in a number of structural slices (St Julien & Hubert, Reference St. Julien and Hubert1975; A. Vallières, unpub. Ph.D. thesis, Laval Univ., 1984; Lebel & Hubert, Reference Lebel and Hubert1995a ,Reference Lebel and Hubert b ; Lynch, Reference Lynch1998). Most of the deformation of the outer parts of the Appalachians has been traditionally attributed to the Middle–Late Ordovician Taconian Orogeny (St Julien & Hubert, Reference St. Julien and Hubert1975; A. Vallières, unpub. Ph.D. thesis, Laval Univ., 1984; Tremblay & Pinet, Reference Tremblay and Pinet1994, Pinet & Tremblay, Reference Pinet and Tremblay1995). The imprint of younger tectonic events, recorded by both extensional and compressional structures, is, however, increasingly documented (see Pinet, Reference Pinet2011a for a review), and deformation of the Humber Zone is now attributed to a long-lived tectonic history including the Taconian (Ordovician), Salinian (Silurian) and Acadian (Devonian) tectonic events (Pincivy et al. Reference Pincivy, Malo, Ruffet, Tremblay and Sacks2003; Malo et al. Reference Malo, Ruffet, Pincivy and Tremblay2008; Pinet, Reference Pinet2011a ).
In the eastern part of the study area, Upper Ordovician to Middle Devonian rocks belonging to the Gaspé Belt (Bourque, Malo & Kirkwood, Reference Bourque, Malo and Kirkwood2001) rest unconformably on, or are in fault contact with, older rocks of the Humber Zone. The Gaspé Belt succession comprises mainly siliciclastic deposits, with subordinate amounts of volcanic and carbonate rocks formed both in shallow and relatively deep-water settings (Fig. 3; Bourque, Malo & Kirkwood, Reference Bourque, Malo and Kirkwood2001). The regional deformation of the Gaspé Belt is characterized by open folds and steeply dipping faults formed during the Middle Devonian Acadian Orogeny (Pinet et al. Reference Pinet, Duchesne, Lavoie, Bolduc and Long2008 b). The Gaspé Belt also includes long-lived structures (such as the Shickshock-Sud Fault) (Fig. 2) that experienced extensional or transtensional motion during the Late Ordovician (?) – Early Devonian period (Pinet, Reference Pinet2013) and right-lateral strike-slip motion during the Middle Devonian (Sacks et al. Reference Sacks, Malo, Trzcienski, Pincivy and Gosselin2004; Pinet et al. Reference Pinet, Duchesne, Lavoie, Bolduc and Long2008 b).
3. Datasets
3.a. Magnetic data
The high-resolution aeromagnetic data presented in this paper (Fig. 4) mainly originate from an airborne survey flown in 2009 and 2010 for the Quebec Department of Natural Resources (‘Ministère des Ressources naturelles du Québec’), which had a line spacing of 300 m. The survey was flown using a smooth drape surface and a mean flight height of 300 m. The aeromagnetic data were subsequently corrected by the Geological Survey of Canada for levelling problems, flight height variations and high-frequency noise. The area covered by the 2009–2010 survey is located to the west of another survey flown in 2004 (Fig. 4) with a 300 m line spacing and a lower mean flight height of 150 m (Pinet et al. Reference Pinet, Lavoie, Brouillette, Dion, Keating, Brisebois, Malo and Castonguay2005). For both surveys, the residual total field was obtained by subtraction of the International Geomagnetic Reference Field (IGRF) for their periods of acquisition.

Figure 4. Residual total magnetic field of the Lower St Lawrence Estuary and adjacent areas. The boundaries of the 2004 and 2009–2010 high-resolution surveys are indicated by a dotted line and a dashed line, respectively. Mc, M4 and MA indicate magnetic anomalies discussed in the text. Geographical names: ML – Matapédia Lake; RDL – Rivière-du-Loup; SR – Saguenay River.
3.b. Seismic data
The seismic data discussed in this paper (Fig. 2) have been collected for the Quebec Department of Natural Resources (‘Ministère des Ressources naturelles du Québec’) in 2007 and 2008. Stacked sections have been migrated in house using the Kirchhoff diffraction sum method (Schneider, Reference Schneider1978). Velocity models have been built assuming that coherent high-amplitude reflections are caused by important acoustic impedance contrasts that are in turn induced by significant velocity changes. The geometry of the velocity field is defined by picking horizons on the stacked sections. The root-mean-square velocities attributed to the uppermost polygon (Appalachians) are derived from sonic logs of wells Parke No. 1 and 2 (Fig. 2). There are no wells in the study area to tie the St Lawrence Platform succession to seismic lines; thus, the interpretation presented in this study relies mainly on the seismic character of the platform succession in the Quebec City area (Konstantinovskaya et al. Reference Konstantinovskaya, Rodriguez, Kirkwood, Harris and Thériault2009; Castonguay et al. Reference Castonguay, Dietrich, Lavoie and Laliberté2010).
Seismic reflection images presented in this paper display no vertical exaggeration for a typical seismic velocity of 5.5 km s−1. This average velocity has also been used for approximate time–depth conversion.
4. Interpretation of magnetic data
4.a. Long-wavelength features
The total magnetic field is characterized by NE-elongated ovoid positive anomalies reaching several hundreds of nanotesla (nT) above the regional field (Fig. 4). These anomalies decrease in amplitude and increase in wavelength towards the SE suggesting that magnetic sources are located deeper in that direction.
Forward modelling of magnetic data using a two-and-a-half-dimensional program based on the method of Talwani, Worzel & Landisman (Reference Talwani, Worzel and Landisman1959) indicates that a good match between measured and calculated data may be achieved with several relatively high magnetic susceptibility (0.003–0.004 cgs unit; 24–31 10−3 SI unit) bodies located in the upper part of the Grenvillian basement (Fig. 5). This geological interpretation agrees well with the depth of the top of the Grenvillian basement inferred from seismic data and its deepening towards the SE, and includes magnetic bodies with the ‘typical’ size of magmatic intrusions associated with magnetic anomalies in the Grenville Province (N. Paradis, unpub. M.Sc. thesis, INRS-ÉTÉ, 2004). An alternative interpretation for the southeasternmost anomaly (M4 on Figs 4, 5) is that it may relate to late Neoproterozoic – Early Cambrian volcanic rocks located at or close to the base of the Appalachian tectonic prism (Pinet et al. Reference Pinet, Duchesne and Lavoie2010). Such volcanic rocks are exposed in the Lac Matapédia area where they are associated with a prominent positive magnetic anomaly (MA on Fig. 4; Pinet et al. Reference Pinet, Duchesne and Lavoie2010; Pinet, Reference Pinet2013), and they were also intersected in two wells (Parke No. 1 and 2), drilled in the Appalachians, ~26 km to the southeast of Rivière-du-Loup (Fig. 2).

Figure 5. Geological cross-section (a) and magnetic model (b) for the interpretation of the long-wavelength magnetic anomaly (location on Fig. 4). Magnetic susceptibilities (MS, in cgs unit) are indicated. The dotted line represents the top of the Grenvillian basement as constrained by seismic reflection. Regional-residual separation of the total magnetic field has been achieved through the removal of a smooth regional component. Remanent magnetic effects were not taken into account and models only represent the effect of the apparent magnetic susceptibilities. Main magnetic anomalies are interpreted to result from magnetic bodies located in the upper part of the Grenville Province. M4 indicates a magnetic anomaly discussed in the text.
An unusual negative magnetic anomaly is located in the St Lawrence Estuary, close to the NE shore (MC on Fig. 4). This nearly circular anomaly has a diameter of ~7 km and is characterized by magnetic values ~250 nT below the regional field (Fig. 6b). Considering its shape and its location close to the exposed Grenvillian rocks, a dramatic change in the basement depth seems an unlikely explanation for this anomaly. Our preferred interpretation is to relate this unusual anomaly to a carbonatite intrusion within the Precambrian basement. Figure 6 compares the magnetic signal associated with the Neoproterozoic (565 Ma, Doig & Barton, Reference Doig, Barton and Jr1968) St Honoré carbonatite located some 130 km to the WNW (Vallée & Dubuc, Reference Vallée and Dubuc1970; Fig. 2) with the anomaly measured in the estuary. The wavelength and amplitude of both anomalies are nearly similar suggesting that they may be related to similar sources. If true, the St Lawrence Estuary anomaly represents a new occurrence of rift-related magmatic rocks associated with the break-up of the Rodinia supercontinent and documented from Labrador to Virginia over a distance of ~2500 km (Puffer, Reference Puffer2002; Pinet et al. Reference Pinet, Duchesne and Lavoie2010).

4.b. Short-wavelength features
The total magnetic field includes low-amplitude short-wavelength anomalies that cannot be detected on a colour-coded map. On Figure 7, the map of the second vertical derivative of the total residual magnetic field enhances these short-wavelength magnetic anomalies and provides improved resolution of near-surface magnetic sources at the expense of deeper sources. This map also enhances anthropic magnetic anomalies that were not fully removed during data processing and discontinuous short-wavelength anomalies with sinuous geometries that are associated with magnetic sands of modern (and in some cases ancient) river- or lake-beds. Superimposition of the magnetic map onto a detailed topographic map allowed the identification of such anthropic and drainage-related anomalies that were subsequently discarded for the geological interpretation.

Figure 7. Shaded-relief image of the second derivative of the total residual magnetic field. Red lines indicate the boundary of the central domain (St Lawrence Platform). The boundary of the 2004 and 2009–2010 high-resolution surveys are indicated by a dotted line and a dashed line, respectively. Geographical names: B – Le Bic; IO – île-d'Orléans; ML – Matapédia Lake; RDL – Rivière-du-Loup.
Three domains can be distinguished on the basis of their magnetic signature on maps that enhance near-surface sources (vertical and horizontal derivatives, shaded images of the total magnetic field; see Pinet et al. Reference Pinet, Lavoie, Brouillette, Dion, Keating, Brisebois, Malo and Castonguay2005 for details on enhancement methods).
The NW domain is characterized by curvilinear relatively high-amplitude short wavelength anomalies (Figs 7, 8) located on the northwestern shore of the St Lawrence Estuary and extending to the southeast up to the 100–300 m high escarpments that bound the Laurentian Channel. This domain is underlain by metamorphic rocks of the Grenville Province.

Figure 8. First vertical derivative (a) and shaded-relief image of the second derivative (b) of the residual magnetic field. Both maps show the subdued magnetic signature of the St Lawrence Platform (SLP) compared with the Appalachians. Truncations of linear magnetic anomalies by ENE-trending faults (dotted yellow lines) are indicated by white arrows. DF – Drag fold (part a); BF – Bic Fault. Location on Figure 7.
The central domain is characterized by a subdued magnetic signature with few subtle linear anomalies. This domain forms a 0 to 13 km wide (average ~7 km) strip north of îles-aux-Coudres Island (Figs 7, 8) and a 0 to 9 km wide, 35 km long, trapezoidal shaped zone between the île-d'Orléans and îles-aux-Coudres islands (both part of the Appalachians; Fig. 7). This domain is interpreted to represent the Palaeozoic autochthonous St Lawrence Platform, an interpretation corroborated in the northern part of the study area by high-resolution bathymetry and marine seismic datasets (Pinet et al. Reference Pinet, Duchesne, Lavoie, Bolduc and Long2008 a).
The SE domain forms part of the St Lawrence Estuary and its southeastern shore and is characterized by linear short-wavelength magnetic anomalies. The sources of short-wavelength linear anomalies are subtle (generally < 0.2 × 10⁻³ SI) magnetic susceptibility contrasts within the sedimentary succession that correspond either to known lithological changes or to magnetic content variations within a rather homogeneous sedimentary succession. Within the sedimentary succession, the Trois-Pistoles Group (Fig. 3) includes the most diversified lithological assemblages (siliceous and feldspathic sandstones, quartz arenite, mudstones and carbonate conglomerates) and is characterized by a magnetic signature including well-defined and abundant short-wavelength magnetic anomalies. In contrast, the Fortin Group exposed in the eastern part of the study area (Fo on Fig. 2) lacks magnetic markers, possibly owing to a homogeneous magnetite content and an increase in structural complexity.
Differences in the magnetic mineral content in the sedimentary pile of the St Lawrence Platform and Appalachians domains are probably not the main factor explaining their contrasting magnetic signatures, as both domains are characterized by very low magnetic susceptibility values (Pinet et al. Reference Pinet, Lavoie, Brouillette, Dion, Keating, Brisebois, Malo and Castonguay2005). The more shallow dips (generally < 5°) of sedimentary beds in the St Lawrence Platform succession compared to that of the Appalachians (frequently > 40°) is interpreted as the main factor controlling the magnetic signature of both domains, as steeper magnetic sources produce anomalies with higher amplitudes. In such a perspective, the sharp limit between the St Lawrence Platform and the Appalachians should be envisioned as the boundary between nearly flat-lying strata and strongly deformed units.
On the south shore of the St Lawrence Estuary, there is a good correlation between mapped sedimentary contacts and magnetic lineaments. In several cases, the continuity of a well-defined linear short-wavelength anomaly precludes the presence of a fault with significant (> 500 m) horizontal separation.
Faults are delineated by the truncation of linear short-wavelength magnetic anomalies corresponding to intra-sedimentary magnetic susceptibility contrasts (Fig. 8). Interpretation of enhanced potential field maps provides more constraints on the occurrence and location of structural features recognized or inferred by geological mapping, but also suggests faults that have previously not been recognized. The qualitative confidence level attributed to faults inferred from potential field data (Fig. 9) is based on the clarity and number of linear anomaly truncations. It should be noted that faults oblique to the strike of sedimentary beds are easier to recognize than bedding parallel structures and hence often benefit from a higher confidence level.

Figure 9. Fault pattern in the Lower St Lawrence Estuary and adjacent areas derived from the analysis of aeromagnetic data. Geographical names: IL – L'Ilet; ML – Matapédia Lake; R – Rimouski; RDL – Rivière-du-Loup. Faults: BF – Bic Fault; SSF – Shickshock-Sud Fault.
Interpretation of aeromagnetic data suggests several high to moderate confidence ENE faults that are either absent or represented as second-order, poorly continuous features on existing geological maps. These faults clearly cut short-wavelength linear magnetic anomalies and affect their orientation through drag folding compatible with right-lateral strike-slip motions (DF on Fig. 8a). These ENE faults are well developed in the southern and northern parts of the magnetic survey, in the L'Islet and Rimouski areas, respectively.
5. Interpretation of seismic data
5.a. Seismic profiles perpendicular to the Appalachian structural grain
Two seismic reflection profiles have been assembled to form a ~20 km long section perpendicular to the Appalachian structural grain (Fig. 10). Steeply dipping beds and structural complexity being challenging for seismic data acquisition and processing, the Appalachians appears as a chaotic unit containing only a few discontinuous reflections. The most obvious seismic features are associated with a ~0.12 s (~330 m) thick seismic unit, characterized by high-amplitude, relatively continuous, parallel reflections, and interpreted as correlative with the base of the St Lawrence Platform sedimentary succession (seismic unit 1). Despite the lack of well control, this interpretation is substantiated by: (1) the shallow dip and coherent nature of reflections, two characteristics that are incompatible with the complex structure of Appalachian strata; and (2) strong similarities with the seismic signature of the basal part of the St Lawrence Platform succession in the Quebec City area (Konstantinovskaya et al. Reference Konstantinovskaya, Rodriguez, Kirkwood, Harris and Thériault2009; Castonguay et al. Reference Castonguay, Dietrich, Lavoie and Laliberté2010).

Figure 10. Composite seismic reflection profile perpendicular to the Appalachian tectonic grain (a) and interpretation (b). DA – décollement at the base of the Appalachian tectonic wedge; DD – deepest décollement; OA – open anticline. Location on Figure 2.
The unconformable contact between the interpreted Grenvillian basement and overlying platform succession is marked by a relatively continuous reflection, and only a few strongly oblique, discontinuous reflections are located below it. The high-amplitude reflection that marks the top of seismic unit 1 is interpreted as representing the contact between the Ordovician limestone interval (Rivière du Moulin ‘facies’ of Lemieux, Tremblay & Lavoie, Reference Lemieux, Tremblay and Lavoie2003 in the Charlevoix area) and the upper siliciclastic interval (Saint-Irénée Formation in the Charlevoix area; Belt, Riva & Bussières, Reference Belt, Riva and Bussières1979). This interpretation is compatible with the measured stratigraphic thickness of the platform succession below the Sainte-Irénée Formation (200–350 m) and with a similar seismic signature documented to the south, near Quebec City, at the transition between correlative units (Trenton Formation – Utica Shale; Castonguay et al. Reference Castonguay, Dietrich, Lavoie and Laliberté2010)
Seismic unit 1 is structurally repeated and thrust slices overlie the autochthonous succession along shallow-dipping faults. The base of the lower (autochthonous) highly reflective seismic unit lies at depths that increase towards the southeast from 1.25 s to 2.0 s (~3.4 to 5.5 km). Reflections are cut and displaced in a staircase fashion by four main steep SE-dipping normal faults (noted F1 to F4 on Fig. 10) with normal separation of up to 0.11 s (~300 m). Thick-skinned fault inversion may have occurred along the F2 and possibly F4 normal faults as suggested by open anticlines in their hanging walls. Above the autochthonous domain, the deepest décollement (DP on Fig. 10) exhibits a subtle flat-ramp geometry possibly controlled by steps in the rifted basement. On most of the profile, the décollement is located near the top of seismic unit 1. However, it cuts seismic unit 1 in the footwall of the F3 normal fault and rises in the sedimentary succession towards the northwest where it overlies an almost transparent seismic package (over F1 in Fig. 10). The distance between the northwesternmost occurrence of the allochthonous seismic unit 1 and the southeasternmost occurrence of the autochthonous seismic unit 1 is ~15 km and represents the minimal horizontal separation along the deepest décollement (DD on Fig. 10).
An almost transparent unit (seismic unit 2 on Fig. 10) characterized by very few discontinuous reflections overlies the highly reflective seismic unit 1, and is interpreted as characterizing the Upper Ordovician siliciclastic units of the St Lawrence Platform succession. A seismically chaotic unit that represents the Appalachian tectonic wedge structurally overlies seismic unit 2. The décollement at the base of the Appalachian tectonic wedge is not well imaged and its interpreted location is tentative.
5.b. Seismic profiles parallel to the Appalachian structural grain
Three seismic reflection profiles have been merged together to form a ~81 km long section (Fig. 11). The NE-trending composite seismic profile is nearly parallel to the structural grain, implying that the apparent dips of the reflections do not represent ‘true’ dips.

Figure 11. Composite seismic reflection profile parallel to the Appalachian tectonic grain (a) and interpretation (b). DA – décollement at the base of the Appalachian tectonic wedge; DD – deepest décollement. Location on Figure 2.
The basal seismic unit 1, characterized by high-amplitude continuous reflections, is well imaged in the southwestern and central parts of the composite profile. In this area, the lowermost continuous reflection interpreted as the contact between the Grenvillian basement and the St Lawrence Platform, which exhibits long-wavelength undulations, lies at a depth varying between 2.06 and 1.40 s (Fig. 11) indicating a significant maximum along-strike depth variation of ~1.8 km.
In the southwestern part of the composite profile, the almost transparent seismic unit 2 conformably overlies the autochthonous seismic unit 1 and is ~0.45 s thick (~1.2 km). In this area, the upper contact of seismic unit 2 that marks the décollement at the base of the Appalachian tectonic wedge (DA on Fig. 11) is relatively well defined in several points and grossly follows the basement undulations (Fig. 11).
The youngest rock unit (Rivière-Ouelle Formation) is exposed along the southern part of the profile (Fig. 2), where the base of the Appalachians is the deepest, whereas the oldest rock unit (Saint-Roch Group, included in the lower assemblage on Fig. 2) is exposed along its northern part (Fig. 2) where the base of the Appalachians is the shallowest. This suggests that rock units forming the Appalachians grossly follow the undulations of the basal décollement and the overall stratigraphy was not significantly disrupted within the tectonic wedge.
In the central part of the composite profile, two tectonic slices (including the one shown on Fig. 10) are well imaged (Figs 11, 12). Seismic units 1 and 2 that formed the slices are characterized by thicknesses grossly equivalent to their autochthonous counterpart.

Figure 12. Detailed view of a St Lawrence Platform allochthonous slice structurally overlying the autochthonous domain. The yellow and blue lines indicate the base and top of seismic unit 1, respectively. Location on Figure 11. DD – deepest décollement; ER – enhanced reflection.
In the southern and central parts of the composite profiles, two ENE-trending faults imaged on aeromagnetic data lack clear seismic evidence, suggesting that they are restricted to the Appalachian wedge or characterized by limited vertical separation. In the northern part of the composite profile, geological units are poorly imaged, possibly owing to an increase in structural complexity in a zone characterized by several faults trending obliquely to the profile (Fig. 9).
6. Discussion
6.a. Map-view geometry of the mountain front in the Lower St Lawrence Estuary
In the St Lawrence Estuary, aeromagnetic data that represents spatially continuous grids of information provide an important mapping tool to precisely locate the Appalachians – St Lawrence Platform contact. It is noteworthy to mention that the contact inferred from aeromagnetic data is in close agreement with the one proposed on the basis of high-resolution seismic data, in the northern part of the study area previously investigated by Pinet et al. (Reference Pinet, Lavoie, Keating and Brouillette2008a ).
The St Lawrence Platform is the narrowest in the îles-aux-Coudres Island area (Fig. 9). In that area, the shape of the coastline is controlled by two normal fault systems, which trend NNE to the southwest of the island and ENE to the north. The ENE fault parallel with the north shore of the island clearly extends to the east where it cuts short-wavelength anomalies, suggesting that it is either a reactivated normal fault or a fault restricted to the Appalachian wedge. A shallow well, located in the central part of îles-aux-Coudres Island, cuts the Appalachian succession down to a depth of 337 m, where a major fault was encountered causing the end of drilling (Ministère des Ressources naturelles du Québec, 2013, http://sigpeg.mrn.gouv.qc.ca/gpg/classes/rechercheIGPG). This fault possibly corresponds to the décollement at the base of the Appalachian tectonic wedge, suggesting that St Lawrence Platform strata may be present just below the drilled interval and in the 2.5 km wide strait located to the west (Fig. 9). The lack of linear short-wavelength anomalies and the significant thickness (160 m; Todd, Occhietti & Burns, Reference Todd, Occhietti and Burns1991) of Quaternary sediments in the strait suggestive of a zone with a higher erosion potential than the Grenville and Appalachian domains tend to support the occurrence of platform strata.
The characterization of several ENE-trending faults is a major new finding resulting from the interpretation of magnetic data. Few of the ENE-trending faults imaged on aeromagnetic images have been mapped onshore, where they generally appear as second-order features with limited along-strike extent (Brisebois & Nadeau, Reference Brisebois and Nadeau2003). A notable exception is the Bic Fault (Figs 2, 9) described in detail by Rhéaume & Schrijver (Reference Rhéaume and Schrijver1991). In the field, the Bic Fault corresponds to a ~100 m wide deformed zone dipping ~45° towards the south and putting in contact Cambrian rocks (Orignal Formation) over Ordovician rocks (Rivière-Ouelle Formation). Higher strain towards the contact is marked by the silky aspect of cleavage surfaces, their closer spacing and ubiquitous isoclinal folds. Kinematic indicators, including sub-horizontal stretching lineations defined by quartz rods, Riedel shears, C-S fabrics and brittle faults with sub-horizontal slickenlines, attest to a dextral sense of motion.
Rhéaume & Schrijver (Reference Rhéaume and Schrijver1991) have interpreted the Bic Fault as a lateral ramp formed during the main Taconian thrusting event, with no subsequent episode of motion. Data presented above challenges this interpretation as the ENE fault system in the Rimouski area (including the Bic Fault) extends to the east towards the Matapedia Lake area where it trends parallel to the Shickshock-Sud Fault (Fig. 9). The latter fault is a major and long-lived structure that experienced several tectonic events postdating the Taconian Orogeny, including an episode of normal (or transtensional) faulting spanning the Late Ordovician (?)/Silurian – Early Devonian period and an episode of Middle Devonian transpression (Pinet, Reference Pinet2013).
6.b. Cross-section geometry of the mountain front in the Lower St Lawrence area: a Canadian perspective
On the seismic profile perpendicular to the structural grain (Fig. 10), high-angle SE-dipping normal faults displace in a staircase fashion the Grenvillian basement and the lower part of the autochthonous St Lawrence Platform. Similar faults have been imaged on seismic reflection profiles located all along the Appalachian mountain front from southern Quebec to Newfoundland (Fig. 13; SOQUIP, 1987; Cooper et al. Reference Cooper, Weissenberger, Knight, Hostad, Gillepsie, Williams, Burden, Porter-Chaudry, Rae and Clark2001; S. Séjourné, unpub. Ph.D. thesis, INRS-ÉTÉ, 2007; Castonguay et al. Reference Castonguay, Dietrich, Lavoie and Laliberté2010). On the basis of thickness/facies variation of sedimentary units on both sides of the faults and geochronological data, these faults are interpreted to have a polyphase structural history including two orogenic-scale episodes: (1) a late Neoproterozoic – Early Cambrian rifting episode (Kumarapelli, Reference Kumarapelli1985; O'Brien & van der Pluijm, Reference O'Brien and van der Pluijm2012); and (2) a Middle to Late Ordovician normal faulting episode in a Taconian foreland setting (Lavoie, Reference Lavoie1994). The regional significance of post-Taconian deformation events along these faults is less firm. However, evidence for reactivation is increasingly documented and includes: (1) a late Silurian – Early Devonian normal faulting event in the Charlevoix area, contemporaneous with the formation of the Gaspé Belt successor basin (Sasseville, Clauer & Tremblay, Reference Sasseville, Clauer and Tremblay2012); (2) a pre-Carboniferous basement-involved fault inversion event documented seismically and from drilling in the Port au Port area (Newfoundland; Cooper et al. Reference Cooper, Weissenberger, Knight, Hostad, Gillepsie, Williams, Burden, Porter-Chaudry, Rae and Clark2001; Stockmal, Slingsby & Waldron, Reference Stockmal, Slingsby and Waldron2004); and (3) a Mesozoic fault inversion event inferred on the basis of apatite fission track age discontinuities in the Charlevoix area (Tremblay et al. Reference Tremblay, Roden-Tice, Brandt and Megan2013).

Figure 13. Representative cross-sections illustrating the along-strike variation of the Appalachian deformation front between southern Quebec and western Newfoundland. Numbers refer to specific structural features. (a) Adapted from S. Séjourné (unpub. Ph.D. thesis, INRS-ÉTÉ, 2007); (b) adapted from Castonguay et al. (Reference Castonguay, Dietrich, Lavoie and Laliberté2010); (c) and (d), this study; (e) modified from Pinet et al. (Reference Pinet, Keating, Lavoie and Brouillette2010, Reference Pinet, Keating, Lavoie, Dietrich, Duchesne and Brake2012); (f) modified from Cooper et al. (Reference Cooper, Weissenberger, Knight, Hostad, Gillepsie, Williams, Burden, Porter-Chaudry, Rae and Clark2001).
In the St Lawrence Estuary, on the NW edge of the Laurentian Channel, high-angle normal faults have a clear geomorphological expression that correspond to escarpments up to 300 m high (Pinet et al. Reference Pinet, Brake, Campbell, Duchesne, Gagné and Bolduc2011). Towards the Gulf of St Lawrence, within the Honguedo Strait (Fig. 1), the geomorphological signature of normal faults is less obvious and Silurian–Devonian (?) sediments that form the seafloor are cut by faults exhibiting Devonian right-lateral separations, some of them corresponding to subtle bathymetric features (Pinet et al. Reference Pinet, Keating, Lavoie, Dietrich, Duchesne and Brake2012). However, in the absence of good quality seismic in the Honguedo Strait area, the possibility that late strike-slip motion took place along inherited normal faults remains hypothetical.
As discussed above, the base of the autochthonous sedimentary succession varies significantly in depth along the strike of the St Lawrence Estuary (Fig. 11), and the regional dip of the St Lawrence Platform calculated between its northwesternmost occurrence and the composite NNE seismic profile varies between ~5° and ~10°. This range of values is close to the one documented south of Québec City (~5° to ~8.5°; Castonguay et al. Reference Castonguay, Dietrich, Lavoie and Laliberté2010) and in the Honguedo Strait, between Anticosti Island and the Gaspé Peninsula (~6.5°; SOQUIP, 1987).
In the study area, the St Lawrence Platform succession is involved in a number of structural slices located below the décollement at the base of the Appalachian tectonic wedge (Fig. 13d). This geometry mimics the one documented in southern Quebec where platform slices have been the focus of hydrocarbon exploration (Fig. 13b). In this area, evidence for basement-involved inversion of high-angle normal faults is documented in a few seismic lines, and in several cases, low-angle thrusts cut the normal faults’ footwall (Fig. 13a; S. Séjourné, unpub. Ph.D. thesis, INRS-ÉTÉ, 2007). Platform slices often exhibit a duplex geometry and are either overlying the autochthonous domain (Fig. 13b) or are completely detached (Fig. 13a). Detailed analysis of some seismic reflection profiles documents a flat and ramp geometry for some thrust faults, possibly linked to the presence of major steps induced by normal faults of significant displacement in the underlying autochthonous domain. Close to the Appalachian front, open folds and hinterland (SE-verging) directed faults have been described or inferred both southwest (Fig. 13b; Konstantinovskaya et al. Reference Konstantinovskaya, Rodriguez, Kirkwood, Harris and Thériault2009; Castonguay et al. Reference Castonguay, Dietrich, Lavoie and Laliberté2010) and northeast (Fig. 13d; Pinet et al. Reference Pinet, Duchesne and Lavoie2010, Reference Pinet, Keating, Lavoie, Dietrich, Duchesne and Brake2012) of the study area.
Owing to its structural complexity, the geometry of the tectonic wedge above the décollement at the base of the Appalachians remains poorly constrained by seismic data in the study area and along most of the Quebec Appalachians. Recent studies indicate that the present-day geometry of the Appalachian frontal units is more complicated than usually thought, including both foreland and hinterland-directed thrusts as well as normal and strike-slip faults (see the review in Pinet, Reference Pinet2011a ). Moreover, field and geochronological evidence indicates that these complex structures result from the superimposition of several deformation events (Pinet, Reference Pinet2011a ).
7. Conclusion
The Appalachian front has been the focus of very few geological studies over the last 30 years and geophysical data presented in this paper are the first ever reported for the Lower St Lawrence Valley area. In the St Lawrence Estuary, magnetic data allows the documentation, for the first time, of the offshore contact between the shallowly dipping autochthonous strata of the St Lawrence Platform and deformed, frequently steeply dipping, rocks of the Appalachians. The width of the St Lawrence Platform domain varies significantly along-strike and its geometry is in part controlled by previously poorly documented ENE faults with dextral strike separations. These faults bear similarities with those documented in the Silurian–Devonian Gaspé Belt and indicate that late (Middle Devonian) deformation extended up to the Appalachian front. Seismic data image a wedge-shaped Appalachian belt thickening towards the hinterland and underlain by St Lawrence Platform strata that are involved in a number of tectonic slices similar in structural style to those found to the southwest. Owing to its high structural complexity, the internal geometry of the Appalachian tectonic wedge is not well resolved on seismic data. However, significant changes in depth of the décollement at the base of the Appalachian wedge are documented. Taken together, geological, magnetic and seismic data suggest that the overall geometry of the Appalachian front exhibits significant variations both in map and cross-section views. These variations may be related to an irregular, structurally controlled Ordovician palaeotopography of the St Lawrence Platform in front of the deforming Appalachian tectonic wedge, to the superimposition of post-Ordovician neoformed or reactivated structures, or probably both.
Acknowledgements
We thank Sébastien Castonguay for his detailed comments on an early version of this paper and Virginia Brake for her technical support. Regis Dumont is acknowledged for his careful work on magnetic data. Constructive comments by an anonymous reviewer and M. Allen improved the manuscript. The ‘Ministère des Ressources naturelles du Québec’ is acknowledged for providing the seismic data. This is the Geological Survey of Canada contribution No: 20130259


