I. Introduction
Fairtrade is an organized social movement that promotes social, economic, and environmental standards in areas related to the production and trading of “Fairtrade” labeled goods. The Fairtrade label was launched in 1988Footnote 1 by the Dutch development agency Solidaridad, which started to sell Fairtrade coffee from Mexico and Nicaragua under the Max Havelaar Fair Trade label. The aim was to help economically disadvantaged and marginalized producers and workers in developing countries get fair access to markets under better trading conditions across the entire supply chain, inter alia through the establishment of long-term trading relationships.
The initiative was replicated in the United States, Canada, and several countries throughout Europe and Asia, where coffee, tea, cocoa products, bananas, and so forth were sold in “World Shops” or “Alternative Trading Associations” (ATOs) being represented by the Fair Trade Federation (FTF) and the World Fair Trade Organization (WFTO). To unite these different labeling initiatives and to establish worldwide standards and certification, Fairtrade Labeling Organizations (FLO) International was established in Bonn, Germany, in 1997. It launched a new international Fairtrade Certification Mark in 2002 to enhance the visibility of Fairtrade. In 2004, the FLO split into FLO International, with responsibility for setting and maintaining Fairtrade Standards (agreed upon through a process of research and consultations) as well as for offering business support to producers, and into FLO-CERT (2012), with responsibility for inspections and certification of producer organizations.
The standards set by FLO International serve as minimum criteria to ensure that conditions for production and trade are socially, economically, and environmentally responsible. The means to achieve these goals include i) a price floor; ii) Fairtrade premiums; iii) stability and access to credit; iv) establishment of working-condition standard;Footnote 2 v) encouragement of institutional structures, such as cooperatives; and vi) establishment of environmental standards (Dragusanu, Giovannucci, and Nunn, Reference Dragusanu, Giovannucci and Nunn2014).
It is not a priori clear that the ambitious Fairtrade goals have been achieved. Based on randomized controlled trials, Granville and Telford (Reference Granville, Telford, Granville and Dine2013) analyze the impact of Fairtrade on landless workers in the South African wine industry. Although they find that Fairtrade workers are not more likely to report higher incomes or better health and education outcomes than non-Fairtrade workers, they do report a higher standard of living and a higher degree of motivation to participate in joint body activities. Granville and Telford conclude, “[T]he data suggests that Fairtrade appears to be clearly achieving at least two of its objectives” (326).
The first wine farm to achieve Fairtrade certification globally was South Africa's Thandi Wines in 2003 (Fairtrade Label South Africa, 2012), and South African wines are still dominant in the Fairtrade wine sector. In 2012, the last year of our database, there were 46 certified wine producers, coming from South Africa (17), Chile (13), Argentina (14), Brazil (1), and Lebanon (1) (FLO-CERT, 2012).
The United Kingdom is the world's largest market for Fairtrade products in general, and for wine in particular. Of the worldwide sales of 22.2 billion liters in 2016, almost half (i.e., 10.9 billion liters) was sold in the United Kingdom (Fairtrade Foundation UK, 2017).
In this paper, we analyze the market for South African Fairtrade certified wine in the United Kingdom and focus on its price dispersion. A large and growing body of information-theory literature has analyzed and found considerable price dispersion even for standardized products (for a survey, see Jaeger and Storchmann, Reference Jaeger and Storchmann2011). Various empirical studies have explicitly examined the association between consumer search and price dispersion for homogenous goods (e.g., Jaeger and Storchmann, Reference Jaeger and Storchmann2011; Pratt, Wise, and Zeckhauser, Reference Pratt, Wise and Zeckhauser1979; Sorensen, Reference Sorensen2000). In general, when search costs are high, consumers may be less inclined to look for the retail outlets with the lowest prices, allowing for higher price dispersion. We argue that the same relation may hold for goods with socially desirable and charitable connotations, such a Fairtrade products. Compared to when they buy regular wine, consumers may derive additional utility in the form of prestige, respect, friendship, social acclaim (Becker, Reference Becker1974; Olson, Reference Olson1965), or some “warm glow” (Andreoni, Reference Andreoni1990). Therefore, the price may not be as important as otherwise, resulting in a somewhat lower search intensity for Fairtrade wine. This circumstance, in turn, may give rise to a higher price dispersion for Fairtrade wine.
We examine this question empirically for South African Fairtrade certified wine sold in the United Kingdom between 2007 and 2012 and find no support for the above-mentioned hypothesis.
The remainder of this article is organized as follows: Section II presents and interprets the data; In Section III we describe our empirical strategy and report the result. Section IV concludes.
II. Data
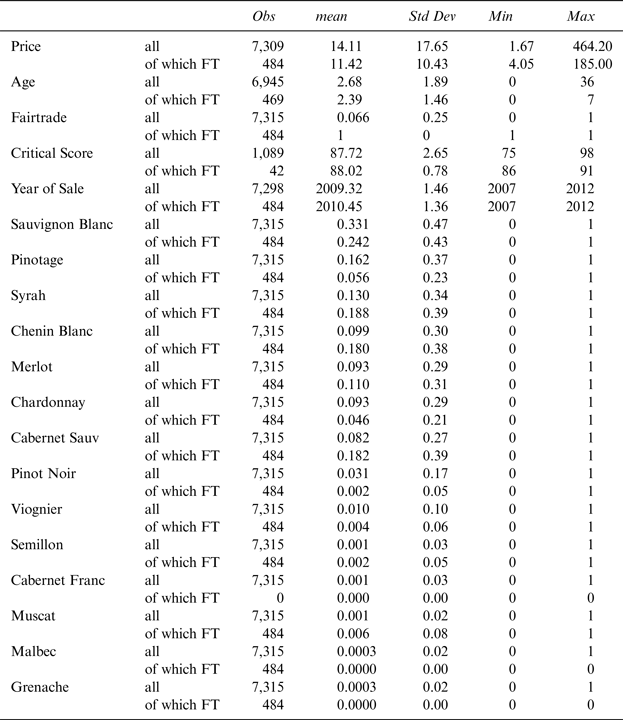
Our analysis draws on retail price postings of South African wine by wine stores in the United Kingdom between 2007 and 2012; we collected this information from the website www.wine-searcher.com. Although our total sample comprises 7,315 wine postings, we could not utilize all of them, as some were incomplete. For instance, for all nonvintage wines, we could not calculate the age. Critical scores, as provided by wine-searcher.com,Footnote 3 were available only for 1,089 wines in our sample. Table 1 reports some descriptive statistics for the entire sample as well as for the Fairtrade sub-group.
Table 1 Descriptive Statistics
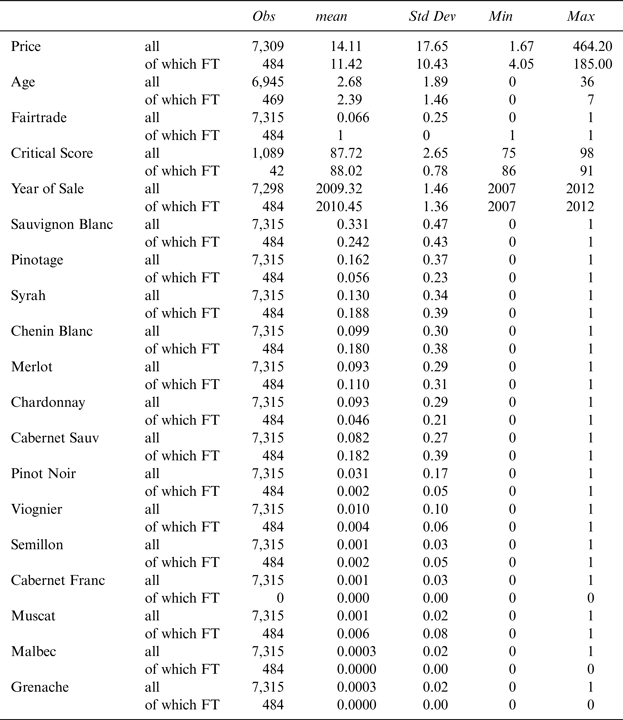
Fairtrade wines are, on average, less expensive than wines of the comparison group. Compared to the mean wine price of €14.11 in the sample, average Fairtrade wine prices are almost 20 percent lower (€11.42). In addition, Fairtrade wine prices exhibit a substantially smaller range and standard deviation than other wines. However, that does not necessarily mean that Fairtrade exhibit a lower price dispersion.
Fairtrade wines are notably different from other wines not only with respect to their price. Although they receive similar critical quality scores, the score range is much smaller. Non-Fairtrade wines display a range of 21 points (between 77 and 98 points), but Fairtrade wines only show a 5-point range (between 86 and 91 points), suggesting that their quality is much more uniform.
Furthermore, Fairtrade wines in our sample show a grape-variety profile that is distinctly different from that of the whole sample. The grape-variety dummy variables in Table 1 are sorted by their relative importance for the entire sample. Because their values equal either zero or one, the mean values reflect the percentage of wines that contain the corresponding variety or characteristic. For instance, a mean sample value of 0.331 for Sauvignon Blanc reflects that 33.1 percent of the wines in the entire sample contain this grape variety.
Therefore, although all South African wines in our sample are predominantly produced with Sauvignon Blanc (33.1%), Pinotage (16.2%), Syrah (13.0%), and Chenin Blanc (9.9%), Fairtrade predominantly relies on Sauvignon Blanc (24.2%), Syrah (18.8%), Cabernet Sauvignon (18.2%), and Chenin Blanc (18.0%). Overall, Fairtrade wines are slightly more likely to be red wines (52.1% of all Fairtrade wines) than is the case in the entire sample (46.8%).
III. Methods and Results
A. Combined Equations
(1) Hedonic Model
In general, we follow a two-step approach. First, we run a hedonic model to explain the prices of all wines in our sample. Second, we square the residuals and regress them on the Fairtrade dummy variable. Our reasoning is as follows: If, e.g., the Fairtrade variable were a significant explanatory variable for the squared residuals, Fairtrade wines would display a higher degree of price dispersion than non-Fairtrade wines. Note that we do not examine the price dispersion of identical wines but of similar wines, after controlling for various characteristics.
Our first hedonic equation follows the standard model:
 $$\eqalign{\ln \left( {P_i} \right)& = b_0 + b_1 FT_{it} + b_2 age_{it} + b_3 \left( {age\, {\ast} \,FT} \right)_{it}\, +\, b_4 trend_t \cr & \quad + b_5 \left( {trend \,{\ast}\, FT} \right)_{it}\, +\, \mathop \sum \limits_k a_k D_{kit} + e_{it},}$$
where FT denotes a Fairtrade dummy variable, age is the age of the wine at the time of posting, and trend is an annual trend variable. D kit is a set of assorted dummy variables. We add vintage dummies to capture annual quality variations, producer dummies for time-invariant firm factors, and grape-variety dummies to control for varietal-related price effects. e it is a random error term.
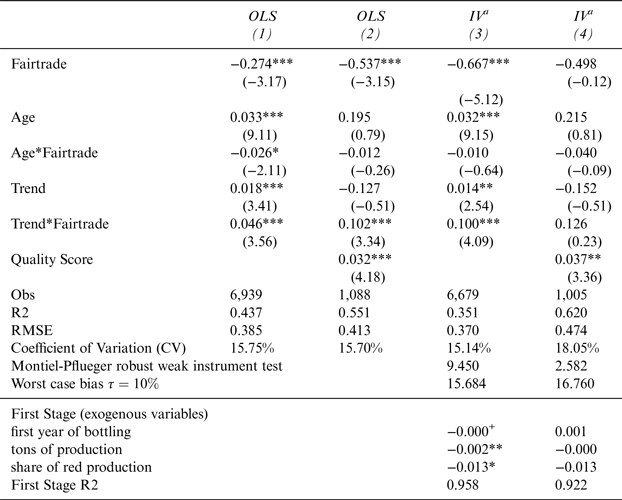
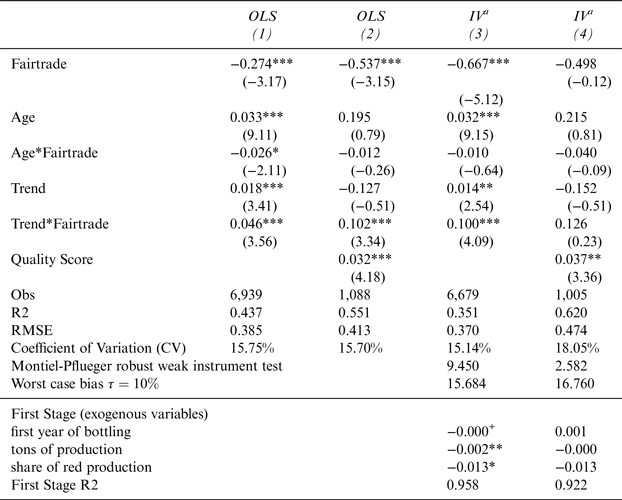
Column (1) of Table 2 reports the result of a simple Ordinary Least Squares (OLS) regression where the dependent variable is the natural logarithm of the price. The results suggest a substantial negative price effect for Fairtrade wine of approximately –27 percent. In contrast to the overall sample, Fairtrade wine does not benefit from aging (i.e., the age*Fairtrade interaction almost completely offsets the positive general age effect). However, Fairtrade wines exhibit above-average trend effects (i.e., the trend*Fairtrade interaction suggests that Fairtrade wines have experienced annual price increases of approximately 4.6%, in addition to the 1.8% for the entire sample).
Table 2 Determinants of Wine Prices
OLS and 2SLS Instrumental Variable Approach
Dependent Variable ln(Price)
a 2SLS Instrumental Variable Regression; robust t-statistics in parentheses; significance levels 1% (***), 2% (**), 5% (*), 10% (+); all equations include fixed effects for producer, grape variety, and vintage.
Although we think we captured the wines’ quality by controlling for producer, vintage, and grape variety, in column (2) of Table 2, we also report an alternative regression that includes critical scores. However, adding this variable comes at a high cost (i.e., our sample size now drops by almost 85%, from 6,939 to 1,088). In general, the results are similar to those reported in column (1), only all Fairtrade effects are more pronounced.
However, and as already seen in the data discussion of Section II, there is considerable doubt regarding whether being Fairtrade is a random treatment. Given the fact that Fairtrade wines are distinctly different from non-Fairtrade wines in many characteristics, we assume that the Fairtrade treatment is endogenous. We, therefore, instrument being Fairtrade. Our exogenous instruments are regional dummies of the winery location in South Africa as well as the winery's age (i.e., year of first bottling), its size (tons of production) and the share of red wines produced.
Column (3) of Table 2 reports the 2SLS results. The regression suggests an even larger Fairtrade price discount of 67 percent compared to non-Fairtrade wine. Although the age*Fairtrade interaction becomes insignificant in the IV variant, the trend*Fairtrade interaction is now much stronger than in the OLS version. As in the OLS version, we also add the critical score variable to the IV model. As shown in column (4) of Table 2, the number of observations falls to 1,005; except for the critical score variable, all other variables become insignificant.
However, Montiel-Pflueger’s robust weak instrument test suggests a substantial bias for both IV regressions. Given the very low test score, we cannot reject the null hypothesis that the bias in our estimator is greater than 10% of the worst-case bias.
To recap, OLS and IV regressions suggest that i) Fairtrade wine prices are significantly lower than those of their non-Fairtrade counterparts and ii) Fairtrade wines are on a steeper trend line and enjoy larger annual price increases than non-Fairtrade wines. The addition of critical scores to the regressions results in the loss of 85 percent in the number of our observations and seems to add little benefit.
(2) Empirical Analysis of Squared Residuals
Our next step is the analysis of the residuals from the last Section. We square the residuals to only work with positive values and then run the following simple linear regression:
where
![]() $\hat \varepsilon ^2 $
is the squared residuals and u
it
is a random error term.
$\hat \varepsilon ^2 $
is the squared residuals and u
it
is a random error term.
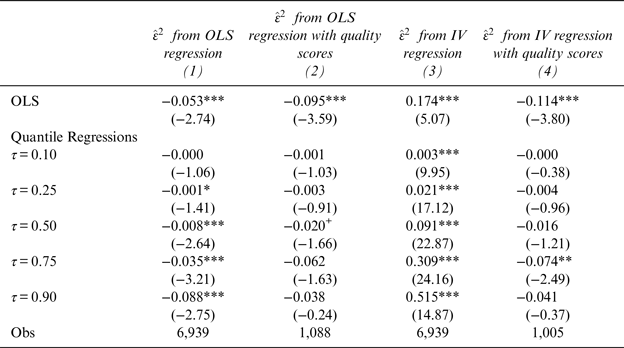
Table 3 reports the results. Note that the column numbers in the table correspond to the numbers in Table 2. That is, in column (1) we regress the squared residual of the first OLS regression (column (1) in Table 2). We employ two different methods, OLS and quantile regressions, to examine varying patterns over the price quantiles.
Table 3
Fairtrade as Determinant of Squared Residuals
![]() $\hat {\bi \varepsilon} ^2$
from Table 2
$\hat {\bi \varepsilon} ^2$
from Table 2
Coefficients b1 of Equation
![]() $\hat \varepsilon ^2 = b_0 + b_1$
Fairtrade
$\hat \varepsilon ^2 = b_0 + b_1$
Fairtrade
OLS and 2SLS Instrumental Variable Approach

a b1-Coefficients of
![]() $\hat{\rm \varepsilon} ^2 = {\rm b}_0 + {\rm b}_1$
; Fairtrade Result of OLS and Quantile Regressions; Significance levels 1% (***), 2% (**), 5% (*). 10% (+)
$\hat{\rm \varepsilon} ^2 = {\rm b}_0 + {\rm b}_1$
; Fairtrade Result of OLS and Quantile Regressions; Significance levels 1% (***), 2% (**), 5% (*). 10% (+)
When regressing the squared residuals obtained from the OLS regression, we find a significantly negative effect of Fairtrade, suggesting that the price dispersion of similar wines is smaller for Fairtrade wines than for non-Fairtrade wines. That result, in turn, could indicate that consumers search more for less expensive Fairtrade wine outlets than they do for regular wine.
When running quantile regression on the same squared residuals, we find similar results. The Fairtrade effect on dispersion is invariably negative and increases in significance in higher price quantiles.
In column (3) of Table 3, we report the OLS and quantile results based on the IV regressions in Table 2, column (3). Now, the sign has turned. In OLS and quantile regressions, we find strong and statistically significant positive Fairtrade effects on the squared residuals, suggesting that Fairtrade wines exhibit substantially larger price dispersions than do regular wines. As shown in the quantile regression, this dispersion-boosting effect appears to grow in higher price quantiles.
For completeness, we also report the results of the analysis of squared residuals as obtained from the equations that contain the critical wine scores (i.e., columns (2) and (4) in Tables 2 and 3). The IV results change and now resemble the estimates based on OLS residuals. Again, due to the entirely different sample size and the loss of many producer and varietal dummy variables, the comparability of the results of column (1) and (2) in Table 2 as well as (3) and (4) in Table 3 is limited. In addition, our confidence in the IV results is limited due to their suspected bias.
B. Separate Equations
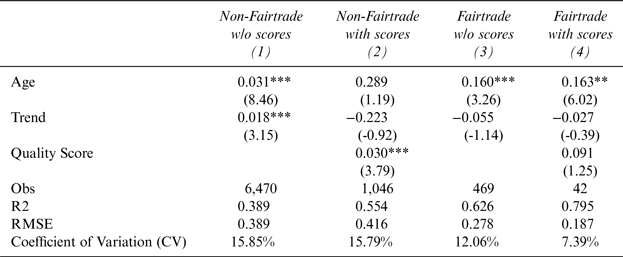
Instead of instrumenting the Fairtrade treatment we now run equation (1) separately for Fairtrade and Non-Fairtrade wines and compare the Coefficients of Variation (CV). Table 4 shows the results for two variants, without and with critical scores. The coefficients of Age, Trend, Score are considerably different between Fairtrade and Non-Fairtrade wines, an effect that, in Table 2, was captured by interactions. Running separate equations also allows for different marginal effects of all other variables. Overall, we find significantly lower CV values for Fairtrade wines than for Non-Fairtrade wines. This is particularly true when we also include quality scores. However, including scores leaves us with a sample of only 42 Fairtrade wines.
Table 4 Determinants of Wine Prices
Separate OLS Equations for Fairtrade and Non-Fairtrade
Dependent Variable ln(Price)

All equations include fixed effects for producer, grape variety, and vintage. RMSE root mean squared error.
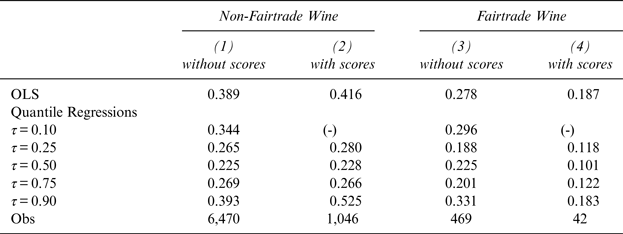
Table 5 reports the CV values for separate quantile regressions of Fairtrade and Non-Fairtrade wines. Again, in all quantiles and both variants, i.e., with and without quality scores, Fairtrade wines display smaller CV values, indicating a smaller price dispersion.
Table 5 Coefficients of Variation for Fairtrade Wine and Non-Fairtrade Wine
Results of Separate OLS and Quantile Regressions
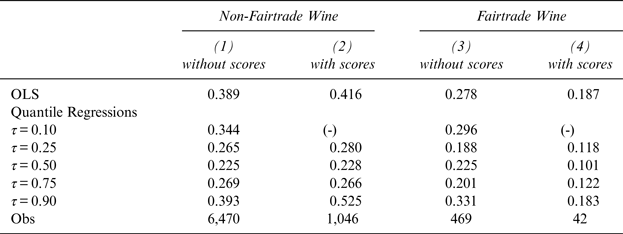
Coefficients of Variance based on equation (1) run separately for Fairtrade and Non-Fairtrade wines; (-) no convergence.
IV. Summary
This paper analyzes wine price dispersion in the United Kingdom, the world's largest market for Fairtrade wine. We analyze whether Fairtrade wines exhibit a higher degree of price dispersion than do non-Fairtrade wines. This result could be due to lower search activities, because Fairtrade contains some social attributes in addition to its tangible value. That is, consumers might be willing to tolerate above-average prices due to the positive social connotation of Fairtrade.
We approach this issue by first running a hedonic regression to explain wine retail prices. We then take the unexplained part (i.e., the [squared] residuals) and regress it over a Fairtrade dummy variable. A positive Fairtrade effect on the squared residuals would indicate a higher price dispersion level for Fairtrade wines, and vice versa.
Our results are conflicting. Our results based on OLS suggest that Fairtrade wines’ price dispersion is lower compared to that of regular wines, our results based on IV regression indicate the opposite. However, since we cannot reject the null hypothesis of a substantial bias in our IV regression, we suspect that our instruments are weak and have little trust in our 2SLS estimates.
In order to abolish the requirement for any instrumentation, we finally ran two separate hedonic equations, one for non-Fairtrade wines and one for Fairtrade wines. A comparison of the respective coefficients of variation (CV) lends support to our original OLS results and suggests that Fairtrade wine prices are, in fact, less disperse.
We do not include dummy variables for retail outlets, because doing so would substantially restrict the remaining degrees of freedom in all regressions with various entailing complications. However, investigating the retail outlet structure seems to be a useful extension of this work. Not only may the number of Fairtrade and non-Fairtrade outlets be different; their locations may be as well. Thus, one may imagine a situation where wine stores that carry Fairtrade wines are regionally less dispersed than others, giving Fairtrade stores a lower degree of monopoly power. Likewise, wine retail outlets that carry Fairtrade wines may be located predominantly in low-income neighborhoods. This situation, in turn, could lead to less price dispersion and render our “consumer search” explanation doubtful.


