


Introduction
Despite the rise in bank branches and the prevalence of online banking, many households go unbanked. The Federal Deposit Insurance Corporation (FDIC) estimates that 7 million US households do not have a bank account and that another 20 million are underbanked (they have a bank account, but still rely on alternative banking services, such as payday loans, check cashing services, etc.). These households have long been a concern for policy makers, and this article provides an empirical history of one service intended to reach them: the US Postal Savings System (1911–67). Offering a federally insured savings alternative, the program was aimed at the unbanked and marginalized portions of the population, and its reestablishment has become an increasingly prominent prescription to address the gap in affordable banking options for low-income households. This article builds on detailed narrative histories of this program with a new post office–level data set on postal deposits to provide the first comprehensive account of who made use of the system’s services throughout its lifetime.
Following a renewed academic interest in Postal Savings (Baradaran, Reference Baradaran2013, Reference Baradaran2014; Garon, Reference Garon2012), policy makers began to recommend its reestablishment. A 2014 US Postal Service (USPS) Inspector General report, championed by Senator Elizabeth Warren, outlined how the USPS could fill the banking needs of small depositors. The establishment of a program was part of Bernie Sanders’s 2016 and 2020 US Democratic presidential primary campaign platforms.Footnote 1 Sen. Kirsten Gillibrand proposed legislation in 2018 that will reinstitute a savings offering at post offices and also allow check-cashing and loan services. Despite the renewed interest, there has been no detailed statistical analysis of the US Postal Savings System from which policy makers could draw lessons.
The literature on Postal Savings can be divided into two strands. First, there are narrative studies on the origin and general patterns of the system. Writing just a few years after the system began, Kemmerer (Reference Kemmerer1917) discusses the establishment of the system and the demographic makeup (e.g., nativity, age, and geographic location) of initial depositors. He provides an analysis of the legal structure of the system, and how it was starting to fit into the broader financial system. Looking back on the system a few years after its dissolution, Schewe (Reference Schewe1971) provides a thorough account of the aggregate trends in postal deposits over its lifetime. He argues that while Postal Savings provided a valuable service, promoted thrift, and earned a profit, its popularity was primarily tied to its security and the introduction of the FDIC in 1933 rendered the service redundant.
The second strand of literature examines how the system competed with commercial banks. Sissman (Reference Sissman1938) and O’Hara and Easley (Reference O’Hara and Easley1979) argue that more traditional banking institutions saw Postal Savings as a competitor during the Great Depression as its fixed interest rate was relatively high in the low interest rate environment. Sissman (Reference Sissman1936) measures changes in Postal Savings usage at the state level from 1911 to 1935, asserting that growth in postal deposits was tied to bank failures. Kuwayama (Reference Kuwayama2000) shows that lower interest rates and more bank failures were associated with greater deposits during the 1911 to 1935 period but that only interest rates remained important after 1936, suggesting a large impact of the FDIC. Using town-level data on postal deposits for several states, Davison and Ramirez (Reference Davison and Ramirez2016) find that postal deposits rose more in places without deposit insurance after a commercial bank failure, indicating that depositors gravitated toward postal deposits when commercial bank stability was called into question.
The existing literature provides a rich narrative history of the system and many important insights into its operation, yet both strands of the literature have their drawbacks when trying to understand who benefited from Postal Savings. Many of the key conclusions in the narrative-driven studies have not been tested at the disaggregated level necessary to sort through competing hypotheses. For instance, the typical narrative argues that the system was used heavily by immigrants and urban residents in its early years, but due to the high positive correlation between these two factors, they cannot be separated in bivariate comparisons, nor do any studies measure how user demographics changed over time. To disentangle different demographic and economics characteristics of depositors and to determine whether Postal Savings reached the unbanked and marginalized populations, post office– or county-level data are needed.
Publicly available information from Historical Statistics and other sources covers the aggregate amount of deposits and depositors, but does not provide the level of detail necessary to undertake an analysis of who used the US Postal Savings System throughout its lifetime. As such, we have collected post office–level depositor data as well as state-level data on deposit inflow, withdrawals, and redeposits from 1911 through 1966 to provide a comprehensive empirical analysis of who used postal deposits. We link the Postal Savings data to city-level data on banks (which include commercial banks, trust companies, and savings banks) and county-level information on demographic and economic characteristics. The new post office–level data allow us to identify several factors that are not visible in the aggregate data used in previous papers.
In examining the entire history of the system, we find that Postal Savings underwent several shifts in how and by whom it was used. In the program’s early years, Postal Savings was heavily used for short-term deposits as well as by foreign-born people, who avoided traditional banks. The 1929 Crash was followed by a surge in postal deposits and a shift in how the system was used. By 1936, the association between foreign-born populations and postal deposits weakens as the system became more popular with farming communities and whites. When interest rates dropped in the 1940s, depositors placed even more money into the Postal Savings System. The demographic evidence indicates that there was a shift over time in the usage from the marginalized and unbanked individuals that used postal depositories for short-term savings, to the wealthier individuals that used postal deposits as a way to earn reasonable returns on medium- to long-term investments in the low interest rate environment during the Great Depression and World War II. We also find that several changes to the program, including the decision to close thousands of Postal Savings offices and to increase the account maximum, led to changes in how the program was used.
Focusing more specifically on banking accessibility, we also find that the establishment of a bank, especially a national bank, decreased postal deposits. However, the lack of banking alternatives does not explain all or even most of people’s usage. Postal Savings was not only used by those without access to banks, as most postal customers lived near enough to other banks to make use of them. Moreover, we find that people particularly turned to Postal Savings during periods of banking instability, or in places where state deposit insurance programs were not in place. This implies risk aversion was also a factor in savers’ choice of banking services.
Throughout this article, we attempt to understand who the main beneficiaries of postal savings were using a variety of narrative and empirical approaches. The article proceeds as follows: “Legislative History” provides a historical background on how the US Postal Savings System was created to explain who postal deposits were intended to benefit and its place in the US financial system. “Data” describes the data that we collected on postal deposits, commercial banks, and demographics. “How Was Postal Savings Used throughout the Years? uses national- and state-level data to form hypotheses as to why Postal Savings was used in different ways in various historical periods. Finally, “What Groups Used Postal Savings?” examines county- and city-level information on postal deposits to see whether marginalized populations (e.g., immigrants, black people) and individuals in locations without commercial banks relied on the system. The last section concludes.
Legislative History
Before diving into the empirical analysis of who used Postal Savings, we need to understand why the legislation was passed, how it was structured, and who it was meant to benefit. We draw from the existing narrative literature (especially Kemmerer [Reference Kemmerer1917] and Schewe [Reference Schewe1971]) as well as official USPS reports, contemporary newspapers, and various government documents.
Postal savings systems existed for decades in other countries before the program was instituted in the United States. The first postal savings bank was established in 1861 in the United Kingdom, and aimed at small-scale depositors. The system proved popular, with 11 million of the 21.9 million Britons holding accounts totaling the equivalent of $781 million in 1908 (National Monetary Commission, 1910). Many countries and colonies around the world established postal savings systems with similar characteristics.
While US lawmakers and government officials advocating for Postal Savings initially highlighted the profitability of international systems, the Panic of 1873 reframed the discussion of postal depositories toward the security offered to savers. In his 1873 report, John A. Creswell, the Postmaster General under President Ulysses S. Grant, emphasized the safety of postal deposits and how it was a solution to the problem of savers hiding their money rather than depositing it in banks (Post Office Department, Annual Report of the Postmaster General, 1873). President Grant explicitly advocated his postmaster’s plan in his 1873 Annual Message to Congress.
Banking instability continued to be a central argument made by postal bank advocates. In 1878, Rep. Thomas J. Tipton (R-IL) articulated the need for safety:
[P]eople all over the country will be afforded an opportunity to invest their savings with assurance that the principal will be returned with a small interest…. The failure of savings banks and consequent loss, especially to the poorer class, makes the demand greater than ever before…. They simply desire a safe depository of their small earnings until the accumulation shall enable them to purchase a lot of ground on which in time they can build a home for themselves and their families. (U.S. Congress, 1878: 1680)
Another selling point of Postal Savings was the belief that it would increase money in circulation. Postmaster General James Gary said:
Have you ever thought what a dead thing money is when it is not in use? It is the deadest thing in the universe. There are many millions of such dead money in the country. It is hoarded away in stockings, buried under the hearthstones, tucked away behind the rafters and planted here and there in the earth, because the owners have no faith in private savings institutions. They have faith in the government, and they would bring the money out and deposit it in the postal savings banks. (Los Angeles Times, 1897)
The only people who would be hurt by the system, he argued, were owners of “grogg shops and tobacco stores.”
The nation’s banking sector opposed postal savings. Bankers had considerable political clout, especially after the establishment of the American Banking Association (ABA) in 1875.Footnote 2 They argued that postal savings would siphon money out of communities. A 1907 criticism of postal savings quoted the London Banker’s Magazine: “The branches of the Post-Office Savings-Bank convey all the savings of the district which they receive straight up to the central office in London … it is thus removed from the district in which it originates” (Roberts, Reference Roberts1907).
Other critics argued that postal depositories (indeed, any federal bank) would be unconstitutional.Footnote 3 One potential solution was to use postal savings funds to purchase government bonds (Schewe, Reference Schewe1971: 78). However, because the United States did not have a permanent debt, some worried that a postal savings system could quickly exhaust the supply of government bonds. A 1898 newspaper editorial noted, “[T]he chief objection now advanced against the scheme is the fear that proper investment could not be found for the funds, and that as a result a vast sum would congest in the hands of the Government upon which it could pay no reward to the depositors, and thus it would become a source of danger” (Sacramento Record-Union, 1898).
From 1873 to 1906, 59 bills establishing postal savings were proposed to Congress, yet none went to a vote.Footnote 4 Two factors broke the inaction. The Panic of 1907 increased calls for banking reform, and the election of William Howard Taft in 1908 provided a friendly benefactor for postal savings. Taft not only supported the system but was also the governor of the Philippines when a postal savings bank was established there in 1906 (Schewe, Reference Schewe1971: 59).
The Postal Savings Bill (Senate Bill 5876) was passed on June 9, 1910, with Republicans largely supporting the bill and Democrats opposing it. The final structure of the program showed the compromises legislators made to maintain broad support. To appeal to bankers, most postal deposits were to be redeposited in local banks,Footnote 5 interest rates were kept low (2 percent), and balances were capped at $500. To appease those who worried about the program’s constitutionality, a portion of postal deposits were invested in national debt, depositors could convert their deposits into Treasury bonds, and banks receiving postal deposit funds were required to purchase bonds as security. Deposits were insured by the federal government, meaning if a bank holding postal deposits closed, postal customers’ accounts with the post office were unaffected.
Data
While previous studies have made use of some postal deposit aggregates, we constructed a comprehensive set of all available Postal Savings data. The data are drawn from Annual Reports on the Operation of the Postal Savings System and include all data on depositor behavior reported by the Post Office Department at the finest geographic level available. Our post office–level data include the annual amount of deposits and number of depositors for all post offices in the United States. To obtain each location’s approximate latitude and longitude we matched post offices by name and state to a list of populated places maintained by the US Board on Geographic Names and to the list found in the AniMap 3.0.2 County Boundary Historical Atlas, as well as using Nominatim’s and Google’s geocoding application programming interfaces.Footnote 6 The state-level data contain annual figures for deposit inflow, withdrawals, reinvestment in banks, and bond conversions. At the national level, we have monthly deposit data.
We paired postal deposit data with a data set of city-level information on banks from 1913, 1919, 1929, and 1940 using the Rand McNally Bankers Directory for each year. These directories provide the location of the more than 35,000 unique banks in operation, as well as whether they were chartered by a state legislature (state bank, trust company, or savings bank) or the Comptroller of the Currency (national bank). The data allow us to construct a measure of the presence of banking in any city or county.Footnote 7 We matched these as described in the preceding text to obtain each city’s latitude and longitude.
Finally, we added information on population, demographics, and economic characteristics, using the county-level census information collected by the US Census Bureau and digitized by Haines (Reference Haines2010) as well as county-level bank data from the FDIC (1984). Summary statistics can be found in appendix table A1.
How Was Postal Savings Used throughout the Years?
The first Postal Savings depositories were established on January 3, 1911, and the system was fully rolled out over the next two years. Figure 1 shows the overall pattern of deposits over time, characterized by three distinct periods of usage: 1911–29, 1930–41, and 1942–66. From 1911 through 1929, the program alternated between periods of slow growth and stagnation. The program experienced a surge in popularity during the Great Depression as depositors sought guarantees on their funds. A second surge occurred in the 1940s, when the historically low interest rates during the war turned postal deposits into an appealing investment, followed by a prolonged decline until the program ended in 1967.

Figure 1. Deposits in Postal Savings System.
In this section, we attempt to use state- and national-level data to shed light on the various reasons for the patterns of usage. In particular, we are interested in understanding more generally when postal deposits were popular and how they were being used before turning to regression analysis.
A Slow Start: 1911–29
Over this period, postal deposits were a small part of the total deposits in the banking system. In 1916, $86 million ($1.3 billion in 2015 dollars) was deposited at postal depositories in compared to $12 billion ($291 billion in 2015 dollars) in state and national banks (Treasury Department, 1917). Despite the relatively low total value of postal deposits, more than 300,000 depositors used the program each year, and more than 9,000 post offices had at least one depositor during this period. Use in this period seems to have best reflected what the supporters of the system envisioned: giving people a safe place to hold a relatively small amount of savings.
Figure 2(a) shows the regional breakdown of Postal Savings usage trends through 1929, while a snapshot of the county-level use of Postal Savings in 1919 can be seen in figure 3(a). The program was most popular in the West and Northeast. The popularity of the program peaked in 1917, then stagnated through the early 1920s. After 1925, this stagnation gave way to strong increases everywhere but in the Northeast.Footnote 8 Overall, the large variation between regions indicates that Postal Savings usage responded to location-specific factors.Footnote 9

Figure 2. Postal Savings deposits per capita by region: (a) 1911–29, (b) 1930–40, and (c) 1941–66.
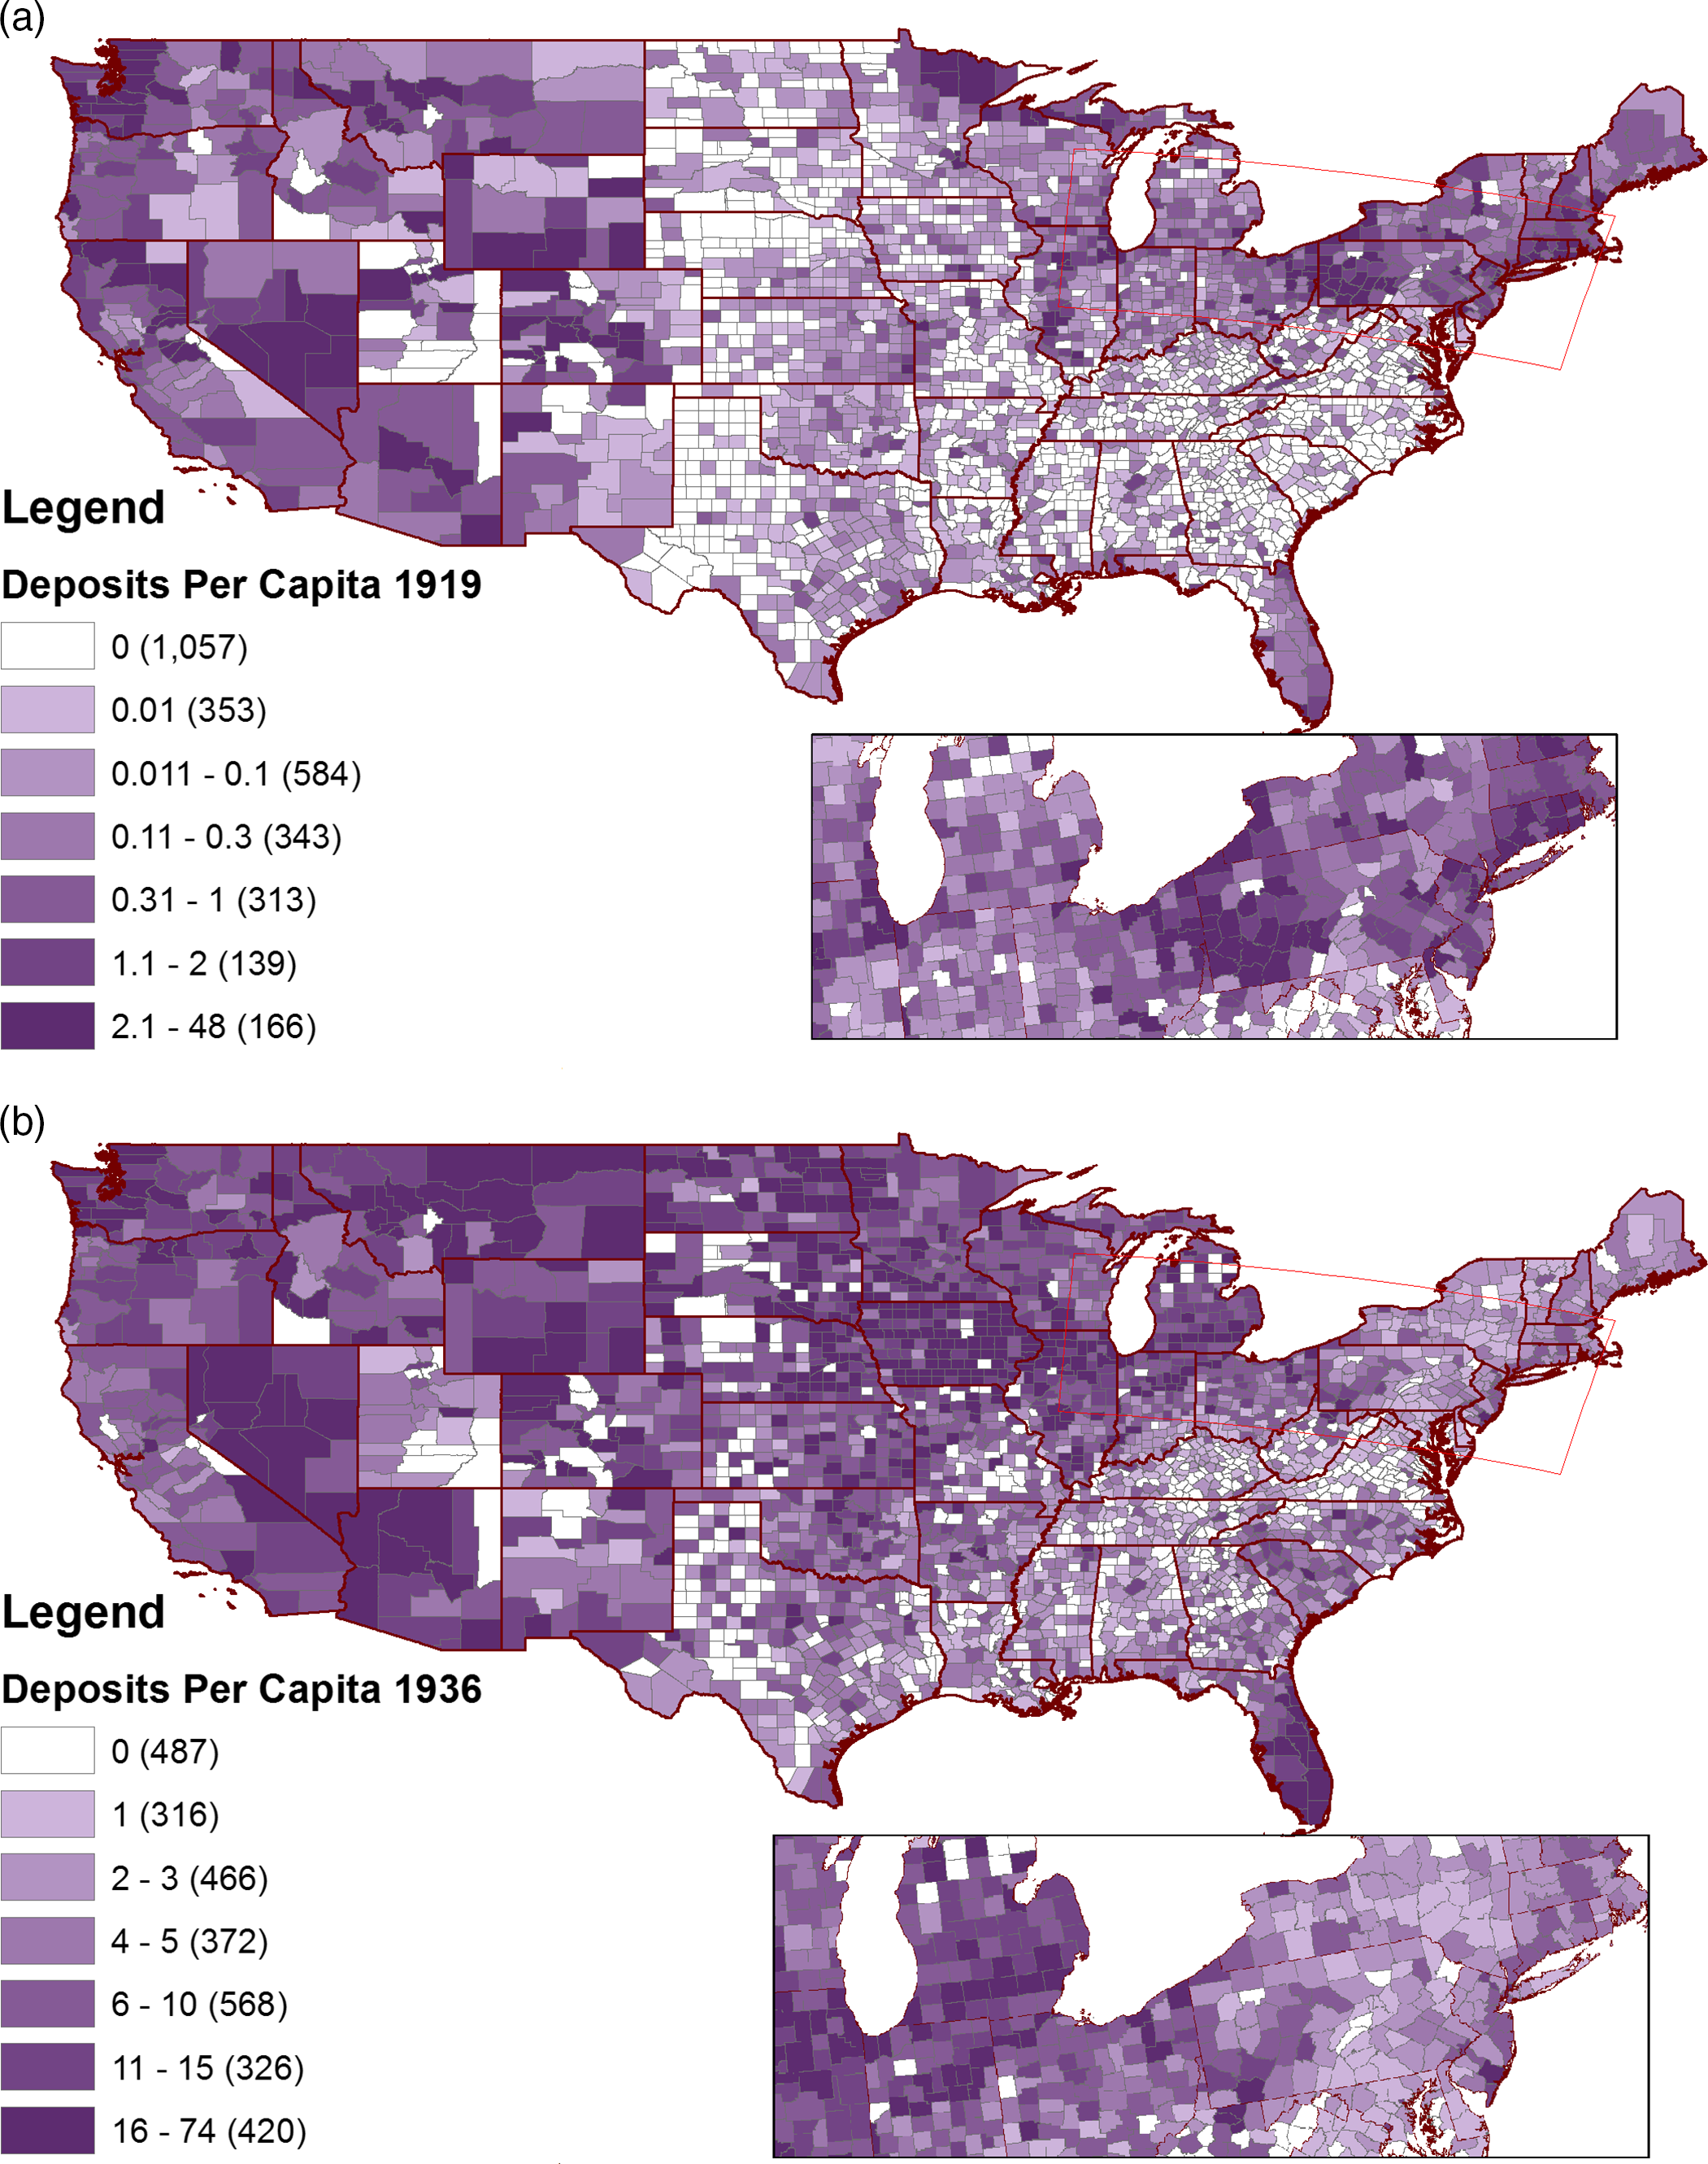
Figure 3. County-level distribution of Postal Savings deposits: (a) deposits per capita 1919 and (b) deposits per capita 1936.
Much of the regional variation in Postal Savings usage coincided with fluctuations in the safety of commercial banks. For example, in the four years following the collapse of the Florida real estate bubble in 1925, real postal deposits in the state grew by 600 percent. Contemporary accounts (The St. Louis Star and Times, 1924) attributed the popularity of Postal Savings to a desire for security following bank failures. Davison and Ramirez (Reference Davison and Ramirez2016) find that state deposit insurance systems affected postal deposit demand following bank failures in those states. Between 1908 and 1920, Kansas, Mississippi, Nebraska, North Dakota, Oklahoma, South Dakota, Texas, and Washington imposed some kind of deposit insurance system. Four of these states (Mississippi, North Dakota, South Dakota, and Washington) implemented deposit insurance after the start of Postal Savings, and in the year following the implementation of deposit insurance, postal deposits in these states grew 16.5 percent less than in other states. The collapse of these deposit insurance systems in the 1920s correlated with even larger increases in postal deposits (50 percent faster in the year following the discontinuation than in other states). This suggests that the relative security of postal deposits affected the demand for postal deposits.
In addition to security, Postal Savings offered convenience. The USPS created depositories at more than 13,000 post offices by 1913, and the distribution filled existing geographic gaps in banking services. In 1913, the average depository with at least $1 on deposit was 4 km from the nearest state bank and 11 km from the nearest national bank. However, many post offices (especially fourth-class post offices) saw no deposits. As a result of low usage, thousands of depositories were removed, bringing the number of depositories in 1917 to 7,161. Fourth-class post offices were specifically targeted for removal. Because post office classes were a function of revenue, this meant that low revenue-generating post offices lost their Postal Savings designation, while otherwise identical third-class post offices did not. A significant regional variation existed in the pattern of closed offices. More than 60 percent of Southern offices closed, while less than one-third of offices in the Northeast closed. One effect of this was that black people were significantly more affected by closures. In 1913, about 13 percent of black people lived in counties without any postal deposits (compared to a nationwide average of 4 percent); by 1919, more than 30 percent did (while the nationwide average was 12 percent).
Postal Savings’ popularity appeared to be hampered by two factors: the $500 limit on deposits and the program’s interest rate structure. In 1915, 30,000 of the 525,000 depositors had reached the $500 limit (U.S. Congress, 1915). According to one local postmaster, “[I]f the limit were raised from $500 to $1,000 for each depositor, it would increase deposits, as I have had several that would not deposit because they could not deposit over $500” (Dockery, Reference Dockery1916: 44). The cap was increased to $1,000 in 1916, and the real value of deposits grew by 44 percent in the following year. The cap was again raised to $2,500 in 1918 but a similar jump in deposits did not occur, suggesting that the deposit limit was no longer a binding constraint.
With the exception of 1915 and 1929, the USPS provided no records on how many accounts were at the limit. In 1929, only 2.7 percent of accounts held the $2,500 maximum. Because the average account size in 1929 ($374 in nominal dollars) was close to the highest observed average deposit size for any preceding year, it is unlikely that accounts holding the maximum deposit constituted any more than 3 percent of all accounts during this period. For a better picture of how many accounts were at the limit at other points, we estimated the number of accounts holding the maximum amount using the procedure described in the appendix. The estimated number of maximum deposits in 1919 was only 0.54 percent of all accounts, and stayed relatively unchanged until the late 1920s when it rose to 2–3 percent.
The structure of interest payments also lessened the attractiveness of the system, especially for short-term depositors. Initially, the 2 percent simple interest rate only accrued annually, increasing the opportunity cost of short-term deposits. Beginning in 1921, depositors were allowed to transfer funds from one post office to another without losing interest and, starting in 1924, interest was credited on a quarterly basis.
Despite the penalty for holding funds for less than a year (before 1924), the average postal depositor withdrew their funds in less than 12 months. The volume of deposits and withdrawals, as seen in figure 4, also suggests substantial short-term holdings. Through the 1930s, the sum of total withdrawals and deposits was more than 120 percent of the balance held within the system, indicating large within-year movement into and out of the system.Footnote 10 For example, in 1915, at least 56 percent of money withdrawn from the system earned no interest at all. Year-end snapshots therefore understate the total amount of money that passed through the system, especially in times of distress (i.e., following the 1920–21 depression and the 1929 Stock Market Crash).
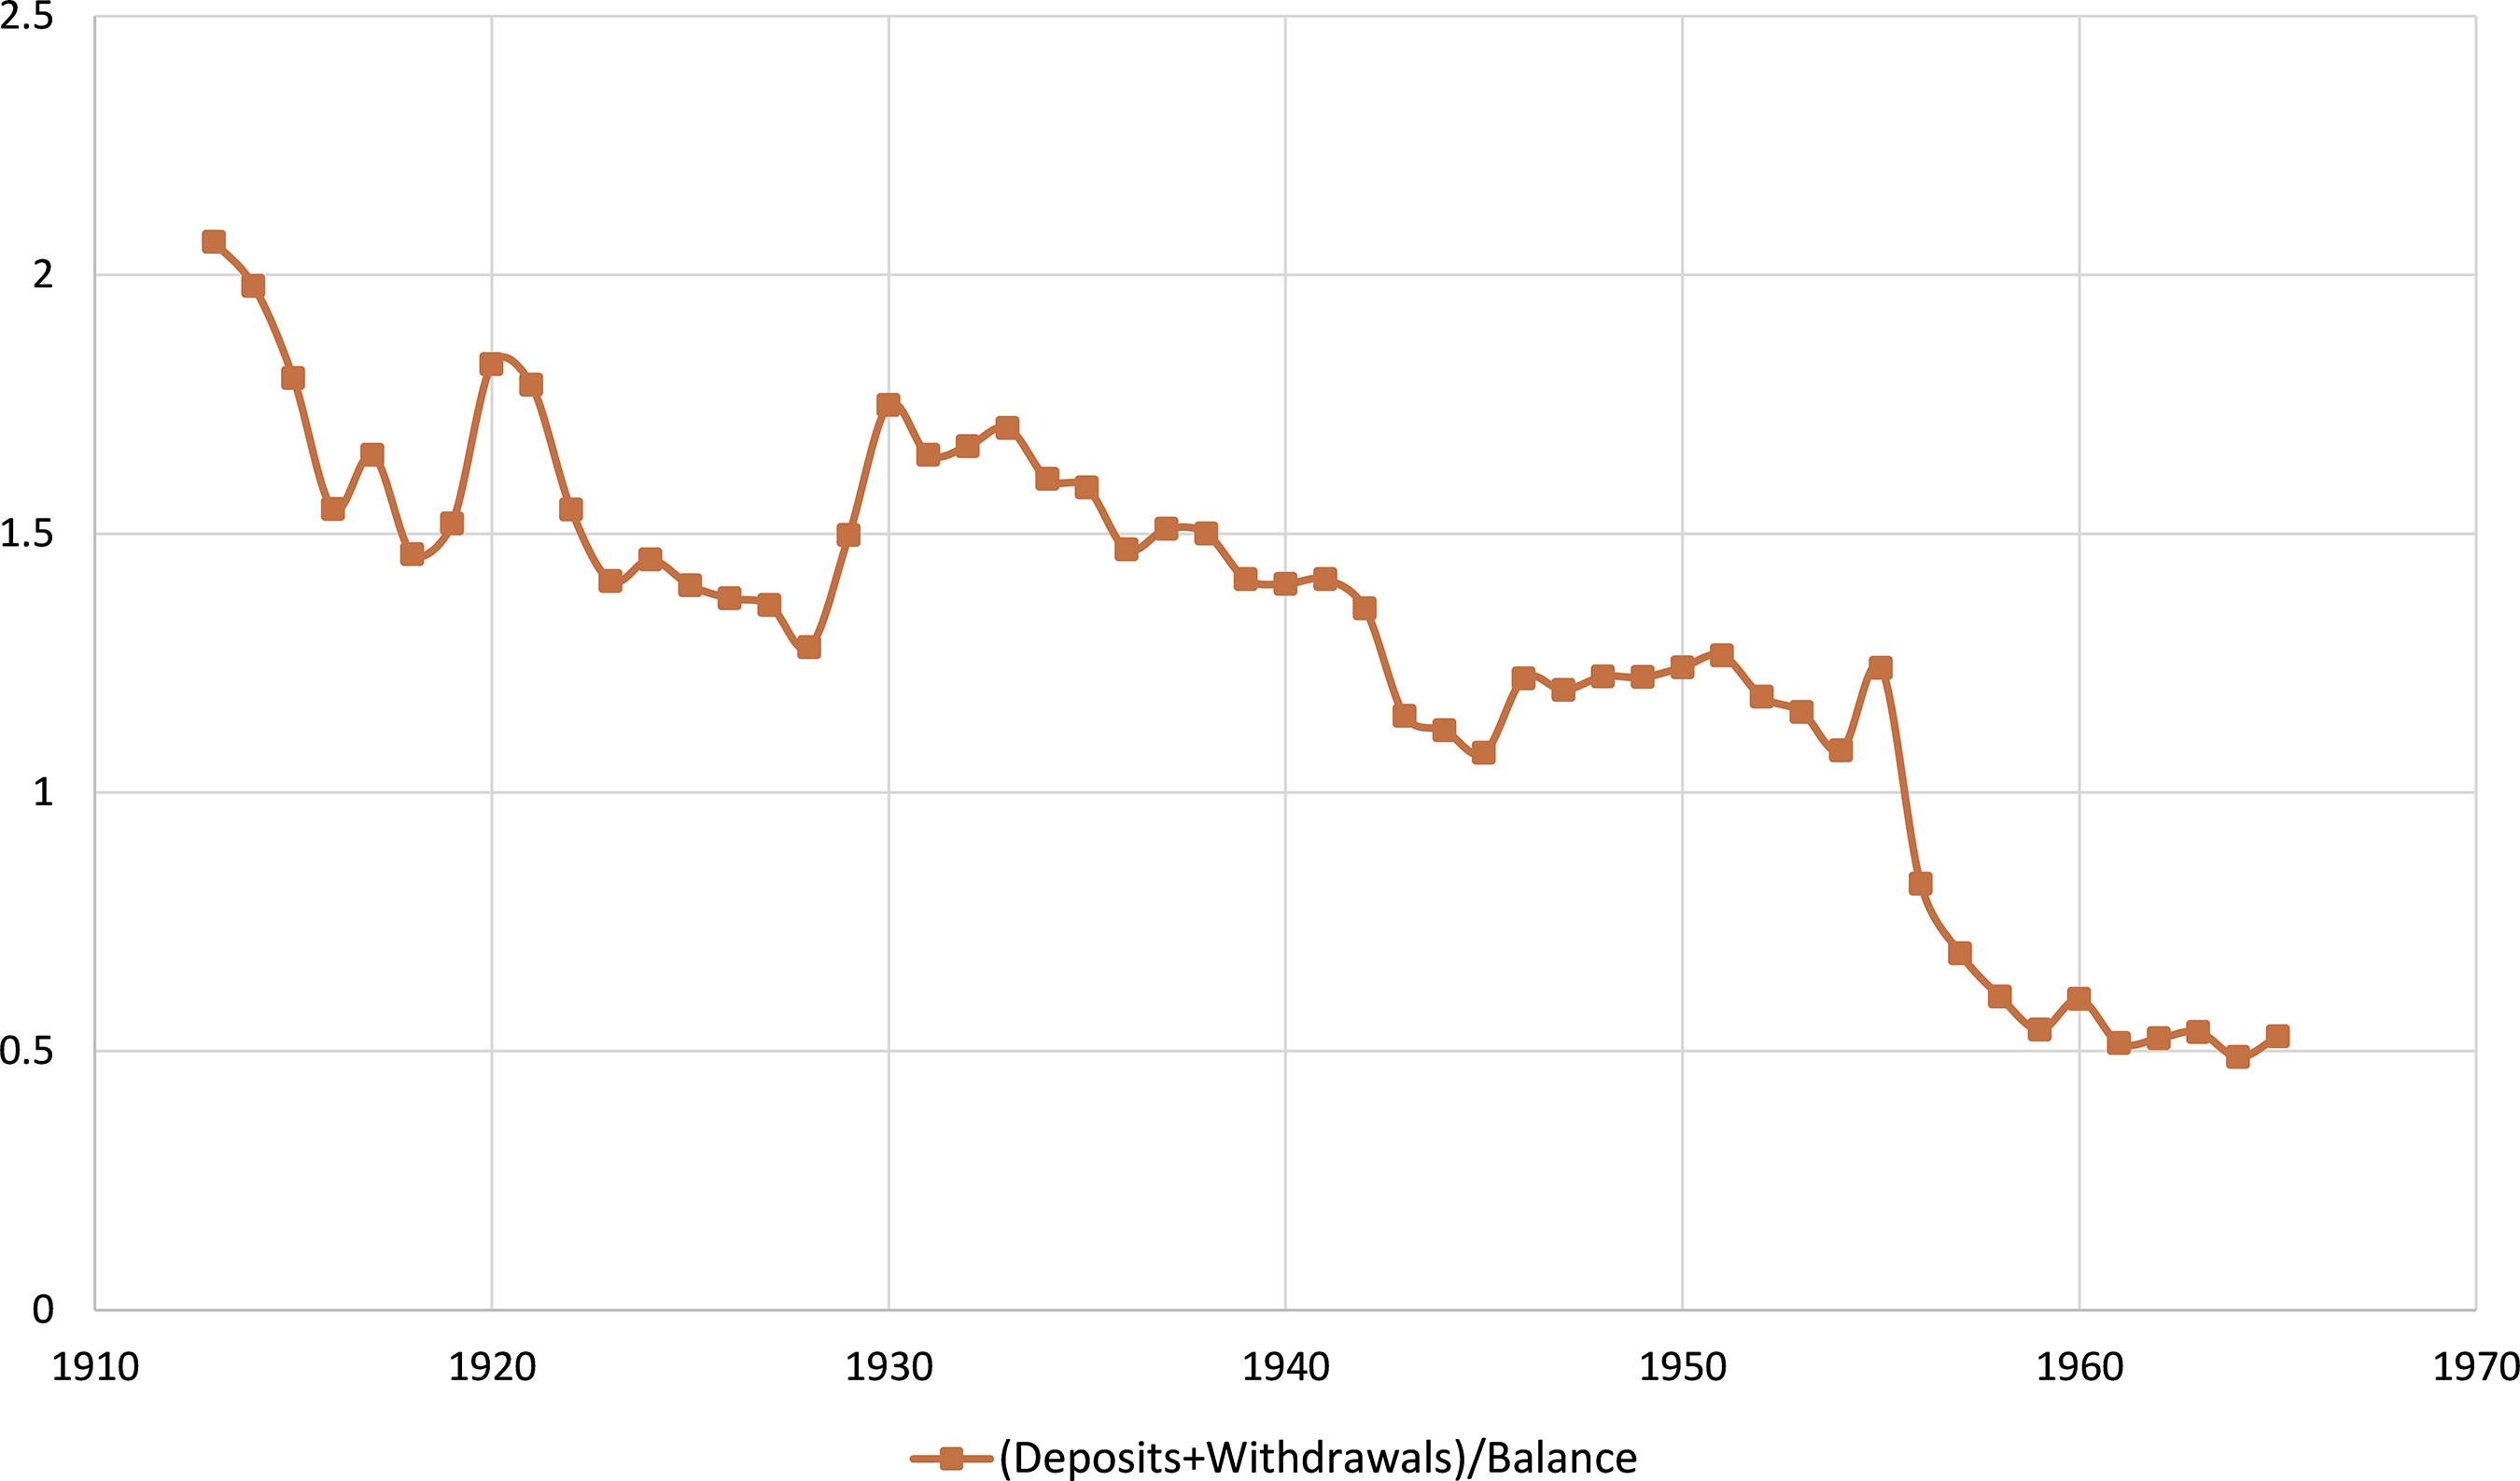
Figure 4. Yearly activity in the Postal Savings System.
Bond redemption data also indicate that depositors used postal deposits for short-term liquidity, rather than as the long-term savings tool designers of the program envisioned. Because deposits could be redeemed for 20-year bonds, which had a 2.5 percent yield, long-term depositors would make more money with bonds than ordinary deposits and carry no additional default risk. However, bonds never gained popularity in the period for which the data were reported (1912–35). In any year, less than 2 percent of deposits were converted to bonds, indicating that most depositors sacrificed higher interest payments in exchange for liquidity.Footnote 11 The use of postal deposits for small-scale, short-term deposits is consistent with the system’s popularity with working-class immigrant populations, which had been heavily affected by the failure of immigrant banks during the Panic of 1907. Immigrants were heavy users of the system, and had previously been using postal money orders while avoiding commercial banks. When Postal Savings was being planned, postmasters flooded the federal office with letters claiming that immigrants, who were using money orders to send money to foreign bank accounts, would use a Postal Savings system if it was offered (Committee on Post-Offices and Post-Roads, 1910). Between 1900 and 1911, the amount of money (in nominal dollars) leaving the United States through postal money orders increased by 483 percent, while domestic money orders increased by a comparatively small 147 percent. Following the establishment of Postal Savings, this increase in outbound transfers stopped. Domestic money orders increased by 15 percent from 1911 to 1914, while foreign-bound money orders decreased by 7 percent (Post Office Department, Annual Report of the Postmaster General, 1920).
Once the United States ceased money orders to many European countries during World War I, there was significant growth in postal deposits, especially in cities with larger immigrant populations. Among the cities with at least 250,000 people in 1910, the five cities with the fastest growth in postal deposits had an average of 32.6 percent foreign-born residents, while the five cities with the slowest growth had only 19.5 percent. Given the popularity of Postal Savings among immigrants, immigration restrictions in the 1910s and 1920s likely limited the growth of the system. Nonetheless, the USPS began making efforts to attract more business from immigrants. Following a large private bank failure in New York City in 1923, the USPS initiated an advertising campaign in foreign languages to draw new customers (Freeport Journal-Standard, 1923). We explore the question of who used the Postal Savings System further in “Demographics.”
A Sudden Shift: 1930–41
Banking instability was a worry through the 1910s and 1920s, but the events of 1929 and 1930 turned bank safety into a primary concern. Consequently, use of the federally backed Postal Savings System changed considerably. The 1929 Stock Market Crash and ensuing run on commercial banks in 1930 coincided with a large rise in postal deposits. Between 1930 and 1934, the amount on deposit increased by almost 760 percent in real 1913 dollars (584 percent in nominal dollars) from $103 million to $887 million. The number of postal depositors increased from 0.9 percent of all bank savings accounts to 6 percent (Sissman, Reference Sissman1936). Lawmakers saw this surge in postal deposits as a flight-to-quality. For example, Rep. Emanuel Celler of New York stated that, “While banks were failing all over the country and a veritable avalanche of funds came out of other banks, it was the Postal Savings System that salvaged much of the money withdrawn by the frightened and the timid” (U.S. Congress, 1931: 235).
Between 1928 and 1930, the total balance of deposits (provided by the year-end snapshots) increased by 15 percent, yet the total amount deposited and withdrawn from the system, as shown in figure 4, increased by 55 percent. Once again, depositors increasingly relied on Postal Savings for short-term savings during times of financial distress.
The Postal Savings System was also gaining millions of new customers. The growth of postal deposits was mostly due to an increase in depositors, instead of existing depositors increasing the size of their deposits. Almost 70 percent of the growth in the total balance of postal deposits in 1930–33 is explained by an increase in the number of depositors. In the Midwest, where postal deposit growth was the highest during the period, the growth was almost completely due to an increase in the number of depositors (99 percent).
This increase in deposits in the early 1930s was greatest where the Depression was most severe. Using the difference in county-level log retail sales between 1929 and 1933 from Fishback et al. (Reference Fishback, Horrace and Kantor2005), we find that a 1 percent drop in retail sales corresponds with a 130 percent increase in postal deposits. As a result, by 1933, people in the Mountain and East South Central states held about $15 per capita on deposit, while New England and South Atlantic states had $5.80 per capita.Footnote 12 Figure 3(b) shows that the South’s use of the program was still low compared to the rest of the nation but that many more southern counties had deposits than did in 1919. Few counties have zero deposits, and the Northeast no longer had highest level of deposits, which can also be seen in figure 2(b).
The continued low usage of postal deposits in the South may have stemmed from the USPS’s decision to close thousands of offices from 1914 to 1917. The case of South Carolina suggests that southern states experienced low per capita deposits because of closures more than a decade earlier, not because demand in these places was necessarily lower. South Carolina lost 81 percent of its Postal Savings depositories, and had 1 depository per 51,000 people in 1929, compared to a nationwide average of 1 for every 22,000 people. While South Carolinians had below average per capita deposits ($0.88 compared to $1.27), the average depository in the state held significantly more than the average in other states ($44,118 compared to $25,785). Overall, states that lost higher percentages of postal depositories from 1914 to 1917 had fewer depositories per capita in 1929, and this lack of access may have depressed postal deposits.
Though the rapid rise of postal deposits halted after the establishment of the FDIC in 1933, the total number of depositors and nominal balances increased every year until 1938. This increase was driven by the Midwest, which saw real per capita deposits rise 21 percent between 1933 and 1940, while the rest of the country averaged an 11 percent decrease over the same period. These increases also seem to be tied to banking safety: 54 percent of all FDIC-reported bank failures took place between 1934 and 1939 happened in the Midwest (FDIC, 2017).
In the 1930s, banks began to refuse Postal Savings funds, finding the 2.5 percent interest that they had to pay for postal deposits too costly (Friedman and Schwartz, Reference Friedman and Schwartz1970). By 1939, only 5 percent of postal deposits were redeposited. The USPS instead used deposits to purchase US Treasury bonds and notes, which offered yields high enough to fund the Postal Savings System. Between 1931 and 1941, the USPS increased their holding of Treasury bonds and notes from $0 to $1.1 billion, during which time the total outstanding of nonspecial bonds and notes increased from $16.52 billion to $43.05 billion. As such, the Postal Savings System seems to have funded an economically significant portion (4.18 percent) of New Deal spending.
Rise and Fall: 1942–66
While the safety of deposits drove how Postal Savings was used in its first 30 years in operation, economic changes in the 1940s drastically altered the place of Postal Savings in American finance. Between 1942 and 1947, deposits grew by 90 percent in real dollars (158 percent in nominal dollars). As shown in figure 2(c) all regions saw increases between 44 percent and 99 percent, cresting in the late 1940s followed by a prolonged decline through the remaining years of the program. Despite the safety of commercial banks, the number of customers, amount on deposit, and average account size all peaked during this period. While some of this increase could be explained by an increase in overall savings rates during World War II, the increase in postal deposits continued through 1948, when overall savings rates reverted back to their prewar levels.Footnote 13
While the growth in postal deposits following the 1929 Crash was due to new depositors, 70 percent of the 1940s increase was caused by an increase in the average size of deposits. By 1948, the average postal depositor had $816 in the system, and fewer than 4 percent of post offices had average deposit sizes below $200.Footnote 14 This suggests that the system was used by people with above-average incomes. The 1948 Survey of Consumer Finances supports this view, as respondents who had money in postal saving had, on average, 6 times as much in other savings bank accounts and 12 times as much in checking bank accounts as those who did not have Postal Savings accounts.
Likewise, we estimate that by 1949, 24 percent of all accounts held the maximum amount, constituting approximately two-thirds of all of the money deposited in Postal Savings.Footnote 15 These numbers suggest that the size of Postal Savings was constrained by the $2,500 limit on deposits. While some unbanked or underbanked households may have used Postal Savings during this period, the service was mostly used by wealthier individuals.
While the Postal Savings boom in the early 1930s followed a large number of bank failures, banks were much safer in the 1940s. Instead, low returns on investments made postal deposits more attractive. The 2 percent interest rate offered by Postal Savings was meant to ensure that the system did not compete with banks. However, Congress did not predict the arrival of an extremely low interest rate environment. The Federal Reserve committed in 1942 to keep market rates extremely low to allow the government to borrow at cheaper rates during World War II. The prime rate was generally under 2 percent from 1940 to 1948, and the yields on high-grade municipal bond rates were generally under 2 percent from 1943 to 1947. Moreover, the installation of Regulation Q in 1933 prohibited the payment of interest on demand deposits and installed an interest rate ceiling on time deposits of 3 percent in 1933–34 and 2.5 percent afterward. However, the ceiling was not binding as most commercial banks were providing much lower interest rates during the 1930s and 1940s.
Monthly data reveal that postal deposits moved with yields on securities (with a correlation of about –0.64). Figure 5 shows that periods of higher (lower) yields coincided with decreases (increases) in postal deposits. The period of sustained growth of postal deposits starting in 1942 also had consistently low bond yields. Money then began leaving the Postal Savings System when yields rose in the late 1940s and the pace of the flow of money out of Postal Savings quickened as rates continued to rise in the 1950s. By the mid-1950s, when yields on municipal bonds were near 3 percent, postal deposits decreased by 1–2 percent a month. Although interest rates were also high during the rapid growth of postal deposits during the early 1930s, postal deposits maintained the advantage of security through federal guarantee. Now having neither the advantage of security nor relatively high interest rates, the system experienced a rapid decline.
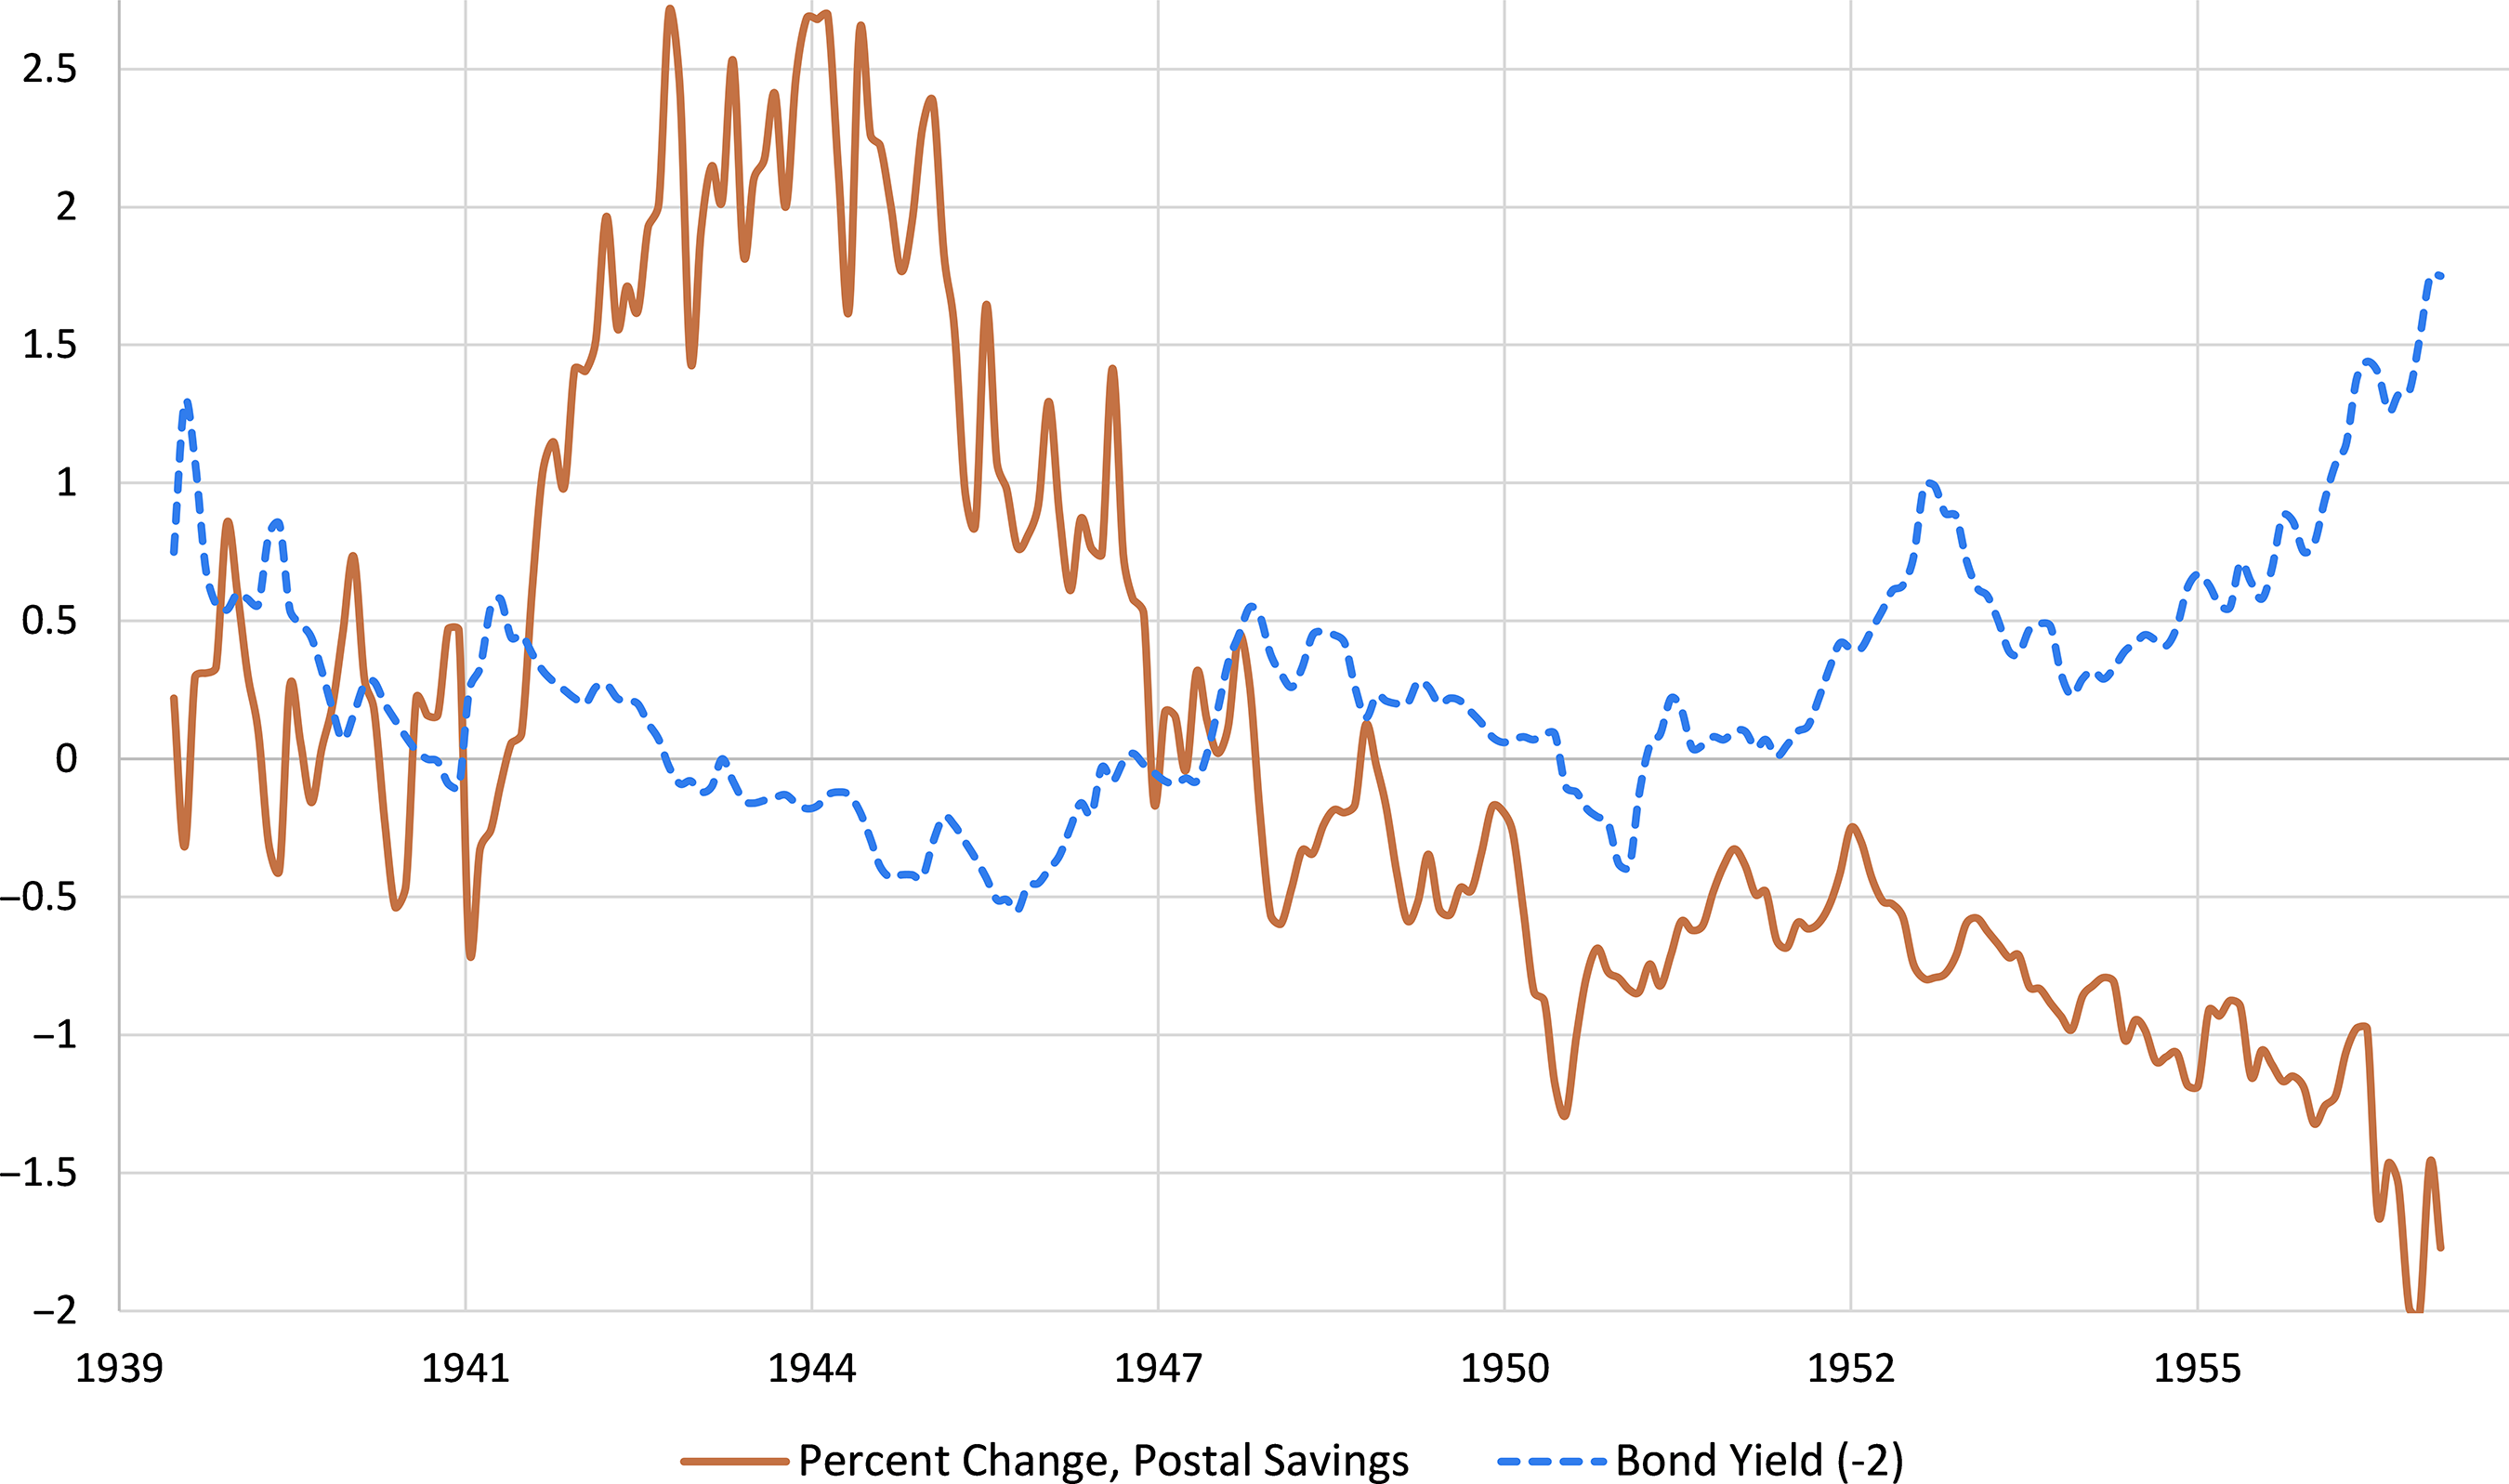
Figure 5. Monthly changes in postal deposits and bond yields.
In 1955, the Congressional Accounting Office recommended the termination of Postal Savings, arguing that the expansion and increased security of other savings opportunities made it obsolete (Stuart, 1955). Postmaster General Arthur Summerfield made the same recommendation in 1957. A bill to end the program was finally passed in 1965 and signed into law in 1966. Post offices stopped accepting new accounts, the system officially ended on July 1, 1967.
Despite the decline in usage, the program held more money in its final years than at any time during its first decade. In real dollar terms, the amount on deposit in 1964 was 25 percent more than in 1918, the peak of the pre-Depression years. The program also had returned to primarily serving small-scale depositors. The average depositor in 1965 held, in real dollar terms, less than one-third as much as the average depositor did in 1948. Similarly, we estimate that only about 10 percent of depositors in 1965 were holding the $2,500 maximum.
What Groups Used Postal Savings?
The previous section’s discussion of the aggregate data provides an overview of when Postal Savings was popular and how it was used. It suggests specific individual characteristics that might be important (e.g., demographic characteristics or bank proximity) to postal deposit trends. This section tests the hypotheses from the historical narrative in “Legislative History” as well as further refining the aggregate analysis of “How Was Postal Savings Used throughout the Years?” using disaggregated data.
We carry out to two similar multivariate analyses. First, we study the county-level demographic characteristics that are correlated with postal deposit levels. While we would have liked to have used city-level data on demographics, they are not readily available for these periods. County-level data allow us to see whether certain marginalized communities were more likely to use Postal Savings than others, and to disentangle the overlapping trends in usage, such as foreign-born and urban population, or farming communities and racial composition. Second, we make use of the more disaggregated bank data to understand whether Postal Savings was primarily used by those who lacked physical access to traditional banks. We still control for county characteristics, but focus on the local nature of banks and whether the entry of a bank affected postal deposits.
Demographics
Anecdotal evidence provides numerous hypotheses for what groups were most attracted to the program. Contemporary accounts emphasize the popularity of postal deposits among foreign-born people (Kemmerer, Reference Kemmerer1917). In 1915, the only year for which nativity data on depositors were gathered, the nationwide average for deposits was $0.6 per person, but Russian-born ($7.31 per person), Italian-born ($6.48), and Hungarian-born ($5.32) people heavily relied on Postal Savings. Many immigrants were coming from countries with postal banking systems. They also may have distrusted banks, as immigrant banks were hit particularly hard by the Panic of 1907:
There is scarcely a community in the country with an immigrant population of any proportions which has not its record of immigrant-bank failures…. Occasionally a national, state, or savings bank closes its doors, but it is seldom the case that the bank’s depositors lose any considerable amount by the failure…. Upon the failure of an irresponsible immigrant banker, however, there are seldom any funds or resources to which the creditor may have recourse. (Immigration Commission, 1916)
Kemmerer (Reference Kemmerer1917) also noted that whites were far more likely to use the program than blacks, noting that only 1.6 percent of depositors in 1916 were black. However, as much of the black population remained in the South where postal deposits were low, Kemmerer’s observation could be picking up regional differences rather than racial ones. Additionally, the relationship between race and postal deposits likely changed over time, given that the Great Migration, which was just beginning when Kemmerer was writing, led black people to places with greater Postal Savings access. In 1913, 32.2 percent of black people lived in counties that would not have postal depositories in 1925. By 1930, the percentage of black people living in those same counties dropped to 27.7 percent. In 1960, it would be 6.8 percent.
The traditional narrative suggests that urban populations were most likely to use Postal Savings, while early supporters believed the program could bring money out from under the mattress in farming communities, and rural bankers initially worried that Postal Savings would draw money out of their communities. Did farmers make use of Postal Savings, as people before its inception hoped/feared or did they mostly ignore it as the latter narrative suggests? One might believe that farmers would have appreciated the convenience of postal deposits. However, farmers had many others uses for excess funds, such as investing in land or equipment, potentially leaving their demand for postal deposits low.
Another local factor that could have influenced the popularity of Postal Savings is the presence of other banking options. During the early years of the program, trips between towns were slowed by the lack of good roads and automobiles. Therefore, if a bank was not present in their area, households would have had no choice but to either be unbanked or use the Postal Savings System. Postal deposits still were sizable in developed financial centers such as New York City, Boston, Chicago, and Philadelphia, but that does not mean the size of those deposits were not affected by local banking opportunities.
Aside from a survey of depositors in 1915, we know little about the demographic characteristics of the areas where the system was heavily used, especially after the early years. By looking at several years throughout the life of the system at the county level, we estimate how much of the cross-sectional variation can be explained by variation in key demographic and economic measures at each point in time. We chose the following years: 1913, the first year for which postal deposit data exist; 1936, the final year in which FDIC county-level data are available; and 1919, 1929, 1939, 1949, and 1959, to match census demographic data. We explore the relationship between postal deposits, demographic characteristics, and banking using the following OLS model for each year separately:
 $$Ln{(Deposits)_c} = {\beta _0} + {\beta _1}NatBan{k_c} + {\beta _2}StateBan{k_c} + {\bf \beta {\it X_c}} + {\gamma _s} + {s_c}$$
where Ln(Deposits) c is the natural log of postal deposits in a county c;Footnote 16 NatBank c and StateBank c are the number of national and state banks, respectively, in a county; γ s are state fixed effects; and X c is a vector of demographic and economic characteristics: the log of population; percent of population living in towns with populations above 2,500; percent of population living in towns with populations above 25,000 (through 1949); the percent of the population that is male; percent of males that are of voting age (21+); percent of population that is white and foreign-born; percent of population that is black; percent of acreage in a county that is farmland; and a measure of the value of farmland (which differs across census years).Footnote 17
Our results, presented in table 1, show the changing relationship between postal deposits and demographic characteristics. Some coefficients remain stable throughout the history of the program. When controlling for population, large cities relied on Postal Savings less than rural areas. A 10 percent increase in the number of people living in large urban areas (instead of rural areas) is associated with a decrease of 0.23 to 0.34 in the log of postal deposits (a 21–28 percent drop). This finding conflicts with the normal narrative that Postal Savings was most popular in urban areas. Instead, it was smaller urban areas (those with between 2,500 and 25,000 residents) that saw the highest level of per capita deposits. Additionally, in all years but 1913, the percent of farmland improved and land value per acre are strongly correlated with lower levels of deposits, suggesting that Postal Savings was less popular in more developed farming communities.
Table 1. Determinants of Postal Savings bank deposits at the county level

Notes: Table provides the results of a linear regression model. Each observation is a county and the column headings provide the year that is included. State fixed effects are included in all regressions. For 1939 regressions, measures of national and state bank data come from 1940 town-level data. Standard errors clustered by state are provided in parentheses below the coefficients. *** p < 0.01; ** p < 0.05; * p < 0.1. See “Data” section for description of data.
In “How Was Postal Savings Used throughout the Years?” we suggested that the aggregate data showed three distinct periods of use. Here we see one of those breaks reflected in a large shift in the type of people who used Postal Savings before and after 1929. In early years, the system was heavily used by foreign-born people and was unpopular in farming communities. After 1929, the association between demographic characteristics and postal deposits weakens, and the negative correlation with farming communities disappears. With the widespread distress affecting the banking system and low agricultural prices, farming communities start to use the system. This persists through the farm boom of the 1940s, as the correlation between farming and postal deposits becomes positive. At the same time, the immigration acts of 1921 and 1924 strongly restricted immigration, leading to a large change in the composition and behavior of immigrant communities. These demographic correlations reflect the regional variation in postal deposits over this time, as the center of activity moved from the Northeast to the heavily farmed (and largely white) Midwest.
When controlling for other county characteristics, the percent of black population is not statistically significant between 1913 and 1936. Kemmerer’s (Reference Kemmerer1917) finding that black communities avoided Postal Savings was driven by other observable demographic characteristics, which is a striking result, given the large wage gap between black people and whites. The change over time in the coefficient on “percent black” reveals the interaction between black migration, regional variation, and disproportional access across racial lines. In the early years, low levels of deposits for black people were similar to levels throughout the south, even though black people were less likely to have access to Postal Savings. We confirm the role of access by dropping counties without Postal Savings from our regressions. The coefficients on percent black become statistically insignificant for all years but 1950, showing that access, not differences in demand, drove the negative relationship between percent black and postal deposits.Footnote 18 This negative relationship in later years is likely due to the northern migration of black people, who found themselves in states with higher levels of postal deposits. Because our regressions include state fixed effects, we are comparing black people only to others in their own states.
As bank accounts were potential substitutes for postal deposits and bankers viewed Postal Saving as a threat, it is notable that state bank sorting across counties is negatively correlated with postal deposits in all years (suggesting they were substitutes); except for 1939, no strong relationship between national banks and postal deposits exists at the county level in the cross-section. However, given that coarseness of county-level data and the possibility of omitted variable bias, we cannot make any causal claims using these regressions.
Though Postal Savings was not particularly large before the 1930s, it initially reached some of the more marginalized population as was intended. Immigrants tended to be wary of commercial banks and thus took the chance to save in the federally insured system. After 1929, the role of Postal Savings drifted far from the purposes for which it was designed, first becoming attractive to the wider population as the banking system destabilized and then becoming a high interest savings vehicle.
Distance to Banks
While the county-level data allow us to understand the use of Postal Savings by marginalized populations and other groups, town-level data are better suited to examining the extent that postal deposits were driven by those who were unbanked because they had no nearby bank. The number of banks in a county is a coarse measure of banking access because individuals would not generally have traveled to another city for banking services. Using town-level data, we estimate the effect of bank proximity on postal deposits. This allows us to directly test whether the program was being used by the unbanked while controlling for the demographic characteristics of the location’s county.
We carry out our city-level examination over three periods: 1913–19, 1919–29, and 1929–40. These periods offer different windows into the relationship between banks and Postal Savings. The years 1913–19 allow us to observe the normal operation of Postal Savings and cleanly observe the importance of having access to a bank. This was a period where interest rates on stocks, bonds, and commercial bank accounts were higher than the low fixed rate of postal deposits. As seen in “How Was Postal Savings Used throughout the Years?” as well as the county-level analysis, the inversion of interest rates attracted high-income investors to Postal Savings. Moreover, in periods where banks are closing, we cannot separate the effect of the flight to quality from the simple presence of a bank. While banks were growing steadily through World War I, the sudden collapse of crop prices in the early 1920s led to a steady stream of bank closures. Coupled with the bank closures of the Great Depression and slow growth of banking thereafter, the 1910s are the only period when we are able to see if Postal Savings served as a substitute for banking during a stable period.Footnote 19 The specific choice of 1913 is made because it is the first year that town-level postal deposits are reported.
Looking at 1919–40 allows us to study the historical role of Postal Savings in the tumultuous interwar period. Much of the variation in bank location was driven by bank closures, so we are capturing a different effect than in the 1910s.
Using a nationwide data set of state and national banking for 1913, 1919, 1929, and 1940, we measured the distance, in kilometers, from each postal depository to the nearest state and national bank for each year.
We use a first-difference specification to control for unobserved place characteristics associated with both bank location and postal deposits:
 $$\Delta Ln{(Deposits)_{it}} = {\beta _1}\Delta NatBan{k_{it}} + {\beta _2}\Delta StateBan{k_{it}} + {\bf \beta \Delta {\it X_{ct}}} + {\gamma _s} + {s_{it}}$$
where ΔLn(Deposits) it is the change in the natural log of postal deposits at office i between period t and t-1;Footnote 20 Δ X ct is the change for a vector of county-level census demographic characteristics as previously mentioned; and γ s are state fixed effects. Finally, NatBank it and StateBank it are dummy variables equal to 1 if there is a bank within a specified distance, and 0 otherwise. Therefore, ΔNatBank it and ΔStateBank it are equal to 1 if a community did not have a bank nearby in earlier year, but had one in later year (and –1 if the opposite it true). A negative coefficient on these variables implies that the entry (exit) of a bank is followed by a decrease (increase) in postal deposits, which is consistent with the hypothesis that Postal Savings served as a substitute for banking in places that did not have close access to state or national banks.
The first difference specification addresses any time-invariant omitted variable bias, but remaining sources of bias must still be discussed. One potential source of bias is a failure to fully control for unobserved shocks to general banking demand. However, this would bias our estimates toward zero, leading to a possible underestimate of causal effect, but not to an erroneous conclusion that banks led to a decrease in postal deposits. Concerns of reverse causality are mitigated by the small size of postal deposits. Because postal deposits were redeposited in nearby banks, it is conceivable that banks could choose to locate based on postal deposit levels. However, the total amount on deposit at postal depositories was about 1 percent of savings deposits in the 1910s, so it does not seem likely that banks chose where to locate based on the potential to receive redeposits.
Another potential bias would come if banks were able to anticipate a decrease in demand for postal deposits, but not deposits in private banks, and then opening in a town to gain that business. In this case, a negative relationship would be observed, but not due to the banks entering or leaving a market. However, due to the redeposit structure of Postal Savings, banks often received postal deposits, meaning the potential decrease in demand for commercial banks that Postal Savings represented was mitigated. In fact, many bankers preferred funds that came first through Postal Savings because it was cheap business to acquire, and the 2.5 percent required interest rate was often lower than the interest paid on other deposits before 1935 (Sissman, Reference Sissman1938). Therefore, for this mechanism to bias our estimates, banks would (1) have to prefer individual deposits to postal redeposits, even though the interest rate paid on postal redeposits was lower; and (2) anticipate a town-specific time shock that would decrease the demand for postal deposits while also making private banking more profitable. These circumstances seem very unlikely.
As noted in the preceding text, we believe that 1913–19 is the most suitable period for obtaining unbiased estimates, given the relative stability of the banking sector.Footnote 21 The 1920s and 1930s were decades with local regional economic shocks that could have simultaneously led to banking panics while also increasing the demand for Postal Savings. This omitted variable would lead to a negative correlation between postal deposits and banking presence, even if there was no causal relationship. We also cannot rule out reverse causality during this period: If people turned to Postal Savings in moments of economic uncertainty, their decision to take their money out of banks may have caused bank closures. Nonetheless, we present the findings here because they show what happens when banks leave, even if we cannot make strong causal claims.
Table 2 presents the results for each period. For 1913–19, shown in panel A, we find that gaining a bank, especially a national bank, led to a significant decrease in postal deposits. When using a 1 km cutoff, gaining a national bank is associated with a statistically significant 0.305 drop in the log of deposits (26.3 percent). For state banks, a bank is associated with a 0.202 (18.3 percent) drop, but this estimate is only statistically significant at the 10 percent level. While the estimates for national banks are always significant at the 5 percent level for thresholds smaller than 10 km, the point estimates move toward zero. As most individuals would not be able to make everyday usage out of a bank that was 10 km away or more, it makes sense that we would find little effect of gaining a bank at this distance or greater.
Table 2. Effect of a change in bank proximity on Postal Savings deposits

Notes: Table provides the results of a first-difference linear regression model. The sample includes any post offices in the contiguous United States that had at least $1 in postal deposits at any time from 1913 to 1919. Each observation is a post office and the column headings provide the distance threshold used. The independent variable of interest is the change in a dummy variable indicating whether the nearest national (or state) bank to the post office is within a specified distance (1 km, 5 km, etc.). State fixed effects are included in all regressions. County-level controls include the change each of the following: log of population the percent of population living in an urban area with 2,500–25,000 in population, percent of population living in an areas with greater than 25,000 in population, percent male, percent of voting age males, percent white foreign born, percent black, percent of acreage under farmland, and percent of farmland improved. Standard errors clustered by state are provided in parentheses below the coefficients.
*** p < 0.01; ** p < 0.05; * p < 0.1.
The decay in the coefficient as the radius expands also supports our identification strategy. Any unobserved shocks likely have spatial auto-correlation, meaning that any omitted variable bias in a regression using 1 km as the threshold would likely also bias a regression using 10 km. But because we observe the effect of banks on postal deposits diminishing as we move the threshold further away, the confounding, unobserved shock would need to be unique to very small areas (less than 10 km) to be driving our results.
Although postal deposits decreased when banks moved into an area, the estimated effect of not having a bank is small enough that factors other than bank proximity were driving deposits. Using the point estimates found in column 1, panel A of table 2 we estimate that if every post office gained a national bank within 1 km in 1919, then total postal deposits would have decreased by about 8.3 percent. This change is small compared to the changes in deposits when state deposit insurance programs were put in place that we saw in “How Was Postal Savings Used throughout the Years?,” suggesting that Postal Saving’s security, not its proximity, was its main selling point. These results are consistent with the fact that gaining national banks led to a larger decrease in postal deposits than gaining state banks. National banks were generally larger, subject to more regulations and supervision, and less likely to fail than state banks. Moreover, national banks were required to join the Federal Reserve in 1914, which allowed them to access nationwide check clearing and the discount window, whereas state banks were given a choice, and less than 6 percent opted to join (Anderson et al., Reference Anderson, Calomiris, Jaremski and Richardson2018). To the extent that individuals put deposits in Postal Savings accounts due to their government guarantee, they might have been more likely to trust those same deposits to a national bank rather than a state bank.
The effect of bank proximity differed with the presence of deposit insurance. We test this by interacting the independent variable of interest with a dummy variable equal to one if a state had deposit insurance.Footnote 22 As seen in the appendix, states with deposit insurance saw no effect of bank entry on postal deposits, while states without deposit insurance saw large decreases. One way to interpret this result is that deposit insurance depressed demand for Postal Savings overall, leaving less opportunity for bank location to affect depositor behavior. These results also suggest that deposit security drove postal deposits in the early years at least as much as convenience did.
If Postal Savings’ biggest appeal was its security, we would expect the marginal response to changes in bank proximity to grow during the interwar period, when bank failure was much more common. The results for regressions using 1919–29 and 1929–40 are presented in panels B and C of table 2. In both regressions, we continue to find a large correlation between national bank locations and postal deposits. Again, using the coefficient on 1 km, we find that the entry of a national bank is associated with a 45.8 percent decrease in postal deposits in 1919–29 and a 52.7 percent decrease in 1929–40. Of course, these results cannot tell us whether Postal Savings was a substitute for banks in a normally functioning market. The large coefficients for national banks when the 20 km threshold is used suggests that either regional shocks were affecting both bank stability and the demand for Postal Savings, or people moved their money into Postal Savings even when banks 20 km away closed. Because these banks were unlikely to be the bank a person regularly used, it suggests a regionwide flight to quality.
Though the magnitude of the coefficients on national banks grew compared to 1913–19, the coefficient on state banks moved toward zero. Given that much of the variation in this period is driven by bank closures, it is worth noting that state banks were less likely to repay depositors when they failed. This failure to repay would dampen the responsiveness of depositors to move to Postal Savings. The larger marginal responses to national bank location seen in panels B and C are coupled with higher levels of postal deposits during these years, meaning that the total amount of money entering Postal Savings following changes in bank location was especially large in later periods. In 1913–19 losing a local national bank would increase postal deposits by an average of $2,762. For 1919–29, this number is $9,270 and for 1929–40, it’s $68,450. This final figure is still small compared to the amount on deposit in an average national bank, which (in 1939) would have had about $1 million (deflated to 1913 dollars). However, because most national bank failures for our 1929–40 sample occurred in the first few years of the 1930s, this number indicates that several years following a bank closure, depositors were still holding large amounts of money in Postal Savings.
Conclusion
While the US Postal Savings System was explicitly intended to reach the unbanked and marginal populations, a close study of the data show that it served several different functions and customers throughout its history. In the first several decades of service, at least up to the establishment of the FDIC, demand for postal deposits was associated with a lack of access to safe banking opportunities. Our findings for this period suggest that Postal Savings served several different groups of unbanked households. For those who lived in towns with no commercial banks, postal deposits provided a convenient option. Gaining a bank nearby significantly decreased postal deposits, as did the establishment of state deposit insurance systems. For other people who distrusted banks, Postal Savings, with its federal government guarantee, was especially attractive. Following banking crises or the collapse of state deposit insurance programs, people turned to Postal Savings. Thus, Postal Savings served many marginalized groups, such as immigrants, who were often distrusting of traditional banks, and were more likely to live in mining communities, where banking options were scarce.
In later years, especially once the FDIC was established and the probability of bank failures became diminishingly small, the appeal of Postal Savings depended primarily on the interest rates offered by other savings mechanisms. Though the 2 percent return offered by Postal Savings was relatively low in 1911 when the system was established, by the 1940s it was higher than most bond interest rates with no corresponding increase in risk. This fixed interest rate caused the system to not only become an investment vehicle for wealthy individuals during the Great Depression and World War II but also to compete directly with the commercial banking sector. Overall, the US Postal Savings System reached some of its intended clients, but over time the structure of the program led to changes in how it was used and who benefitted most.
This history also provides important lessons for those hoping to reestablish the system. First, the interest rates offered by Postal Savings heavily shape the nature of the system, and the type of customers who use it. The fixed interest rate of the historical system bound the hands of the system’s administrators and led to the dominance of wealthy depositors rather than the targeted demographics. Second, the destination of any deposited funds should be carefully considered. During the historical period, the redeposit system only worked when interest rates were high enough for banks to be willing to accept redeposits, and during World War II postal deposits were a more costly source of fund than other bond issuances. Given the low interest rates currently offered at commercial banks, redepositing Postal Savings funds in local banks might not be possible for a self-sustaining program and ultimately might make it harder for small local banks to compete for funds. Will funds be used to purchase government debt, make loans, fund infrastructure, or be deposited in banks (despite possible losses)? Third, though it was used for short-term liquidly, Postal Savings internally provided only longer horizon-oriented saving accounts. Postal Savings may have reached more of the underbanked had it been oriented to their short-term liquidly needs. Finally, lawmakers must determine an acceptable level of competition between Postal Savings and banks. Our results indicate that Postal Savings was at least a partial substitute for banks. Though the banking environment is very different than it was in the 1910s, lawmakers should be prepared to address concerns of the Postal Savings drawing money from local banks.
Acknowledgments
Any opinions and conclusions expressed herein are those of the authors and do not necessarily represent the views of the US Census Bureau. The research in this article does not use any confidential Census Bureau data.
Appendix
Estimating the Number of Maximum Deposits
We estimate the distribution of account sizes from the several hundred offices with only one depositor. Throughout our sample these accounts follow an exponential distribution with a heavy right tail. The average size of deposits for offices with one depositor is smaller than the overall average, but we only assume that the shape of the distribution for these offices is representative. Because the only parameter for the exponential distribution is the mean, we can estimate the number of accounts in each post office at the $2,500 limit. Using the 1929 figure as a reference, we see that this method underestimates the total number, so we scale our result to match that figure, and apply that same scale to all other estimates. This procedure provides a good match for the few cases in which the number of maximum deposits was reported in newspapers.
Table A1. Summary statistics

Notes: Table provides summary statistics for all counties used in regressions for table 1. For 1939, measures of national and state bank data come from 1940 town-level data. Standard deviations are in parentheses. The unit of observation is the county. Deposit data are the log of aggregate level of postal savings deposits in a county. See “Data” section for description of data.
Table A2. Effect of a change in bank proximity, with and without deposit insurance

Notes: Table provides the results of a first-difference linear regression model. The sample includes any post offices in the contiguous United States that had at least $1 in postal savings deposits at any time from 1913 to 1919 and were established before 1913, with ND, SD, MS, and WA omitted. Each observation is a post office and the column headings provide the distance threshold used. The independent variable of interest is the change in a dummy variable indicating whether the nearest national (or state) bank to the post office is within a specified distance (1 km, 5 km, etc.). State fixed effects are included in all regressions, along with interaction terms for the existence of deposit insurance. County-level controls include the change each of the following: log of population the percent of population living in an urban area with 2,500–25,000 in population, percent of population living in an areas with greater than 25,000 in population, percent male, percent of voting age males, percent white foreign born, percent black, percent of acreage under farmland, and percent of farmland improved. Standard errors clustered by state are provided in parentheses below the coefficients. *** p < 0.01; ** p < 0.05; * p < 0.1.


