


Experiments have become increasingly common across the social sciences (Berger Reference Berger2014; Druckman and Lupia Reference Druckman and Lupia2012; Holt Reference Holt2006; Kriss and Weber Reference Kriss, Weber and Northampton2013; Morawski Reference Morawski1988). Of considerable appeal are survey experiments that “seek to establish causal relationships that are generalizable – that is, they try to maximize internal and external validity” (Barabas and Jerit Reference Barabas and Jerit2010, 226). The ideal is that such studies afford clear causal inferences that generalize to a broad population.
For example, in one notable survey experiment, some respondents were randomly assigned to receive only information about the partisanship of the officials responsible for dealing with the aftermath of Hurricane Katrina (Malhotra and Kuo Reference Malhotra and Kuo2008). Others randomly received further descriptions of the officials’ jobs. Those in the latter condition relied much less on partisanship in assessing blame for mishandling the response; thus, the influence of partisanship was mitigated when job responsibilities were provided. Given the data came from a representative sample of U.S. citizens, the researchers were able to sensibly generalize the results to this population.
Population-based survey experiments are experimental designs embedded within surveys that are “administered to a representative population sample” (Mutz Reference Mutz2011, 2; see also Nock and Guterbock Reference Nock, Guterbock, Marsden and Wright2010, 860). They have become an ostensible “gold standard” for generalizable causal inferences. Hundreds of population-based survey experiments have been carried out (Mutz Reference Mutz2011), and Sniderman (Reference Sniderman, Druckman, Green, Kuklinski and Lupia2011) refers to them as “the biggest change in survey research in a half century” (102).
A central challenge for population-based survey experiments, however, is their cost. Even a relatively brief survey on a population-based sample can cost more than $15,000. It is for this reason that many researchers continue to rely on cheaper convenience samples including those drawn from undergraduate students (Sears Reference Sears1986), university staff (Kam et al. Reference Kam, Wilking and Zechmeister2007), social media sites (Broockman and Green Reference Broockman and Green2013; Cassese et al. Reference Cassese, Huddy, Hartman, Mason and Weber2013),Footnote 1 exit polls (Druckman Reference Druckman2004), and, perhaps most notably, Amazon Mechanical Turk (MTurk). MTurk is an online crowdsourcing platform that has become widely used across the social sciences due its ease of use, low cost, and capacity to generate more heterogeneous samples than subject pools of students (see Berinsky et al. Reference Berinsky, Huber and Lenz2012; Krupnikov and Levine Reference Krupnikov and Levine2014; Paolacci et al. Reference Paolacci, Chandler and Ipeirotis2010). That said, MTurk is an opt-in sample, meaning that respondents self-select into participating rather than being drawn with known probability from a well-specified population, and, as such, MTurk and other convenience samples invariably differ from representative population samples in myriad, possibly unmeasured, ways.
Each of the aforementioned convenience samples is substantially cheaper than a population-based sample; however, do survey experiments using a convenience sample produce results that are similar to those conducted on a population-based sample?Footnote 2 That is, would we arrive at the same causal inference if a study were performed on a convenience sample versus on a population-based sample? A common concern is that the features of a given convenience sample may diverge from a representative population sample in ways that bias the estimated treatment effect. For instance, if the previously discussed Hurricane Katrina experiment was conducted on a convenience sample of strong partisans, the results likely would have differed. Isolating the presence of such biases is difficult since one can rarely, if ever, identify all the selection biases shaping the composition of a convenience sample.
Consequently, the extent to which varying types of convenience samples produce experimental treatment effects analogous to population-based surveys is an empirical question. Recent work has sought to compare samples (e.g. Berinsky et al. Reference Berinsky, Huber and Lenz2012; Goodman et al. Reference Goodman, Cryder and Cheema2012; Horton et al. Reference Horton, Rand and Zeckhauser2011; Krupnikov and Levine Reference Krupnikov and Levine2014; Paolacci et al. Reference Paolacci, Chandler and Ipeirotis2010; Weinberg et al. Reference Weinberg, Freese and McElhattan2014).Footnote 3 While these studies are impressive and telling, each includes only a small number of comparisons (e.g. three experiments) on a limited set of issues (e.g. three or four) and topics (e.g. question wording, framing) with few types of samples (e.g. three) at different points in time (e.g. data were collected on distinct samples far apart in time). Indeed, in one of the broader sample comparisons, Krupnikov and Levine (Reference Krupnikov and Levine2014) conclude that their study with three samples (students, MTurk, and a population sample) is “only able to scratch the surface” (78).
In what follows, we present two studies that offer one of the broadest sample comparisons to date. Study 1 involves three experiments on a population sample and four convenience samples implemented simultaneously. Study 2 presents results from 20 experiments implemented on a population sample and MTurk. Taken together, our data vastly expand the breadth of comparisons, issues, topics, and samples.
We find that the survey experiments we chose largely replicate with distinct samples (i.e., population and convenience samples). The implication is that convenience samples can play a fruitful role as research agendas progress; use of such samples does not appear to consistently generate false negatives, false positives, or inaccurate effect sizes. However, this does not mean that costly population samples can be abandoned. Population samples possess a number of inherent properties that are lacking or unknowable in convenience samples. For instance, population samples facilitate the testing of heterogeneous treatment effects, particularly in cases where scholars lack a strong theory that identifies the nature of these effects a priori. Population-based survey experiments also serve as a critical baseline of comparison for researchers seeking to assess the usefulness of ever changing convenience samples (e.g. does the validity of MTurk samples change as respondents continue to participate in literally hundreds of experiments?). Finally, while our results differ from other replication efforts (Open Science Collaboration 2015), it remains unclear just how often survey experiments, beyond the set we chose, replicate. We view our findings as part of an ongoing effort throughout the social sciences to identify the features of experiments that influence the likelihood of replicable and generalizable inferences.
STUDY 1
For both studies, the source of our population-based sample is the National Science Foundation funded Time-sharing Experiments for the Social Sciences (TESS) program (http://tessexperiments.org/; also see Franco et al. Reference Franco, Malhotra and Simonovits2014). Since 2001, TESS has invited social scientists to submit proposals to implement population-based experiments. Proposals undergo peer-review and are fielded on a competitive basis. TESS offers graduate students and faculty the opportunity to field population-based experiments at no cost to the investigators themselves.
TESS makes use of what has become a central mode of survey data collection: the use of an ongoing panel of respondents who “declare they will cooperate for future data collection if selected” (Callegaro et al. Reference Callegaro, Baker, Bethlehem, Göritz, Krosnick, Lavrakas, Callegaro, Baker, Bethlehem, Göritz, Krosnick, Lavrakas and Sussex2014, 2–3). Specifically, TESS fields experiments using GfK's (formerly Knowledge Networks) online panel, which is based on a representative sample of the U.S. population. TESS data are particularly appealing because their panel is drawn from a probability-based sampling frame that covers 97% of the population (GfK 2013). This helps ensure representation of minorities and low-income participants, who are often under-represented in non-probability panels.Footnote 4
As explained, the central downside to the population-based sampling approach of TESS is cost: a typical TESS study costs more than $15,000 (with an average N of 1,200 the cost per respondent is a bit less than $13.00). Moreover, while TESS offers a “free alternative” to investigators, the likelihood of being accepted to field a TESS survey experiment has become quite low. In 2013, for example, only 11.2% of submitted proposals were accepted; in 2014, 14.4% were accepted. The competitiveness of TESS and the high cost to scholars who want to collect population sample data themselves are likely primary reasons why researchers continue to rely on convenience samples.
In our first study, we implemented three experiments simultaneously on TESS and on four of the most common types of convenience samples used in political science. In this study, we focus on a single political science theory: framing. Framing theory has been used for the last quarter century to understand elite rhetoric and political debate (Entman Reference Entman1993; Gamson and Modigliani Reference Gamson and Modigiliani1989; Riker Reference Riker1996). Experimental findings show that emphasizing particular elements of a political issue alters citizens’ preferences and behaviors (Chong and Druckman Reference Chong and Druckman2007a, Reference Chong and Druckmanb; Druckman Reference Druckman2001). A now classic example of a framing effect showed that when a newspaper editorial framed a hate group rally in terms of “free speech,” readers placed more weight on “speech” considerations and ultimately became more tolerant of the rally (Nelson et al. Reference Nelson, Clawson and Oxley1997). Due to the wealth of experimental literature in this domain and its heavy reliance on convenience samples (Brady Reference Brady2000; Klar et al. Reference Klar, Robison, Druckman and Ridout2013; Nelson et al. Reference Nelson, Clawson and Oxley1997), framing provides a propitious opportunity to explore the consequences of experimental samples for causal inferences.
In each of the three experiments, respondents are exposed to one of two different arguments about a policy issue and then asked for their opinion on a seven-point scale (recoded to range from 0 to 1). Treatment effects are measured by the difference in support for each policy in each condition. In the first experiment, respondents are either simply told about the amount of student loan debt held in the United States or are given an argument that frames loan repayment as individuals’ personal responsibility. They were then asked, “Do you oppose or support the proposal to forgive student loan debt?” (“Strongly oppose” to “Strongly support”). The second experiment followed from the canonical hate rally tolerance study, providing respondents with either a frame emphasizing free speech considerations or a control condition that simply described a “hypothetical” rally. Respondents were asked, “Do you think that the city should or should not allow the Aryan Nation to hold a rally?” (“Definitely should not allow” to “Definitely should allow”). The final experiment is similar to a recent partisan framing study about the DREAM Act; in this study we exposed respondents to either a “con” frame emphasizing the social burden imposed by immigrants or a no-information control condition (Druckman et al. Reference Druckman, Peterson and Slothuus2013).Footnote 5 Participants were asked, “To what extent do you oppose or support the DREAM Act?” (“Strongly oppose” to “Strongly support”).
The three experiments were implemented in the late fall of 2012 with five distinct (and widely used) samples.Footnote 6 The first was a TESS population-based sample. The other samples were convenience samples recruited using common recruitment strategies for political science experiments (Druckman et al. Reference Druckman, Green, Kuklinski and Lupia2006). First, an online sample was recruited using MTurk, paying subjects $0.50 for participation (a la Berinsky et al. Reference Berinsky, Huber and Lenz2012). Second, a sample of university staff completed the experiment in-person at individual laptop stations, and were compensated $15 (a la Kam et al. Reference Kam, Wilking and Zechmeister2007; Redlawsk et al. Reference Redlawsk, Civettini and Emmerson2010). Third, a convenience sample of university undergraduate students, who were compensated by course credit, completed the experiment in-person at individual laptop stations (a la Nelson et al. Reference Nelson, Clawson and Oxley1997). Last, a sample was recruited at polling places in Evanston, Illinois and Ann Arbor, Michigan after voting in the 2012 general election (a la Druckman Reference Druckman2004; Klar Reference Klar2013). These respondents were offered $5, with the option of donating it to a charitable organization, to complete experiments via a paper-and-pencil form.
Though recruitment and compensation differ across these five samples, we employ the standard recruitment methods used for each type of sample for reasons of external validity. That is, when experiments are implemented with each of these samples using their typical procedures, what are the consequences for inferences? Holding recruitment and compensation constant across all samples would have limited utility because many of the convenience samples would no longer be implemented as they typically are.
The Appendix provides a demographic summary for each sample. The samples differ in age in predictable ways, but differences are not as pronounced on gender. Most of our convenience samples are as racially diverse as the TESS sample, with the exit poll supplying a high proportion of African American respondents and TESS under-representing Hispanics.
Due to probability sampling of participants from the U.S. population, the experimental effects drawn from the weighted TESS sample should provide unbiased estimates of treatment effects for the U.S. adult population as a whole. This is the typical approach with TESS data (e.g. weights are provided by GfK). In contrast, we do not weight the convenience samples since it is unconventional to do so (e.g. Berinsky et al. Reference Berinsky, Huber and Lenz2012; Druckman Reference Druckman2004; Kam et al. Reference Kam, Wilking and Zechmeister2007). However, we will discuss the implications of weighting some convenience samples in Study 2. We compare average treatment effects (difference between treatment and control groups) from TESS (our representative baseline) to each of the convenience samples. Figure 1 shows the average treatment effect estimates from our three experiments with bars representing one and two standard errors of the mean-difference generated from a randomization-based permutation distribution. To simplify presentation of results, the direction of effects in the student loan and DREAM Act experiments have been reversed (control-treatment, rather than treatment-control).

Figure 1 Study 1 Results.
As expected, the treatment in the student loan forgiveness experiment has a statistically significant effect in the TESS sample. How well do the results from the convenience samples correspond to the TESS sample? Despite differences in the demographic composition of the samples, each convenience sample produces a treatment effect comparable to the TESS sample. That is, each of the convenience samples yields an estimated treatment effect in the same direction as the TESS sample estimate, that is statistically distinguishable from zero, and that is also statistically indistinguishable from the TESS sample estimate according to a difference-in-difference estimator comparing the treatment-control group differences in each sample.
The results of the second experiment (on tolerance of a hate rally) closely mirror the results of the student loan experiment. The TESS sample yields a large, statistically significant effect of the treatment on support for the rally. The MTurk, university staff, and student samples all yield substantively and statistically similar effect estimates. The exit poll sample, however, yields an estimated effect statistically indistinguishable from zero and substantively pointing in the opposite direction of the TESS result (i.e. emphasizing free speech makes respondents less tolerant). This result appears to be due to very high level of tolerance for the rally in the control condition (i.e. a ceiling effect), possibly due to respondents having just exercised their voting rights moments before participating in the experiment (see Appendix for treatment group means).
The results for the third experiment again closely mirror those of the previous two experiments. As anticipated, TESS respondents exposed to a negative argument about immigration are less supportive of the DREAM Act than the control condition (recall Figure 1 shows a control-minus-treatment difference for this experiment). As in the second experiment, we find substantively and statistically similar results from the MTurk, staff, and student samples. Only the exit poll diverges from this pattern, but we have no definitive explanation, in this case, for this inconsistency.
In sum, all of the convenience samples (save the Election Day exit poll) consistently produce treatment effect estimates similar to TESS in terms of direction and significance. And in most instances, the effects were of a similar magnitude. The exit poll appears most problematic, only providing a comparable inference in the student loan experiment. Future work is needed to assess whether differences in exit polls (if these results are typical of experiments embedded in exit polls) stem from the sample, context, or implementation technique. Nonetheless, overall, despite differences in demographic composition, the convenience samples – and in particular, student and MTurk – tend to provide substantively similar inferences about each of our treatments.
Yet, this study has limitations. First, it only examines three issues – all of which are built on framing theory. Thus, it is reasonable to ask to what extent the results generalize to other issues. Second, the samples differ in more than just their composition. For example, the university student and university staff samples were administered in-person on laptops whereas the TESS and MTurk samples were completed on-line. Also, the student sample was not financially compensated, but all the other samples were. These differences in implementation were done deliberately, as mentioned, so that each sample was recruited and implemented in a realistic manner, but it limits our ability to infer whether or not the composition of the samples is driving similarities and differences in treatment effects between samples. Finally, there were differences in sample sizes that impact the statistical power associated estimates for each sample.
STUDY 2
Study 2 complements Study 1 by addressing several of the aforementioned issues. First, we examine a much broader range of issues. Second, we focus on comparisons of the average treatment effects between MTurk samples and TESS population-based samples, so that the experiments can be implemented in an online mode in a maximally similar manner. Third, we conduct the experiments with large, comparably sized samples on both platforms. Note that, unlike Study 1, where the TESS studies were newly implemented in concert with the other samples, here we rely on previously implemented TESS studies (for which again we apply the relevant sampling weights as in Study 1), and compare them with newly implemented (unweighted) MTurk. While we could have compared the TESS sample directly to other convenience samples as we did in Study 1, we limited our focus to a single convenience sample (MTurk) in order to assess a larger number of issues in a manner that was feasible. MTurk is an increasingly popular avenue for experimental research across the social sciences (Bohannon Reference Bohannon2011) and related research on the utility of the platform has been conducted but only with a small number of issues (Berinsky et al. Reference Berinsky, Huber and Lenz2012; Krupnikov and Levine Reference Krupnikov and Levine2014).Footnote 7
We selected a total of 20 survey experiments that had been implemented using the TESS survey population sample platform. Ideally, in terms of selection of studies, we would have randomly sampled experiments from TESS archives, but this approach was not feasible for several reasons. First, TESS experiments with samples over 4,000 respondents were not included. Second, experiments had to be able to be implemented in the survey software we used for the MTurk experiments (Qualtrics).Footnote 8 Third, many TESS experiments use subsamples of the population of one sort or another (e.g. Democrats, white respondents, respondents with children); we used only experiments intended to be fielded on the population-at-large. Finally, we restricted consideration to relatively recent TESS experiments for which we did not expect the treatment effect to be moderated by a precise time period (since we collected the MTurk data after the TESS data were collected). After eliminating potential experiments from the TESS archives based on these criteria, at the time of our implementation we were left with the 20 experiments shown in Table 1. As will be clear in our results, we did not select experiments based on whether significant effects had been obtained using TESS, as this would bias comparisons because replications of experiments selected on statistical significance are expected to have a smaller average effect size than the original studies (Kraft Reference Kraft2008).
Table 1 Study 2 Experiments

The experiments address diverse phenomena such as perceptions of mortgage foreclosures, how policy venue impacts public opinion, and how the presentation of school accountability data impacts public satisfaction (see Supplementary Materials for details of each experiment).Footnote 9 Testing across such a broad range of issues enables us to test whether some unexpected and/or unmeasured feature of the MTurk sample generates bias (e.g. Weinberg et al. Reference Weinberg, Freese and McElhattan2014 note that some have suggested that people who seek out opportunities to participate in experiments online at sub-minimum wage rates may be unusual in various respects in terms of undocumented moderators).
We implemented the 20 experiments in ways that maximized assurance that differences stem from differences in samples, rather than differences in instrumentation. We used identical wording and virtually identical formatting. We also employed sample sizes that were as close as possible (given response rates) to TESS. As such, we obtained what is, to our knowledge, one of the largest pools of MTurk workers for social science experiments – over 9,500 unique Worker IDs across the 20 experiments. We paid about $.40 cents per respondent per experiment (see work on pay rates; Berinsky et al. Reference Berinsky, Huber and Lenz2012).Footnote 10
We focus analyses on the first post-stimuli dependent variable – since these variables are the primary focus of the experiments as proposed by the TESS investigators. We made comparisons between a control group and what clearly were the two main treatment groups for the experiment, or if no control group was included, between the conditions that clearly tested the main dimensions of interest. Four experiments only had two conditions, and as such, we only compare those two conditions.Footnote 11 By making simple group comparisons and focusing on only the first post-stimuli dependent variable, we are taking a uniform analytical approach in our assessment of these experiments. However, we emphasize that this may or may not be the analytical strategy employed the TESS Principal Investigators who designed these experiments. These investigators may have employed different analytical and modeling techniques or focused on different dependent variables.
Tables in the Appendix show the demographic data collected in our 20 experiments for both samples, and are consistent with previous research (e.g. Berinsky et al. Reference Berinsky, Huber and Lenz2012). Among other differences, the MTurk respondents are younger and more educated than TESS respondents. The gender composition of the samples is quite similar.
Figure 2 shows the difference between group means for the control group and each experiment's first treatment group separately for the weighted TESS sample and the unweighted MTurk sample. Studies are sorted by magnitude of the effect size of the weighted TESS sample, which has been signed positive for all experiments (see Table 1 for topics of each experiment number, and Supplementary Materials for additional study details).

Figure 2 Control vs. Treatment Group 1.
Figure 2 reveals that, generally, the two samples produce similar inferences with respect to the direction of the treatment effect and statistical significance. Indeed, 15 of the 20 experiments produce the same inference. That is, when TESS produces a statistically significant treatment effect in a particular direction, a significant effect in the same direction is produced by MTurk; or, when there is a null effect in TESS there is a null effect in MTurk. Yet, there are five deviations from this overall pattern (Experiments 2, 11, 16, 17, 20). In these instances, there is a significant result in one sample, but a result statistically indistinguishable from zero in the other. There is no clear pattern whereby one sample consistently produces the larger treatment effect. Importantly, there is not a single instance in which the samples produce significant effects in opposite directions.
We also compare magnitude of effects. An analysis of the difference in effect sizes between samples (i.e. a difference-in-differences) reveals that across the 20 experiments, in only 4 experiments (1, 4, 12, 20) do the samples generate statistically distinguishable effect sizes. In two cases, MTurk overestimates the treatment effect (1, 12), in one it underestimates the effect (4), and in only one (20) it yields a significant effect when the TESS sample indicated no effect.
These results are buttressed by Figure 3, which presents analyses of a second treatment group relative to control for the 16 (of 20) experiments that had a second treatment group. Again, the inferences with respect to the direction and statistical significance of treatment effects are quite similar between samples. Of the 16 experiments, 14 of the TESS treatment effects are replicated in MTurk in terms of direction and statistical significance. Only two experiments diverge from this overall pattern (Experiments 12, 16), but even these cases reflect one experiment barely exceeding the threshold of statistical significance while the other barely falls short of statistical significance. In none of the experiments is there a significant difference in the apparent effect size between samples.

Figure 3 Control vs. Treatment Group 2.
In sum, 29 (or 80.6%) of the 36 treatment effects in Figures 2 and 3 estimated from TESS are replicated by MTurk in the interpretation of the statistical significance and direction of treatment effects. Importantly, of the seven experiments for which there is a significant effect in one sample, but a null result in the other, only one (Experiment 20) actually produced a significantly different effect size estimate (Gelman and Stern Reference Gelman and Stern2006). Across all tests, in no instance did the two samples produce significantly distinguishable effects in substantively opposite directions.
Although sample weighting is not the primary focus of this paper (i.e. we did not weight convenience samples because they are typically used without weights), we explored the possibility of weighting MTurk data using the same variables and data that GfK uses for its post-survey weighting.Footnote 12 The results are shown in Figures A1 and A2 in the Appendix (Figure A3 shows results comparing treatment groups, where applicable). Results were decidedly mixed: for the seven treatment effects for which the samples differed in interpretation of statistical significance, the re-weighting of MTurk data eliminated two of these differences (11, 20), but exacerbated between-sample differences in two others (9, 19). Clearly, more research is needed to understand the consequences of even basic weighting adjustments to improve the generalizability of causal inferences from convenience samples.
DISCUSSION
As funding for social science decreases (Lupia Reference Lupia2014), technological improvements allow researchers to implement human subjects research at ever-lower costs. Novel types of convenience samples, such as MTurk, have been described as “social science for pennies” (Bohannon Reference Bohannon2011). Indeed, although the actual costs varied slightly by experiment, a single study in TESS costs about $15,000 while the same study was implemented with a comparable sample size on MTurk for about $500 (or even less in some of the other convenience samples). It is important to understand the implications of these alternative data collection approaches both to optimize resource allocation and to ensure progress of basic (e.g. Mutz Reference Mutz2011) and applied (e.g. Bloom Reference Bloom2005) research.
We find that, generally speaking, results from convenience samples provide estimates of causal effects comparable to those found on population-based samples. As mentioned, this differs somewhat from other broad replication efforts in neighboring disciplines (Open Science Collaboration 2015: 943). Varying replication rates may stem from an assortment of factors that produce treatment effect heterogeneity—such as the canonical dimensions of external validity sample, settings, treatments, and outcome measures (Shadish et al. Reference Shadish, Cook and Campbell2001), from uneven delineation or implementation of experimental protocol, or variation in topic/discipline. Clearly, more work is needed to identify conditions that influence experimental replicability (see, e.g. Barabas and Jerit Reference Barabas and Jerit2010; Coppock and Green Reference Coppock and Green2015; Hovland Reference Hovland1959; Jerit et al. Reference Jerit, Barabas and Clifford2013).
Of equal, if not greater importance, are what our findings suggest when it comes to using convenience samples in experimental research. Our results may be reassuring for those who have little choice but to rely on cheaper convenience samples; yet, one should not conclude that convenience samples are a wholesale or even partial substitute for population samples. For one, replications do not always succeed with different samples. Moreover, there are at least three reasons why population samples remain critical to social-science experimentation. First, when one uses a convenience sample, its relationship to the population of interest is unknown and typically unknowable. Thus, one cannot assuredly conclude it generalizes, even if the demographics of the sample seem to match the demographics of the larger population of interest (e.g. U.S. citizens) or if data are reweighted to match population distributions. There always exists the possibility that unmeasured features of the sample skew it from the population of interest. In cases where a given sample ostensibly matches the population of interest on key variables, it may still have problematic joint distribution properties. For example, relative to a population-based sample, a convenience sample may have similar percentages of older individuals and racial minorities, but may not match the population-based sample with respect to older minorities (Freese et al. Reference Freese, Howat, Mullinix and Druckman2015; Huff and Tingley Reference Huff and Tingley2015). These types of uncertainties inherent in convenience sample also vitiate their potential impact in some applied settings.
Second, experiments often have heterogeneous treatment effects such that the treatment effect is moderated by individual-level characteristics (e.g. the treatment effect differs among distinct subgroups of the sample; see Gerber and Green Reference Gerber and Green2011) or contextual variations (timing, geography, etc.). Recall the Hurricane Katrina experiment we described at the start of the paper—it could be that the treatment effect of offering officials’ job descriptions lessened the impact of partisanship in opinion formation among weakly identified partisans but less so (or not at all) among strongly identified partisans. In this case, there is heterogeneity in the treatment effect depending on subgroups. If one has a well-developed theory about heterogeneous treatment effects, then convenience samples only become problematic when there is a lack of variance on the predicted moderator (e.g. the sample consists largely of strong partisan individuals) (Druckman and Kam Reference Druckman, Kam, Druckman, Green, Kuklinski and Lupia2011). Even with a theory in hand some convenience samples would be inappropriate such as a student sample where a moderator is age, a university staff sample where a moderator is education, or MTurk when a moderator is religion (i.e. MTurk samples tend to be substantially less religious than the general population).
Moreover, in reality, many areas of the social sciences have not developed such precise theories. Scholars have consequently begun to employ machine learning algorithms that automate the search for heterogeneous treatment effects (e.g. Egami and Imai Reference Egami and Imai2015; Green and Kern Reference Green and Kern2012). In so doing, population samples have the unique advantage not only of containing substantial variance on the full range of population demographics, each of which could potentially moderate, but also of avoiding the joint distribution problem mentioned above.
Third, the nature of convenience samples can change over time. This is particularly true of MTurk for which there is a growing concern that respondents have evolved to be less and less like respondents in other surveys (even survey panels).Footnote 13 Rand et al. (Reference Rand, Peysakhovich, Kraft-Todd, Newman, Wurzbacher, Nowak and Greene2014) report that in MTurk data collected between February 2011 and February 2013, the median MTurk respondent reported participation in 300 academic studies, 20 of which were in the last week; moreover, they note that, over the time period they studied, “the MTurk subject pool [had] transformed from naïve to highly experienced. . . [and this] makes it likely that subjects will be familiar more generally with experimental paradigms. . .” (4–5; also see Chandler et al. Reference Chandler, Mueller and Paolacci2014). Relatedly, it could be that MTurk respondents may differ in terms of fundamental motivation, based on how often they participate in surveys. Some participate strictly to earn money through piecework, and opt-in or randomly selected survey respondents, while others participate in survey experiments more for intrinsic rewards or other non-monetary reasons. The ethics of this difference in relationship between researcher and subject, and any possible empirical consequences thereof, merit further consideration (c.f. Dynamo 2014). Notably, what is considered a fair incentive for study participation on MTurk is likely to change over-time and the particular rewards offered here may not be appropriate in the future. There are thus various reasons to closely monitor whether MTurk becomes less reliable in terms of replicating population-based experimental inferences. Researchers should also be cognizant of crowd-sourcing platforms beyond MTurk (Benoit et al. Reference Benoit, Conway, Lauderdale, Laver and Mikhaylov2015).
One can only assess the implications of the changing nature of any convenience sample if there is a relevant population sample with which to compare. In short, population survey experiments serve as a critical baseline that allows researchers to assess the conditions under which convenience samples provide useful or misleading inferences. Indeed, we began by stating that assessing the validity of any convenience sample is an empirical question and going forward that will continue to be the case—and can only be evaluated with the continued wide-scale implementation of population-based survey experiments.Footnote 14
In sum, convenience samples can play a fruitful role as research agendas progress. They are useful testing grounds for experimental social science. Yet, they do not replace the need for studies on population samples; rather, convenience samples serve as a place to begin to test hypotheses and explore whether they are falsified, which coheres with the Popperian approach to causation (Campbell Reference Campbell, Rosenthal and Rosnow1969, 361). Our efforts highlight that scientific knowledge advances through replication rather than accepting or rejecting research based on sample-related heuristics. Convenience samples can lead to substantial progress in the social sciences, most acutely when researchers understand the conditions under which those samples are more or less likely to provide generalizable population inferences. This can best be done through theory and continued empirical comparisons across samples. As such, our findings contribute to more efficient and robust experimental social sciences that generate data for more studies by taking unreserved advantage of cost-effective ways of conducting studies when they are likely to provide a good reflection of population estimates. An inexpensive and high quality platform for implementing survey experiments not only reduces the cost of traditional experiments, but allows researchers to explore more complex and over-time designs (Ahler Reference Ahler2014; Fowler and Margolis Reference Fowler and Margolis2014). In so doing, we can more judiciously save the strengths of population-based samples for projects with the strongest justification that the extra expense is needed for accurate inference.
SUPPLEMENTARY MATERIALS
For supplementary material for this article, please visit http://dx.doi.org/10.1017/XPS.2015.19.
APPENDIX
Study 1: Student Loans Experiment Treatment Group Means, Effects, and Sample Sizes

Study 1: Hate Rally Experiment Treatment Group Means, Effects, and Sample Sizes

Study 1: DREAM Act Experiment Treatment Group Means, Effects, and Sample Sizes

Study 1: Demographics


Figure A1 Control vs. Treatment Group 1.
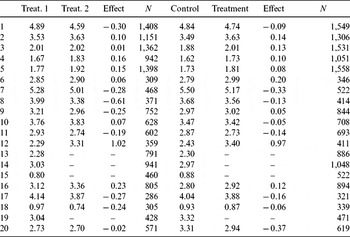
Study 2: Treatment Group 1 Treatment Group Means, Effects, and Sample Sizes (TESS Weighted and TESS Unweighted)

Study 2: Treatment Group 1 Treatment Group Means, Effects, and Sample Sizes (MTurk Weighted and MTurk Unweighted)


Figure A2 Control vs. Treatment Group 2.
Study 2: Treatment Group 2 Treatment Group Means, Effects, and Sample Sizes (TESS Weighted and MTurk Unweighted)

Study 2: Treatment Group 2 Treatment Group Means, Effects, and Sample Sizes (MTurk Weighted and MTurk Unweighted)


Figure A3 Treatment Group 2 vs. Treatment Group 1.
Study 2: Treatment Group 2 versus Treatment Group 1 Means, Effects, and Sample Sizes (TESS Weighted and TESS Unweighted)

Study 2: Treatment Group 2 versus Treatment Group 1 Means, Effects, and Sample Sizes (MTurk Weighted and MTurk Unweighted)
Study 2: Demographics (Sex and Age)

Study 2: Demographics (Race and Ethnicity)

Study 2: Demographics (Education)


