1. Introduction
Skarn deposits are important resources of gold, silver, lead, zinc, tin, tungsten, iron, copper and other metallic elements (Einaudi et al. Reference Einaudi, Meinert, Newberry and Skinner1981; Hedenquist & Lowenstern, Reference Hedenquist and Lowenstern1994; Meinert et al. Reference Meinert, Dippl and Nicolescu2005). Although most skarns are found in lithologies containing at least some carbonate, they can form in almost any rock type (including volcanic rocks; e.g. Meishan Fe skarn in China; Tongon Au skarns in Cote d’Ivoire; Zhang, Reference Zhang2012; Lawrence et al. Reference Lawrence, Allibone, Chang, Meffre, Lambert-Smith and Treloar2017) as a result of a variety of metasomatic processes (Meinert, Reference Meinert1992, Meinert et al. Reference Meinert, Dippl and Nicolescu2005). Most are found adjacent to plutons, but they can also occur along faults and major shear zones (e.g. Zhibula Cu deposit; Hahaigang W–Mo deposit; Li et al. Reference Li, Wang, Mao, Xu and Liu2014 b; Xu et al. Reference Xu, Zheng, Sun, Jiang, Geng and Shen2014 b; Meinert et al. Reference Meinert, Dippl and Nicolescu2005). Zinc–lead skarns usually occur distal to associated igneous rocks (e.g. Huaniushan Pb–Zn–Ag deposit; Li, Reference Li2018), and grade outwards from skarn-rich mineralization to skarn-poor ores, veins and massive sulphide bodies, which may contain few if any skarn minerals (Meinert et al. Reference Meinert, Dippl and Nicolescu2005).
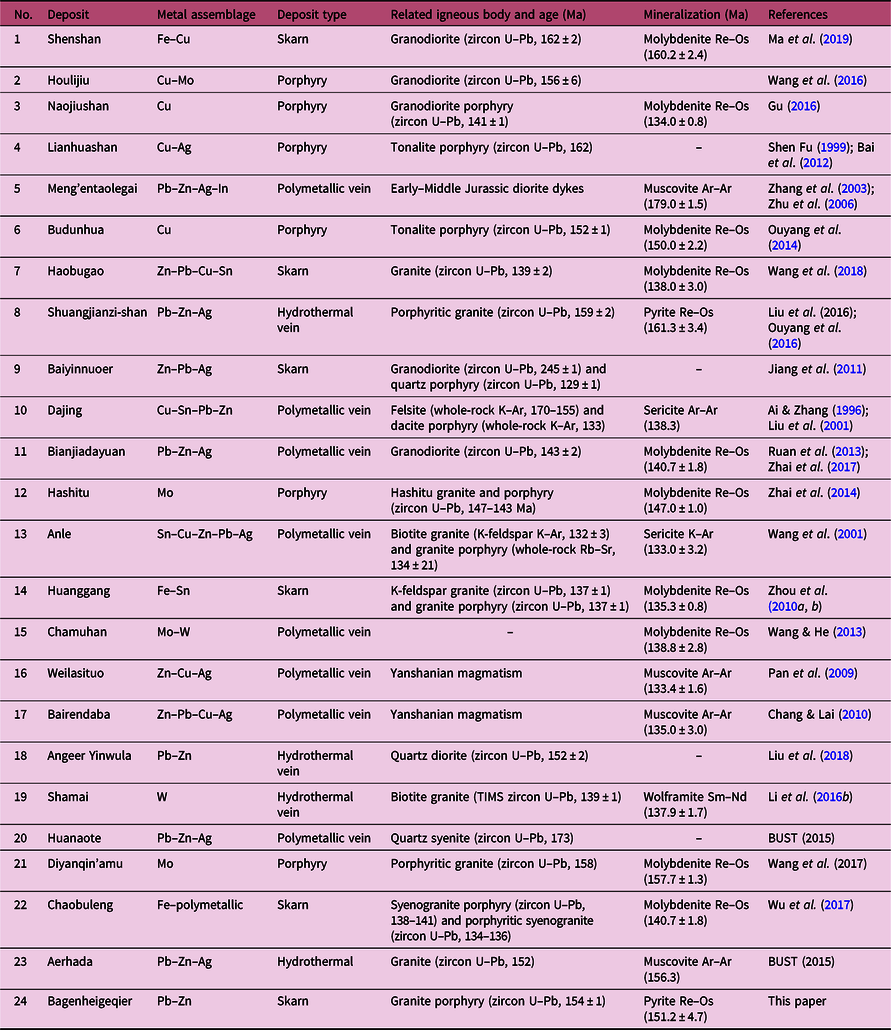
The Southern Great Xing’an Range (SGXR), located in the eastern part of the Central Asian Orogenic Belt (CAOB; Fig. 1), is considered to be one of the most important polymetallic metallogenic belts in NE China (Shen & Fu, Reference Shen and Fu1999; Zeng et al. Reference Zeng, Liu, Yu, Ye and Liu2011; Shu et al. Reference Shu, Lai, Sun, Wang and Meng2013; Ouyang et al. Reference Ouyang, Mao, Zhou and Su2015). A number of large-, medium- and small-sized ore deposits, comprising porphyry, skarn, hydrothermal vein and epithermal types, have been discovered in this region (Ouyang et al. Reference Ouyang, Wu, Mao, Santosh, Zhou, Li and Su2014; Zhai et al. Reference Zhai, Liu, Wang, Yang, Zhang, Wang, Zhang, Wang and Liu2014; Liu et al. 2016; Wu et al. Reference Wu, Wang, Zhou, Wang, Zuza, Liu, Jiang, Liu and Ma2017; Wang et al. Reference Wang, Xu, Lv, Wei, Mei, Fan and Sun2018). Most deposits appear to be closely associated with Late Mesozoic (Jurassic–Cretaceous) magmatic–hydrothermal activity (Table 1; Zeng et al. Reference Zeng, Liu, Yu, Ye and Liu2011; Ouyang et al. Reference Ouyang, Mao, Zhou and Su2015).

Fig. 1. (a) Simplified tectonic map of eastern Asia, modified after Li (Reference Li2006). (b) Tectonic sketch map of NE China, modified after Wu et al. (Reference Wu, Zhao, Sun, Wilde and Zhang2007). (c) Geological map of the GXR, modified after Bai (Reference Bai2013). CAOB – Central Asian Orogenic Belt; GXR – Great Xing’an Range. The numbers in the green solid circles represent different deposit names; specific deposit names are listed in Table 1.
Table 1. Geochronological data of hydrothermal deposits and related intrusions in the southern Great Xing’an Range, NE China. For the location of these deposits, see Figure 1c

The Bagenheigeqier Pb–Zn skarn deposit is located in the north segment of SGXR and in the eastern part of the border between China and Mongolia. The deposit contains > 59 326 tons of Pb and 170 298 tons of Zn (106GT, 2013), and exhibits skarn and vein mineralization. The skarn and Pb–Zn orebodies occur in the Baiyin’gaolao Formation and along NE–SW-trending faults. Although several researchers have studied the geological characteristics, sources of ore-forming fluids and materials, and ore genesis of the deposit (Tan et al. Reference Tan, Gao and Liu2010; Wang, Reference Wang2010; Ren & Chen, Reference Ren and Chen2012; Li, 2015; Yao, 2016; Yang et al. Reference Yang, Wang and Zhang2018), several questions remain. The genetic type of this deposit remains controversial. Tan et al. (Reference Tan, Gao and Liu2010) and Yang et al. (Reference Yang, Wang and Zhang2018) argued for a skarn deposit model for the Bagenheigeqier deposit, because its mineralization is characterized by horizontal zoning (Fe–Zn mineralization in the SW and Pb–Zn mineralization in the NE), and a large range of epidote and garnet skarns occur in andesite tuff and granite porphyry. However, Li (2015) claimed that the Bagenheigeqier is a hydrothermal-vein-type deposit, because its lead–zinc orebodies occur in veins and are strictly controlled by NE faults. Wang (Reference Wang2010) and Cai et al. (Reference Cai, Song and Zang2019a) advocated that the Bagenheigeqier is a combination of the skarn type and hydrothermal vein type. In addition, Wang (Reference Wang2010) proposed that the ore-forming fluids were derived from a mixture of magmatic and meteoric water, but the fluid evolution and ore-forming mechanisms were not given. Furthermore, the age of ore formation and the ore-related pluton have yet to be determined. The lack of answers to these questions limits our understanding of the genetic type and genesis of the Bagenheigeqier Pb–Zn deposit. In this contribution, we present microthermometric data of fluid inclusions (FIs), O–H, S and Pb isotope data, and zircon U–Pb and pyrite Re–Os ages for the Bagenheigeqier deposit. These new datasets allowed us to explore the sources of the ore-forming fluids and materials, constrain the age of ore formation and the ore-related intrusion, ascertain the genetic type and discuss ore genesis of the deposit.
2. Geological background
2.a. Geological setting
The CAOB is the world’s largest Phanerozoic accretionary orogen (Sengör et al. Reference Sengör, Natal’in and Burtman1993; Windley et al. Reference Windley, Alexeiev, Xiao, Kröner and Badarch2007; Safonova et al. Reference Safonova, Seltmann, Kroener, Gladkochub, Schulmann, Xiao, Kim, Komiya and Sun2011), located between the East European, Siberia, North China and Tarim cratons (Fig. 1a). The NE China region in the eastern CAOB comprises several microcontinental blocks (Fig. 1a; Sengör et al. Reference Sengör, Natal’in and Burtman1993; Jahn et al. Reference Jahn, Wu and Chen2000; Li, Reference Li2006), namely (from NW to SE) Erguna, Xing’an, Songnen–Zhangguangcai Range, Jiamusi, Khanka and Nadanhada (Fig. 1b; Wu et al. Reference Wu, Zhao, Sun, Wilde and Zhang2007; Xu et al. Reference Xu, Zhao, Zhou, Bao, Wang and Luo2014 a), and these blocks are separated by crustal-scale faults (Fig. 1b).
Previous researchers have reported that NE China evolved under three tectonic regimes related to the Palaeo-Asian Ocean, Mongol–Okhotsk Ocean and Palaeo-Pacific Plate (Wu et al. Reference Wu, Sun, Li, Jahn and Wilde2002). During Palaeozoic time, the Palaeo-Asian oceanic plate underwent bipolar subduction beneath the Siberia Craton and the North China Craton (Windley et al. Reference Windley, Alexeiev, Xiao, Kröner and Badarch2007; Safonova et al. Reference Safonova, Utsunomiya, Kojima, Nakae, Tomurtogoo, Filippov and Koizumi2009; Lehmann et al. Reference Lehmann, Schulmann, Lexa, Corsini, Kröner, Štípská, Tomurhuu and Otgonbator2010), and the ocean was finally closed in a scissors-like manner from west to east along the Solonker–Xra Moron–Changchun area during late Permian – Early Triassic time (Li, Reference Li2006; Wu et al. Reference Wu, Zhao, Sun, Wilde and Zhang2007; Miao et al. Reference Miao, Fan, Liu, Zhang, Shi and Guo2008; Jian et al. Reference Jian, Liu, Kroner, Windley, Shi, Zhang, Zhang, Miao, Zhang and Tomurhuu2010; Xu et al. Reference Xu, Wang, Pei, Meng, Tang, Xu and Wang2013; Wilde, Reference Wilde2015; Eizenhöfer et al. Reference Eizenhöfer, Zhao, Zhang and Sun2014; Li et al. Reference Li, Cai, Fu, Zhang, Wang, Ma and Sun2020 a). During the Mesozoic Era, magmatic activity in NE China was controlled by the combined effects of the Palaeo-Pacific tectonic regime in the east and the Mongol–Okhotsk tectonic regime in the NW (Wu et al. Reference Wu, Sun, Ge, Zhang, Grant, Wilde and Jahn2011; Xu et al. Reference Xu, Wang, Pei, Meng, Tang, Xu and Wang2013; Tang et al. Reference Tang, Xu, Wang, Wang, Xu and Zhang2014, Reference Tang, Xu, Wang, Zhao and Wang2016). A scissors-like closure of the Mongol–Okhotsk Ocean occurred from Late Triassic time (in the west) to Late Jurassic time (in the east) (Zonenshain et al. Reference Zonenshain, Kuzmin and Natapov1990; Zorin, Reference Zorin1999; Sorokin et al. Reference Sorokin, Yarmolyuk, Kotov, Sorokin, Kudryashov and Li2004). Subsequently, NE China was in a post-collisional extensional environment, leading to the production of large volumes of magmatic rock during Late Jurassic time and the early stage of the Early Cretaceous Period, including A-type granitoids, A-type rhyolites and alkaline rhyolites (Wang et al. Reference Wang, Zhou, Zhang, Ying, Zhang, Wu and Zhu2006; Wu et al. Reference Wu, Sun, Ge, Zhang, Grant, Wilde and Jahn2011; Meng et al. Reference Meng, Xu, Yang, Qiu, Li and Zhu2011; Xu et al. Reference Xu, Xu, Meng and Wang2011; Tang et al. Reference Tang, Xu, Wang, Zhao and Li2015; Li et al. Reference Li, Wang, Fu, Zhang, Liu, Liu, Tang and Wang2020 b). The Mongol–Okhotsk tectonic regime extended spatially at least as far as the eastern margin of the Xing’an Massif (the west of the Songliao Basin) and the northern margin of the North China Craton (Xu et al. Reference Xu, Wang, Pei, Meng, Tang, Xu and Wang2013; Li et al. Reference Li, Xu, Tang, Pei, Wang and Sun2018). Since Jurassic time, the tectonics of NE China and the Russian Far East have also been influenced by the oblique subduction of the Palaeo-Pacific Plate (Wu et al. Reference Wu, Sun, Li, Jahn and Wilde2002, Reference Wu, Sun, Ge, Zhang, Grant, Wilde and Jahn2011; Li et al. Reference Li, Zhao, Sun, Wu, Liu, Hao, Han and Luo2004), which produced three phases of regional calc-alkaline magmatism during Early–Middle Jurassic, Early Cretaceous and Late Cretaceous time (Pei et al. Reference Pei, Xu, Yang, Yu, Meng and Zhao2011; Wu et al. Reference Wu, Sun, Ge, Zhang, Grant, Wilde and Jahn2011; Xu et al. Reference Xu, Wang, Pei, Meng, Tang, Xu and Wang2013; Cai et al. Reference Cai, Wang, Li, Fu, Wang, Yasssa and Li2019 b). The metallogenetic events discussed in this paper are most likely related to the regime involving the closure of the Mongol–Okhotsk Ocean (e.g. Jiang et al. Reference Jiang, Nie, Liu and Yun2010; Seltmann et al. Reference Seltmann, Soloviev, Shatov, Pirajno, Naumov and Cherkasov2010; Xue et al. Reference Xue, Nie, Dai, Peng and Liu2010; Chen et al. Reference Chen, Zhang, Wan and Cleven2011; Liu et al. Reference Liu, Wu, Qiu and Li2013; Yang et al. 2014; Zeng et al. Reference Zeng, Qin, Liu, Li, Zhai, Chu and Guo2015), which resulted in widespread porphyry–skarn–epithermal mineralization in the Great Xing’an Range (GXR) (Shen & Fu, Reference Shen and Fu1999; Ouyang et al. Reference Ouyang, Wu, Mao, Santosh, Zhou, Li and Su2014; Zhai et al. Reference Zhai, Liu, Wang, Yang, Zhang, Wang, Zhang, Wang and Liu2014; Li et al. Reference Li, Fu, Tang, Li, Lin, Zhang, Wang, Zhao, Dang and Zhao2016 b; Wang et al. 2017; Wu et al. Reference Wu, Wang, Zhou, Wang, Zuza, Liu, Jiang, Liu and Ma2017).
2.b. Regional geology
The GXR is located in the eastern part of the CAOB (Fig. 1a). The Solonker–Xra Moron–Changchun Fault (F4) forms its boundary with the North China Craton to the south, and the Nenjiang Fault (F10) marks its boundary with the Songliao Basin and Lesser Xing’an Range to the east (Fig. 1b). The regional stratigraphy of the GXR includes Mesozoic, Palaeozoic and minor Neoproterozoic rocks (Fig. 1c). The Neoproterozoic rocks comprise amphibolite, gneiss, granulite and quartz schist (Ge et al. Reference Ge, Wu, Zhou and Rahman2005; Miao et al. Reference Miao, Liu, Zhang, Fan, Shi and Xie2007; Cui et al. Reference Cui, Zheng, Ding, Xu, Li, Shi, Gao, Gao and Zhang2014). Palaeozoic rocks trend mainly NE–SW (Fig. 1c) and consist of carbonate/volcanic/clastic-sedimentary rocks (e.g. limestone, marble, siltstone, sandstone, volcanic lava and volcanic tuff) (Fan et al. Reference Fan, Mao, Zhang, Sun and Li1997; Shao et al. Reference Shao, Zhang, Mou and Han2007; Ouyang, Reference Ouyang2013). Mesozoic rocks are widespread in a zone that trends NE–SW and are restricted to the Jurassic and Cretaceous strata (Fig. 1c). They comprise a series of volcanic/pyroclastic rocks (e.g. rhyolite, andesite, andesite basalt, tuff and tuffaceous sandstone) (Shen & Fu, Reference Shen and Fu1999; Shao et al. Reference Shao, Zhang, Mou and Han2007; Meng et al. Reference Meng, Xu, Yang, Qiu, Li and Zhu2011; Gou et al. Reference Gou, Sun, Zhao, Ren, Zhang, Fu, Wang and Wei2010). In addition, the Jurassic rocks of the Tamulangou and Baiyin’gaolao Formations are closely related to the Pb–Zn–Ag mineralization in the area (Wu, Reference Wu2006; Shuang, Reference Shuang2012). The structural pattern in the GXR is dominated by the NE–SW- and NNE–SSW-trending faults (Fig. 1c). These faults define the Mesozoic tectonic framework of the area and controlled the distribution of Mesozoic plutonic and volcanic rocks, as well as the metallic ore deposits in the GXR (Shen & Fu, Reference Shen and Fu1999; Shuang, Reference Shuang2012). A large volume of igneous rock occurs in the GXR, and the ages of these rocks, as reported previously (Wu et al. Reference Wu, Sun, Li, Jahn and Wilde2002, Reference Wu, Jahn, Wilde, Lo, Yui, Lin, Ge and Sun2003, Reference Wu, Sun, Ge, Zhang, Grant, Wilde and Jahn2011; Ge et al. Reference Ge, Wu, Zhou and Rahman2005, Reference Ge, Wu, Zhou and Zhang2007; Sui et al. Reference Sui, Ge, Wu, Xu and Wang2006, Reference Sui, Ge, Xu and Zhang2009; Bao et al. Reference Bao, Zhang, Wu, Wang, Li, Sang and Liu2007; Li et al. Reference Li, Gao, Sun, Li and Wang2007; Qin et al. Reference Qin, Yin, Wang, Guo, Liu and Zhou2007; Zhang et al. Reference Zhang, Ge, Liu and Zhang2008, Reference Zhang, Ge, Gao, Chen and Zhao2010), indicate four periods of Phanerozoic magmatism: Cambrian–Ordovician (517–446 Ma), Carboniferous–Permian (359–264 Ma), Triassic – Early Jurassic (252–170 Ma), and Late Jurassic – Early Cretaceous (157–120 Ma). The Late Jurassic – Early Cretaceous intrusive rocks include widespread I- and A-type granites (e.g. granodiorites, monzogranites, syenogranites and tonalites) (Wu et al. Reference Wu, Sun, Li, Jahn and Wilde2002, Reference Wu, Jahn, Wilde, Lo, Yui, Lin, Ge and Sun2003, Reference Wu, Sun, Ge, Zhang, Grant, Wilde and Jahn2011; Ge et al. Reference Ge, Wu, Zhou and Rahman2005; Zhang et al. Reference Zhang, Ge, Liu and Zhang2008). This period of magmatism, in particular, is spatially and temporally related to the regional mineralization (Chang & Lai, Reference Chang and Lai2010; Jiang et al. Reference Jiang, Nie, Bai, Liu and Liu2011; Ruan et al. Reference Ruan, Lu, Liu and Yang2013; Ouyang et al. Reference Ouyang, Li and Zhou2016; Zhai et al. Reference Zhai, Liu, Zhang and Sun2017; Liu et al. Reference Liu, Han, Wang, Li, Li, Cai and Fu2018; Wang et al. Reference Wang, Xu, Lv, Wei, Mei, Fan and Sun2018). The intense tectonic and magmatic activity resulted in extensive hydrothermal mineralization in the GXR (especially in the SGXR). A large amount of Pb–Zn–Ag mineralization (e.g. Bagenheigeqier (Wang, Reference Wang2010), Aerhada (Ke et al. Reference Ke, Zhang, Liu, Zhai, Guo, Yang, Tan, Xu, Zhang and Wang2017) and Huanaote (BUST, 2015)), Cu–polymetallic mineralization (e.g. Naoniushan (Gu, Reference Gu2016), Lianhuashan (Shen & Fu, Reference Shen and Fu1999; Bai et al. Reference Bai, Sun, Sun, Gu, Zhao and Men2012) and Budunhua (Ouyang et al. Reference Ouyang, Wu, Mao, Santosh, Zhou, Li and Su2014)) and Mo (–W) mineralization (e.g. Chamuhan (Wang & He, Reference Wang and He2013), Hashitu (Zhai et al. Reference Zhai, Liu, Wang, Yang, Zhang, Wang, Zhang, Wang and Liu2014) and Diyanqin’amu (Wang et al. 2017)) was formed in SGXR during late Mesozoic time.
3. Geology of the Bagenheigeqier deposit
3.a. Ore district geology
The Bagenheigeqier Pb–Zn deposit is located 230 km NW of Ulanhot City in the NE part of Inner Mongolia (46° 39' 05'’ to 46° 39' 48'' N, 119° 58' 31'' to 119° 59' 46'' E; Fig. 2). The strata exposed in the ore district are mainly those of the Upper Jurassic Baiyin’gaolao Formation, the Tertiary Wuchagou Formation and Quaternary sediments (Fig. 2). The Baiyin’gaolao Formation is exposed widely in the ore district, and can be subdivided into three lithological segments (Fig. 2; Tan et al. Reference Tan, Gao and Liu2010; Ren & Chen, Reference Ren and Chen2012; Yao, 2016). The upper segment trends NE–SW and dips to the NW (270–320°) at 35–70° with a thickness of c. 400 m (106GT, 2013). The rocks of the upper segment include grey andesitic tuff, andesitic crystal tuff and minor andesitic breccia tuff-lava, and these rocks host the Pb–Zn orebodies (Tan et al. Reference Tan, Gao and Liu2010; Fig. 3). The host rocks contain a lot of calcium-rich minerals (e.g. plagioclase, amphibole and minor apatite), which may provide a calcium source for the formation of skarn. The middle segment is c. 300 m thick, strikes NE–SW, and dips to the NW (310–320°) at 47–60° (106GT, 2013). These rocks comprise grey-white rhyolitic tuffs and minor amounts of a rhyolitic lithic breccia tuff (Tan et al. Reference Tan, Gao and Liu2010). The lower segment dips at 35–40° N (340–010°), is more than 1000 m thick, and contains mainly light-grey to dark-grey andesitic tuffs (106GT, 2013). The variations in dip and strike of Baiyin’gaolao Formation may be caused by the different intensity of volcano-sedimentation during the formation of strata and/or by the subsequent tectonic activity. The Wuchagou Formation primarily comprises andesitic basalt, and is exposed in the SW part of the ore district (Fig. 2). Two major faults exist in the Bagenheigeqier ore district (Fig. 2). The F2 fault is c. 1300 m long and 1–80 m in width, with a strike of 35–55° and a dip of 40–75° (Wang, Reference Wang2010; Yao, 2016). F2 fault is consistent with the occurrence of the Pb–Zn orebodies and has controlled the distribution of the orebodies (Fig. 3; Li, 2015). This NE–SW-trending tensile shear fault hosts angular tuffaceous breccia with weak skarn, sphalerite and malachite mineralization (106GT, 2013). Furthermore, it fits into the Mesozoic regional NE–SW-trending extensional fault and is related to the evolution of the Mongo–Okhotsk Ocean (Zheng et al. Reference Zheng, Sun, Zhu, Tian, Wang and Zhang2015). The other fault (F3) trends 355°, dips at 60–75° E, and is c. 1000 m in length and 20 m in width (106GT, 2013). This fault is characterized by right lateral movement (Fig. 2) and hosts angular breccia and numerous carbonate veins (Wang, Reference Wang2010). The igneous rocks in the ore district are mainly monzogranite porphyry and granite porphyry, along with small amounts of dioritic porphyry and granite (Fig. 2). The monzogranite porphyry forms a batholith in the NE of the ore district where it intruded the Baiyin’gaolao Formation (Fig. 2; Li, 2015; 106GT, 2013). The granite porphyry has been recognized in drillcore/tunnel and below the Pb–Zn orebodies, at a distance of 20–250 m (Fig. 3). Hornfels, skarn (epidote, garnet and diopside) and carbonate veins are found where the granite porphyry is in direct contact with the Baiyin’gaolao Formation. The dioritic porphyry and granite occur as a dyke and also intrude the Baiyin’gaolao Formation in the ore district (Fig. 2; 106GT, 2013).

Fig. 2. Geological map of the Bagenheigeqier Pb–Zn deposit, modified after 106GT (2013).

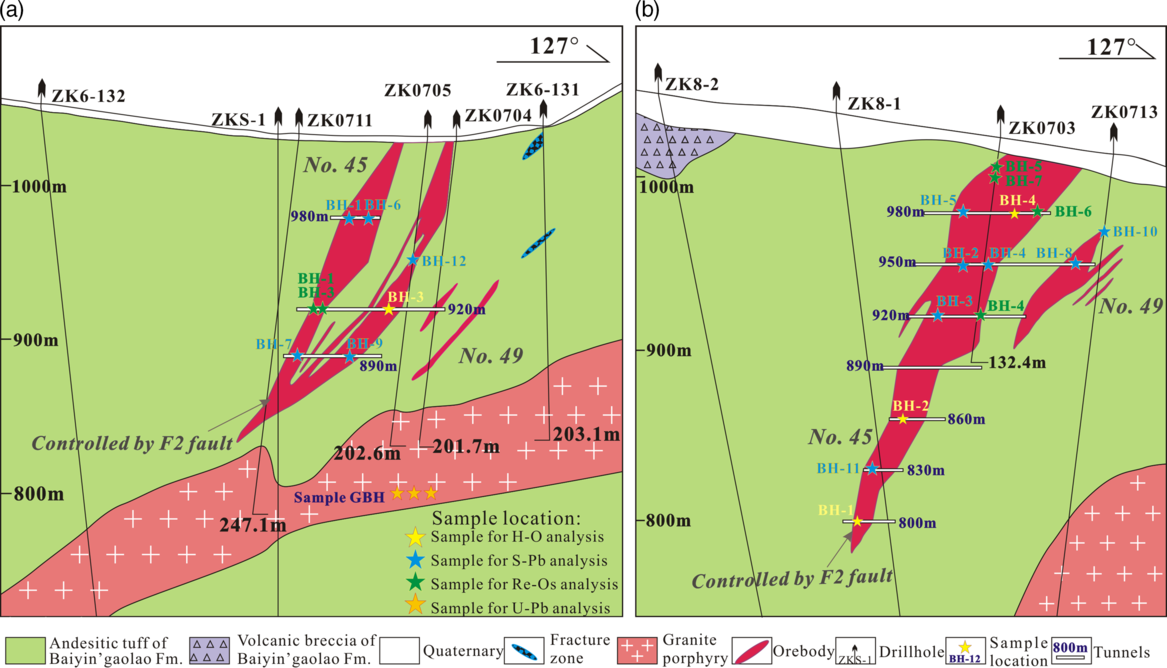
Fig. 3. Geological cross-section of the deposit along exploration line (a) 6 and (b) 8, modified after 106GT (2013) and Li (2015).
Extensive alteration in host rocks (granite porphyry and andesitic tuff) is zoned horizontally and comprises skarn, propylite, chlorite and silicic alterations with increasing distance from the orebodies (Fig. 2; Yang et al. Reference Yang, Wang and Zhang2018; Cai et al. Reference Cai, Song and Zang2019 a). Vertically, the host rocks are dominated by garnet and minor diopside alterations (at the base) overlying epidote and chlorite (in the middle part), and quartz, carbonate and fluorite alterations (at the top) (106GT, 2013).
3.b. Orebodies
Two Pb–Zn orebodies (Nos 45, 49) have been identified in the Bagenheigeqier deposit, and they are mostly hosted in the andesitic tuff of the upper segment of the Baiyin’gaolao Formation (Fig. 3). These orebodies both trend NE–SW, controlled by the F2 fault, and occur in veins (Fig. 3). The (Fe)–Zn mineralization occurs in granite porphyry and andesitic tuff, located in the SW deep part of F2 fault zone, while Pb–Zn mineralization occurs in andesitic tuff, located in the NE shallow part of F2 fault zone (Yang et al. Reference Yang, Wang and Zhang2018). The lenticular No. 45 orebody trends NE–SW, dips at 40–70° NW and occurs in the upper wall of the orebody group (Fig. 3; 106GT, 2013). It is c. 320 m long, 15–60 m thick and extends downwards for 325 m (Li, 2015). The metal contents of the No. 45 orebody include 0.71–16.39% Zn and 0.31–12.17% Pb (106GT, 2013). The average grade is 3.66% Pb and 5.89% Zn (Li, 2015). The No. 49 orebody is located below the No. 45 orebody (Fig. 3) and dips at 40–71° NW. The orebody is c. 290 m long with an average thickness of 6.82 m (Li, 2015). The average grade is 4.58% Pb and 1.98% Zn (106GT, 2013).
4. Sampling and analytical methods
For the petrographic examination and microthermometric analyses of FIs, 27 samples were collected from core and mining tunnels (Fig. 3), 14 of which were selected for hydrogen and oxygen isotopic analyses (Fig. 3). A total of 12 sulphide samples (pyrite, arsenopyrite, sphalerite and galena) were collected from core and mining tunnels for sulphur and lead isotopic analysis (Fig. 3). For the Re–Os isotope analyses, six pyrite samples were collected from the core and mining tunnels (Fig. 3); they were taken from disseminated or vein Pb–Zn ores, and some pyrites that seemed to coexist with other stages of ore minerals were not analysed. A granite porphyry sample was collected from the 800-m-level tunnel for zircon U–Pb dating (Fig. 3).
4.a. Fluid inclusions
Petrographic examination, microthermometric analyses, and gas composition of FIs were undertaken at the Laboratory of Geological Fluid, Jilin University, Changchun, China. Doubly polished thin-sections (c. 0.20 mm thick) were made from paragenetic quartz crystals of four stages (II–V) in the Bagenheigeqier deposit. Microthermometric analyses were conducted on a Linkam THMS-600 heating–freezing stage with a temperature range of –196 to 600°C. The heating rates were 0.1°C min–1 when phase transitions were approached. The precision of the temperature measurements was ± 0.2°C during freezing and ± 2°C during heating. In order to determine the gas composition of a single inclusion, the representative FIs were analysed by RM-2000 laser Raman microprobe, argon ion laser and 514 nm laser source. The spectral area was 4500–8501 cm–1, and the resolution was ± 2 cm–1. The accumulation time of analysis was 60 s and the beam spot size was 1 μm.
4.b. Hydrogen and oxygen isotopic analyses
A total of 14 quartz samples were selected for hydrogen and oxygen isotopic analyses, and crushed and ground into powders of 40–80 mesh. Hydrogen and oxygen isotopes were analysed at the Analytical Laboratory of the Beijing Research Institute of Uranium Geology, China National Nuclear Corporation (CNNC), Beijing, China, using a Finnigan MAT253 mass spectrometer. For hydrogen isotopic analysis, water from FIs was released from the samples by heating to c. 500°C. The water then reacted with zinc powder at 410°C to generate hydrogen (Friedman, Reference Friedman1953). Oxygen was extracted from quartz by reaction with BrF5 and converted to CO2 on a platinum-coated carbon rod for oxygen isotopic analysis, following the method of Clayton & Mayeda (Reference Clayton and Mayeda1963). The δ18O and δD values are reported in per mil notation (‰) relative to Vienna Standard Mean Ocean Water (V-SMOW) standards, with analytical uncertainties (1σ) of ± 2‰ for δD and ± 0.2‰ for δ18O.
4.c. Sulphur and lead isotopic analysis
A total of 12 sulphide samples (pyrite, arsenopyrite, sphalerite and galena) were collected for sulphur and lead isotopic analysis. All sulphide separates were further purified (> 99% purity) by hand-picking under a microscope. The sulphur and lead isotopic analyses were analysed at the Analytical Laboratory of the Beijing Research Institute of Uranium Geology, China National Nuclear Corporation (CNNC), Beijing, China. Sulphur isotopic analyses were performed using a MAT-251 mass spectrometer, and sulphur isotopic compositions of sulphide minerals were measured using the conventional combustion method (Robinson & Kasakabe, Reference Robinson and Kasakabe1975). Sulphur isotope ratios are reported as δ34S relative to the Vienna Canyon Diablo Troilite (V-CDT), with an analytical reproducibility of ± 0.2‰.
Lead isotopic analyses were performed using a MAT-261 thermal ionization mass spectrometer. A total of 10–50 mg of each sample was first leached in acetone to remove surface contamination and then washed in distilled water and dried in an oven at 60°C. Washed sulphides were dissolved in a dilute solution of nitric and hydrofluoric acids. Following ion exchange chemistry, the Pb in the solution was loaded onto Re filaments using a phosphoric acid–silica gel emitter. The measured Pb isotope ratios were corrected for instrumental mass fractionation of 0.11% per atomic mass unit with reference to repeated analyses of the NBS-981 Pb standard. The analytical precision of Pb isotopes is better than ± 0.09‰.
4.d. Pyrite Re–Os dating
Six pyrite samples were first crushed, and the pyrite was separated and hand-picked under a binocular microscope. Fresh pyrite grains (< 0.1 mm in size and with a purity of > 99%) were used for the Re–Os isotope analyses at the State Key Laboratory of Isotope Geochemistry, Guangzhou Institute of Geochemistry, Chinese Academy of Sciences, Guangzhou, China. Details of the analytical procedures are given by Li et al. (Reference Li, Jiang, Xu, Zhong, Wang, Wang and Zhao2014 a, 2015b). Repeated analyses of an Os standard solution (Merck Chemical AA standard solution) yielded a mean 187Os/188Os value of 0.12052 ± 0.00032 (2 standard errors (SE); n = 5) for the period of analysis. These values are in good agreement with the value of 0.12022 ± 0.00020 (2SE; n = 14) that was obtained on the same mass spectrometer in Faraday cup mode (Li et al. Reference Li, Liang, Xu, Suzuki and Dong2010). The rhenium mass fraction was analysed on an inductively coupled plasma – mass spectrometer (ICP-MS) (Thermo Elemental X2 Series). A conventional low-volume quartz impact bead spray chamber with a Peltier cooling device (3°C) and a 0.4 mL min–1 borosilicate nebulizer (MicroMist GE) was used in the determinations. Total procedural blanks (TPBs) were 0.72 ± 0.44 pg (1σ; n = 2) with an 187Os/188Os ratio of 0.67 ± 0.55 (1σ; n = 2) on average for Os and 4.0 ± 0.1 pg (1σ; n = 2) for Re. All data were corrected for the procedural blanks for each analytical batch. The average values (187Os/188Os = 0.13369 ± 0.00014; Os = 0.340 ± 0.032 ppb; Re = 0.691 ± 0.002 ppb; 1σ; n = 2) are in good agreement with published data for the basaltic reference material BIR-1 (Ishikawa et al. Reference Ishikawa, Senda, Suzuki, Dale and Meisel2014; Li et al. Reference Li, Wang, Xu, Xu, Tang and Wang2015 a; Zhang et al. Reference Zhang, Li, Long, Sun, Yin and Dai2017 a). Repeated analyses of the Os standard solution yielded a mean 187Os/188Os value of 0.12042 ± 0.000222 (2SE; n = 10) for the period of analysis. These values are in good agreement with the value of 0.12022 ± 0.00020 (2SE; n = 14) obtained on the same mass spectrometer in Faraday cup mode (Li et al. Reference Li, Liang, Xu, Suzuki and Dong2010). Errors for Re and Os concentrations and 187Re/188Os and 187Os/188Os isotope ratios included spike calibration uncertainties and the in-run precision during the mass spectrometry measurements for both Re and Os. The Re–Os isochron age was calculated using Isoplot/Excel version 3.0. Absolute uncertainties of the Re–Os data are given at the 2σ level (Ludwig, Reference Ludwig2003).
4.e. Zircon U–Pb dating
The granite porphyry sample was crushed and zircon grains separated using conventional heavy liquid and magnetic techniques at Langfang Sincerity Geological Service Co. Ltd (Hebei, China). Cathodoluminescence (CL) images were collected at Sample Solution Analytical Technology, Wuhan, China using a CL spectrometer (Garton Mono CL3+) on a Quanta 200F ESEM with a 120 s scanning time under conditions of 15 kV and 120 nA. Distinct domains within the zircons were selected for analysis based on the CL images. The U–Pb ages of zircons were measured at the Key Laboratory of Mineral Resources Evaluation in NE Asia, Ministry of Land and Resources, Changchun, China using an Agilent 7500c quadrupole ICP-MS and 193 nm ArF Excimer laser (COMPexPro 102, Coherent, DE) with an automatic positioning system. The laser spot size was set to 32 μm for most analyses, with the laser energy density set at 10 J cm–2 and a repetition rate of 8 Hz. The ablated material was carried into the ICP-MS by a high-purity helium gas stream with a flux of 1.15 L min–1. The laser path was fluxed with Ar (600 mL min–1) to increase stability. The international standard zircon 91500 was used as the external standard (Wiedenbeck et al. Reference Wiedenbeck, Allé, Corfu, Griffin, Meier, Oberli, Quadt, Roddick and Spiegel1995), the standard silicate NIST 610 glass was used to optimize the instrument and age measurements of the GJ-1 standard zircon were used for validation. 206Pb/238U ratios were calculated using the ICPMSDataCal program (Version 9.9; Liu et al. Reference Liu, Gao, Hu, Gao, Zong and Wang2010), and the concordia age diagrams and probability density plots were obtained using Isoplot (Version 3.0; Ludwig, Reference Ludwig2003). Common lead was corrected following Andersen (Reference Andersen2002).
5. Results
5.a. Ore paragenesis
The metallic minerals in the Bagenheigeqier deposit include sphalerite, galena, pyrite, arsenopyrite, magnetite, hematite and chalcopyrite (Figs 4, 5). Gangue minerals are garnet, diopside, epidote, chlorite, actinolite, quartz, sericite, fluorite and calcite (Figs 4, 5). A large amount of skarn minerals (e.g. garnet, diopside and epidote) widely occur in Bagenheigeqier, which are commonly overprinted by late hydrothermal minerals including galena, sphalerite and other ore minerals, so we give priority to skarn deposits. Based on field and petrographic observations, we recognized five stages of alteration and mineralization (Fig. 6). The mineral assemblage of the skarn stage (stage I) consists mainly of garnet, diopside, magnetite, epidote, chlorite and actinolite, together with minor sericite (Fig. 4a, b). Many of the coarse garnet crystals are isotropic under cross-polarized light (Fig. 5a). The magnetite is typically subhedral to anhedral, and locally occurs as pseudomorphs after garnet (Fig. 5b). The oxide stage II is characterized by hematite, specularite and quartz (Figs 4d, e, 5c). The hematite–quartz veins cut across the epidote alteration body (Fig. 4d), and the massive specularite is cut by late carbonate–fluorite veins (Fig. 4e). The early sulphide stage III is characterized by arsenopyrite, pyrite, carbonate and quartz, as well as minor fluorite, and these minerals commonly occur as disseminations, patches or veins that cross-cut the early skarn (Figs 4f, 5d). The late sulphide stage IV (Pb–Zn mineralization) is represented mainly by galena and sphalerite as well as minor chalcopyrite and pyrite in either massive, disseminated, vein or banded structures (Figs 4c, g–i, 5e–g). Gangue minerals of the stage include chlorite, quartz, calcite and minor sericite (Figs 4h, i, 5h, i). Sulphides often replace the skarn minerals (e.g. garnet and epidote), occur as interstitial fillings or cross-cut them as veins (Figs 4a–c, 5h, i). The stage V quartz–calcite veins are sulphide poor and cut or crush the earlier stages (Fig. 4i). The prograde and retrograde mineral assemblages in this deposit resemble those of a typical skarn system (e.g. Li et al. Reference Li, Wang, Lu, Zhang, Quan, Wang and Wei2015 c; Mei et al. Reference Mei, Lü, Cao, Liu, Zhao, Ai, Tang and Abfaua2015; Zhu et al. Reference Zhu, Hu, Righards, Bi and Zhong2015; Peng et al. Reference Peng, Mao, Hou, Shu, Zhang, Liu and Zhou2016; Zhong et al. Reference Zhong, Feng, Seltmann, Dolgopolova, Andersen, Li and Yu2018), and early skarn minerals were replaced by later (massive, disseminated and vein) sulphides. Furthermore, the common occurrence of fluorite indicates high-F activities in alteration assemblages, which represents the magmatic hydrothermal transition in the ore-forming processes.

Fig. 4. Photographs of hand specimens showing the nature of the Bagenheigeqier Pb–Zn deposit. (a) Disseminated lead–zinc ore with garnet precursor. (b) Mineral assemblage of magnetite, epidote and chlorite overprinted by sphalerite and galena. (c) Skarn cut by veinlet with disseminated pyrite, sphalerite, galena and calcite. (d) Hematite–quartz vein cross-cutting epidotized rocks. (e) Massive specularite ore cut by a calcite–fluorite vein. (f) Arsenopyrite–pyrite–quartz vein. (g) Massive lead–zinc ore. (h) Sphalerite–galena–pyrite–quartz vein cut by a pyrite–quartz vein. (i) Post-ore calcite veins create the appearance of brecciation and cement the syn-ore minerals. Apy – arsenopyrite; Cal – calcite; Chl – chlorite; Ep – epidote; Fl – fluorite; Gn – galena; Grt – garnet; Hem – hematite; Mgt – magnetite; Py – pyrite; Qtz – quartz; Sk – skarn; Sp – sphalerite; Spe – specularite.

Fig. 5. Photomicrographs of Pb–Zn mineralization in the Bagenheigeqier deposit. (a) Euhedral zoned garnet replaced by chlorite and epidote. (b) Arsenopyrite overprinting magnetite. (c) Acicular specularite. (d) Intergrowth of arsenopyrite and pyrite. (e) Intergrowth of galena and sphalerite replacing magnetite. (f) Intergrowth of galena and pyrite with garnet precursor. (g) Sphalerite intergrowth with galena and tiny chalcopyrite inclusions in sphalerite. (h) Chlorite and carbonate in association with galena in the Pb–Zn ore. (i) Sphalerite and quartz occurring as interstitial fillings among garnet or replacing garnet in skarn. Ccp – chalcopyrite; other abbreviations as for Figure 4.

Fig. 6. Mineral paragenesis for the Bagenheigeqier Pb–Zn ore deposit.
5.b. Fluid inclusions
A total of 46 thick-sections were used for the petrographic study of the FIs, 20 of which were subjected to microthermometric analysis. Several minerals (garnet, epidote, quartz, calcite and sphalerite) were examined, but only the quartz from stages II–V contained fluid inclusions suitable for analysis. Our petrographic studies and microthermometric analyses focused on fluid inclusion assemblages (FIAs; Goldstein & Reynolds, Reference Goldstein and Reynolds1994).
5.b.1. Petrography and fluid inclusion types
On the basis of phases present at room temperature (25°C), we distinguished three types of FIs in the Bagenheigeqier ore district (Table 2; Fig. 7). Laser Raman spectra analysis shows that the main component of gas phase is H2O (Fig. 8). Type 1 FIs consist of two phases (V, vapour; L, liquid) at room temperature, with VH2O/(VH2O + LH2O) < 50 vol% (mainly 10–30 vol%). These inclusions generally have ellipsoidal, elongate or irregular shapes, and are 3–13 μm in size (Fig. 7a, e–k). They are commonly clustered as FIAs (Fig. 7i–k).
Table 2. Summary of microthermometric data and calculated parameters for fluid inclusions in quartz from the Bagenheigeqier Pb–Zn deposit. T m,ice – temperature of final ice melting; T hs – dissolution temperature of NaCl daughter mineral; T hv – homogenization temperature of vapour-rich and liquid-rich fluid inclusions or disappearing temperature of bubble for daughter-mineral-bearing three-phase fluid inclusions


Fig. 7. Photomicrographs of representative FIs in quartz from the Bagenheigeqier Pb–Zn deposit: (a) type 1 FIs; (b, c) type 2 FIs; (d) type 3 FIs; (e) type 1, 2 and 3 FIs in a quartz crystal from stage II; (f, g) type 1 and 3 FIs in quartz crystals from stage III; (h) type 1 and 2 FIs in a quartz crystal from stage IV; (i) type 1 FIA in quartz from stage IV; (j) sketch of a type 1 FIA and the total homogenization temperatures of these inclusions; and (k) oriented type 1 FIA in quartz from stage V.

Fig. 8. Raman spectra for NaCl–H2O FIs in the Bagenheigeqier Pb–Zn deposit.
Type 2 FIs consist of two phases (vapour and liquid water) at room temperature, with VH2O/(VH2O + LH2O) > 50 vol% (most 60–75 vol%) (Fig. 7b, c). These inclusions are round or oval in shape, generally 5–13 μm in size, and either occur in isolation or coexist with types 1 and 3 inclusions (Fig. 7e, f, h).
Type 3 FIs contain a vapour bubble, an aqueous liquid and one or two solid daughter minerals at room temperature. They exhibit ellipsoidal, irregular or negative crystal shapes, and are typically 8–12 μm in diameter (Fig. 7d–f). The solid daughter minerals are mainly transparent but occasionally opaque. The transparent daughter minerals are pale white, have angular cube shapes and were identified as halite (Fig. 7d–f).
5.b.2. Microthermometry and salinity
Microthermometric measurements were obtained for four stages of the mineralization, and in most cases the measurements were done on FIAs. The results are presented in Table 2 and Figure 9, which show the association between mineral assemblages, physicochemical conditions and ore genesis. The total salinities of the fluids (expressed as wt% NaCl eq) were calculated on the basis of the melting temperatures of ice (T m,ice) in type 1 and 2 FIs, and halite dissolution temperatures in type 3 FIs in the NaCl–H2O system (Hall et al. Reference Hall, Sterner and Bodnar1988).
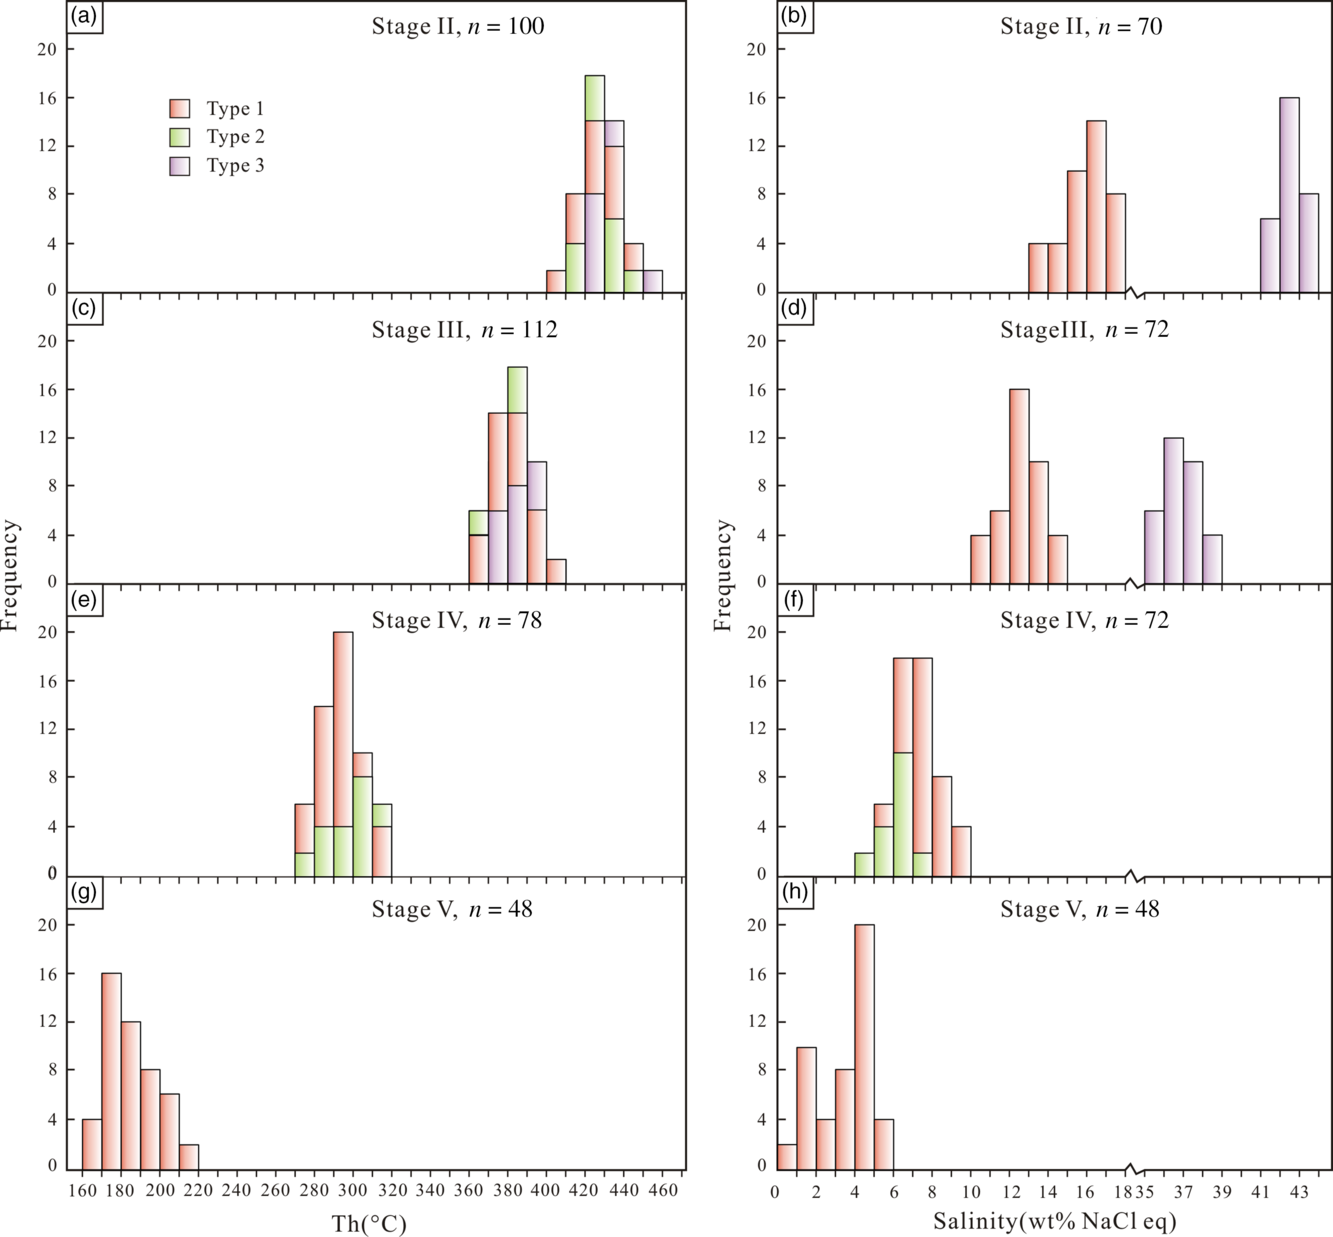
Fig. 9. Histograms of homogenization temperatures and salinities of FIs in stage (a, b) II, (c, d) III, (e, f) IV and (g, h) V quartz from the Bagenheigeqier Pb–Zn deposit.
Type 1, 2 and 3 FIs were identified in quartz crystals of the oxide stage II (Table 2). The type 1 FIs yielded T m,ice values of –13.9 to –9.2°C and salinities of 13.1–17.8 wt% NaCl eq, and they homogenized to a liquid phase at temperatures (T hv) of 402–449°C (Fig. 9a,b). The type 2 FIs homogenized into a vapour phase at temperatures varying from 415 to 446°C (Fig. 9a). The salinities could not be determined precisely, as a result of the difficulty in observing the final disappearance of ice. For the type 3 FIs, the halite daughter minerals usually dissolved at temperatures (T hs) ranging from 337 to 365°C before the vapour bubble disappeared, and their salinities were estimated to be 41.2–43.8 wt% NaCl eq (Fig. 9a, b).
Type 1, 2 and 3 FIs were identified in quartz crystals of the early sulphide stage III (Table 2). The type 1 FIs yielded T m,ice values of –10.6 to –6.9°C and salinities of 10.4–14.6 wt% NaCl eq, and they homogenized to a liquid phase at temperatures (T hv) of 365–408°C (Fig. 9c, d). The type 2 FIs homogenized into a vapour phase at temperatures varying from 360 to 394°C (Fig. 9c). They yielded T m,ice values of –2.1 to –0.5°C and calculated salinities of 0.9–3.5 wt% NaCl eq. The type 3 FIs generally homogenized before the disappearance of the vapour, and they completely homogenized at temperatures of 361–404°C. The halite daughter minerals dissolved at temperatures (T hs) of 262–309°C, corresponding to salinities of 35.5–38.9 wt% NaCl eq (Fig. 9c, d).
Type 1 and 2 FIs were identified in quartz crystals of the late sulphide stage IV (Table 2). The T m,ice values for the type 1 FIAs ranged from –6.6 to –3.1°C, and the calculated salinities were 5.1–10.0 wt% NaCl eq (Fig. 9f). The FIAs homogenized to a liquid phase at temperatures of 274–317°C (Fig. 9e). The type 2 FIs yielded T m,ice values of –4.9 to –2.5°C and calculated salinities of 4.2–7.7 wt% NaCl eq, and they homogenized into a vapour phase at temperatures (T hv) of 275–319°C (Fig. 9e, f).
Only type 1 FIs were identified in the quartz crystals of the quartz–calcite stage V (Table 2). The FIAs yielded T m,ice values of –3.4 to –0.5°C and calculated salinities of 0.9–5.5 wt% NaCl eq, and they homogenized to a liquid phase at temperatures (T hv) of 167–212°C (Fig. 9g, h).
5.c. Hydrogen and oxygen isotopic analysis
The oxygen and hydrogen isotopic data are listed in Table 3 and plotted in Figure 10, which include the results of this study (n = 14) and those of earlier work (n = 6; Wang, Reference Wang2010). The measured δ18O values are –2.9 to +12.8‰. The oxygen isotopic composition of ore-forming fluids can be calculated from the oxygen isotopic compositions of quartz. This calculation uses the quartz–water fractionation equations (δ18OH2O = δ18Oquartz–water − 3.38 × (106 × T–2) + 3.40; Clayton et al. Reference Clayton, O’Neil and Mayeda1972), together with the average homogenization temperatures calculated from the FIs data (Table 2). The resulting δ18OH2O values of the ore-forming fluids are −12.4 to +9.3‰, and the hydrogen isotopic compositions are −156.5 to −99.1‰ for Pb–Zn mineralization.
Table 3. Hydrogen and oxygen isotope compositions of fluid inclusions in the Bagenheigeqier Pb–Zn deposit
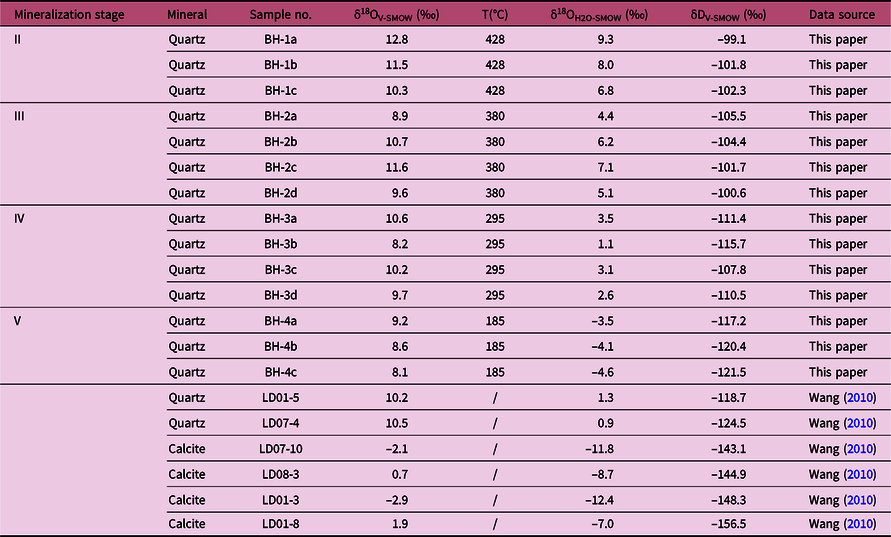
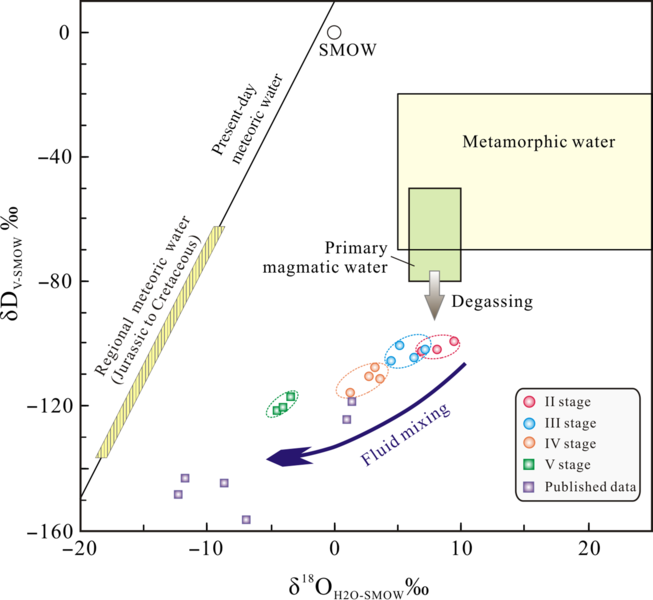
Fig. 10. Plot of δD versus δ18O for ore-forming fluids of the Bagenheigeqier Pb–Zn deposit. Published data are from Wang (Reference Wang2010). Isotopic compositions of magmatic and metamorphic waters after Taylor (1974), present-day meteoric water in China after Zheng & Chen (Reference Zheng and Chen2000), regional meteoric water (Jurassic–Cretaceous) after Shelton et al. (Reference Shelton, So and Chang1988, Reference Shelton, So, Haeussler, Chi and Lee1990). SMOW – Standard Mean Ocean Water.
5.d. Sulphur and lead isotope analysis
The sulphur isotopic results are given in Table 4 and Figure 11. The δ34S values of 23 sulphide samples from this study (n = 12) and earlier work (n = 11) show a small range of variation and are all positive values, with a range of 1.4–5.5‰, average 4.1‰. In detail, the δ34S values range over 2.7–5.1‰ for galena (mean, 4.0‰), 3.1–5.5‰ for sphalerite (mean, 4.5‰), 1.4–4.8‰ for pyrite (mean, 3.9‰) and 3.8–5.0‰ for arsenopyrite (mean, 4.2‰).
Table 4. Sulphur isotope compositions of sulphide minerals from the Bagenheigeqier Pb–Zn deposit. Abbreviations as in Figures 4 and 5


Fig. 11. (a) Histogram of sulphur isotope data in the Bagenheigeqier Pb–Zn deposit and (b) sulphur isotopic compositions of sulphide ores from some hydrothermal deposits in the SGXR. Abbreviations: SGXR – Southern Great Xing’an Range. Green domain indicates the range of magmatic sulphur (Chaussidon & Lorand, Reference Chaussidon and Lorand1990). Data are from Chu & Liu (Reference Chu and Liu1999), Shen & Fu (Reference Shen and Fu1999), Wang et al. (Reference Wang, Wang, Wang and Uemoto2001), Liu et al. (Reference Liu, Li and Tan2003, Reference Liu, Han, Wang, Li, Li, Cai and Fu2018), Zhu et al. (Reference Zhu, Zhang, He, Zhu and Huang2006), Nie et al. (Reference Nie, Jiang, Zhang, Bai, Hu, Zhao, Zhang and Liu2007), Zhang et al. (Reference Zhang, Nie, Liu, Jiang, Xu, Hu, Lai and Pi2007 a, b), Xiao et al. (Reference Xiao, Wang, Zhang, Li, Wang, Liu and Hu2008), Qi (Reference Qi2009), Jiang et al. (Reference Jiang, Nie, Liu and Yun2010, Reference Jiang, Zhu, Huang, Xu and Zhang2017), Wang (Reference Wang2010), Zhou et al. (Reference Zhou, Wang and Li2011), Wu et al. (Reference Wu, Mao, Zhou and Ouyang2012), Ouyang et al. (2013a, b), BUST (2015), Li et al. (Reference Li, Wang, Lu, Zhang, Quan, Wang and Wei2015 c, 2016a), Lv (Reference Lv2015), Mei et al. (Reference Mei, Lü, Cao, Liu, Zhao, Ai, Tang and Abfaua2015), He (Reference He2016), Ke et al. (Reference Ke, Zhang, Liu, Zhai, Guo, Yang, Tan, Xu, Zhang and Wang2017) and Zhai et al. (Reference Zhai, Liu, Zhang and Sun2017, Reference Zhai, Liu, Cook, Wang, Yang, Zhang and Jiao2019).
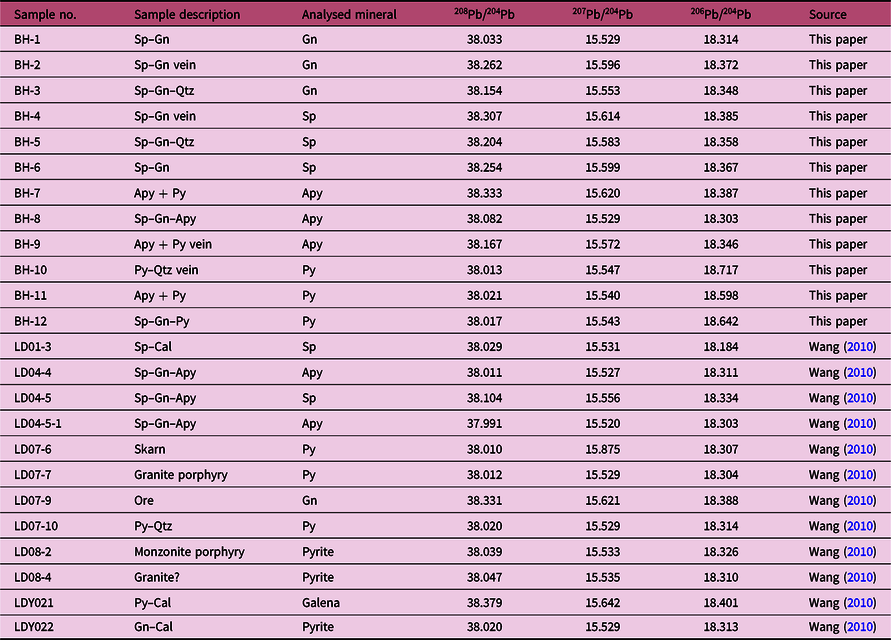
The Pb isotopic compositions of 24 sulphide samples (arsenopyrite, pyrite, sphalerite and galena) obtained from this study (n = 12) and previous studies (n = 12; Wang, Reference Wang2010) are listed in Table 5 and plotted in Figure 12. The isotopic compositions of the ore lead samples from the Bagenheigeqier deposit are characterized by a limited variation in 206Pb/204Pb, 207Pb/204Pb and 208Pb/204Pb, ranging over 18.184–18.717 (mean, 18.361), 15.520–15.875 (mean, 15.574) and 37.991–38.379 (mean, 38.112), respectively, and exhibit clear linear correlations (Fig. 12).
Table 5. Lead isotope data for the Bagenheigeqier Pb–Zn deposit. Abbreviations as in Figures 4 and 5


Fig. 12. Lead isotopic compositions of sulphides and wall rocks in the Bagenheigeqier Pb–Zn deposit: (a) 207Pb/204Pb v. 206Pb/204Pb and (b) 208Pb/204Pb v. 206Pb/204Pb. The average growth lines are from Zartman & Doe (Reference Zartman and Doe1981). Data are from Shen & Fu (Reference Shen and Fu1999), Chu et al. (Reference Chu, Huo and Zhang2002), Zhang et al. (Reference Zhang, Qiu, Zhan, Shao and Liu2002, Reference Zhang, Nie, Liu, Jiang, Xu, Hu, Lai and Pi2007a , b), Nie et al. (Reference Nie, Jiang, Zhang, Bai, Hu, Zhao, Zhang and Liu2007), Jiang et al. (Reference Jiang, Nie, Liu and Yun2010, Reference Jiang, Zhu, Huang, Xu and Zhang2017), Wang (Reference Wang2010), Wu et al. (Reference Wu, Mao, Zhou and Ouyang2012), Yao et al. (Reference Yao, Liu, Zhai, Wang and Xing2012), Ouyang et al. (2013a, b), Lv (Reference Lv2015), Mei et al. (Reference Mei, Lü, Cao, Liu, Zhao, Ai, Tang and Abfaua2015), He (Reference He2016), Li et al. (Reference Li, Yang, He, Wang, Niu, Hua and Xie2016 a), Jiang et al. (Reference Jiang, Zhu, Huang, Xu and Zhang2017), Ke et al. (Reference Ke, Zhang, Liu, Zhai, Guo, Yang, Tan, Xu, Zhang and Wang2017) and Zhai et al. (Reference Zhai, Liu, Cook, Wang, Yang, Zhang and Jiao2019).
5.e. Pyrite Re–Os dating
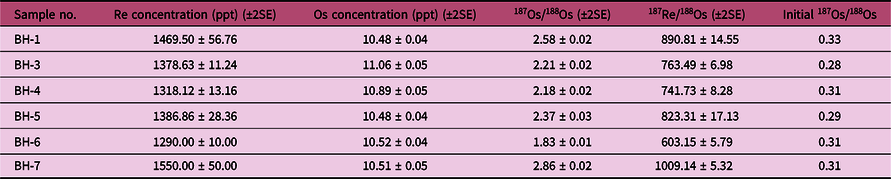
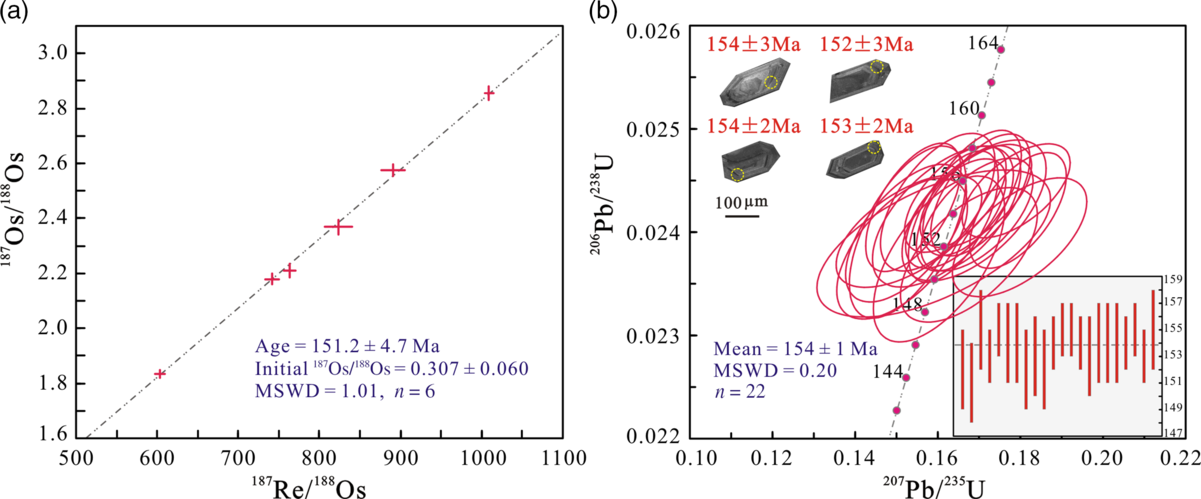
The Re–Os concentrations and isotope data for pyrite from the late sulphide stage IV are reported in Table 6 and Figure 13a. Six pyrite samples contain 1290–1550 ppt Re and 10.48–11.06 ppt common Os, with 187Os/188Os ratios of 1.83–2.86 and 187Re/188Os ratios of 603.15–1009.14. These samples yield a well-constrained isochron age of 151.2 ± 4.7 Ma (mean square weighted deviation (MSWD), 1.01; Fig. 13a) and an initial 187Os/188Os ratio of 0.307 ± 0.06.
Table 6. Re–Os dating results for pyrites from the Bagenheigeqier Pb–Zn deposit. SE – standard error


Fig. 13. (a) Pyrite Re–Os isochron plots and (b) zircon U–Pb concordia diagram for the granite porphyry from the Bagenheigeqier Pb–Zn deposit.
5.f. Zircon U–Pb dating
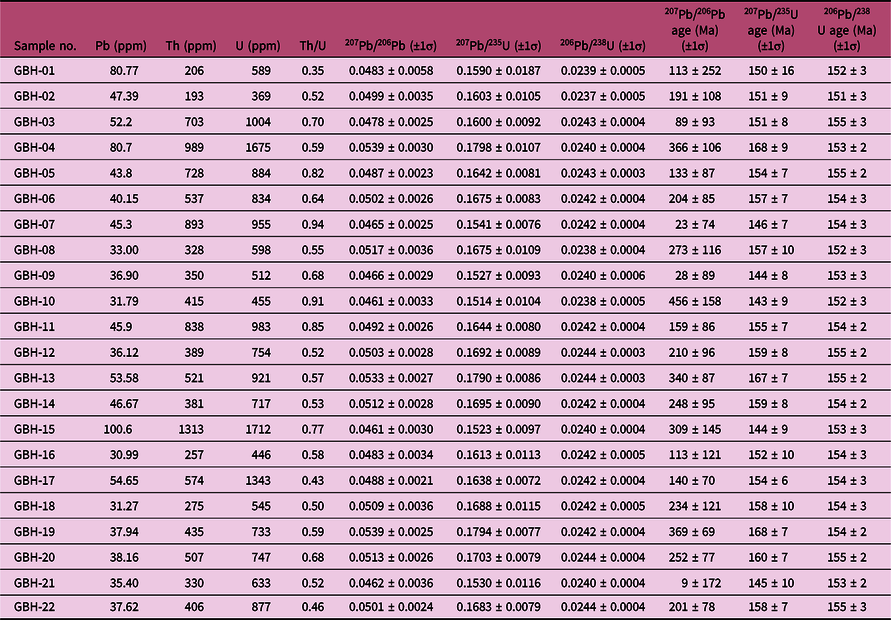
The granite porphyry sample was collected from the Bagenheigeqier ore district for zircon U–Pb dating by laser ablation (LA-) ICP-MS. The CL images of representative zircons are shown in Figure 13b and the U–Pb data are listed in Table 7 and plotted in Figure 13b. Zircons from the sample are euhedral–subhedral, 80–220 μm long and have length:width ratios of 1:1 to 3:1. Most zircons display fine-scale oscillatory growth zoning in CL images and have Th/U ratios of 0.35–0.93. Taken together, these features indicate that the zircons are of igneous origin (Koschek, Reference Koschek1993; Hoskin & Black, Reference Hoskin and Black2000). For the granite porphyry sample, 22 analyses yielded 206Pb/238U ages between 151 and 155 Ma (Table 7), with a weighted mean 206Pb/238U age of 154 ± 1 Ma (MSWD, 0.20; n = 22; Fig. 13b), which is interpreted to represent the crystallization age of the granite porphyry.
Table 7. LA-ICP-MS U–Pb dating data of zircons from the granite porphyry in the Bagenheigeqier Pb–Zn deposit
6. Discussion
6.a. Timing of magmatism and mineralization
Although Re–Os dating of galena and sphalerite can provide a direct age of mineralization for a Pb–Zn deposit, the results for most deposits are unreliable because the Re–Os isotope system in these two minerals exhibits open behavior involving Re gain and/or Os loss (Morelli et al. Reference Morelli, Creaser, Selby, Kelley, Leach and King2004; Spry et al. Reference Spry, Mathur, Bonsall, Voudouris and Melfos2014). On the other hand, the Re–Os isotope system of pyrite has proven to be a more reliable tool because the pyrite contains relatively high amounts of Re (Morelli et al. Reference Morelli, Creaser, Selby, Kelley, Leach and King2004; Selby et al. Reference Selby, Kelley, Hitzman and Zieg2009; Huang et al. Reference Huang, Zhou, Qi, Gao and Wang2013), and the system is relatively insensitive to later hydrothermal, metamorphic and tectonic events (e.g. Stein et al. Reference Stein, Sundblad, Markey, Morgan and Motuza1998; Bingen & Stein, Reference Bingen and Stein2003). Nevertheless, to obtain geologically meaningful ages, the occurrence and the paragenetic sequence of the pyrite must be clearly understood. The pyrite sampled for our Re–Os isotope analyses is closely associated with the Pb–Zn mineralization and formed simultaneously with the galena and sphalerite (Fig. 4n–p). Moreover, the homogenization temperatures of FIs (274–319°C) of the Pb–Zn mineralization stage are lower than the Re–Os closure temperature for pyrite, which is estimated to exceed 500°C (Brenan et al. Reference Brenan, Cherniak and Rose2000; Nozaki et al. Reference Nozaki, Kato and Suzuki2010). The pyrite yielded a Re–Os isochron age of 151.2 ± 4.7 Ma (Fig. 13a), which we interpret to represent the age of the Pb–Zn mineralization. We therefore suggest that the Bagenheigeqier deposit formed during Late Jurassic time. Our LA-ICP-MS U–Pb isotopic dating of zircons from the granite porphyry below the Pb–Zn orebodies gave a weighted mean 206Pb/238U age of 154 ± 1 Ma. This age is similar to that of the Pb–Zn mineralization. We therefore propose that the granite porphyry was closely related genetically to the Pb–Zn mineralization. Furthermore, a Late Jurassic (156–146 Ma) age is consistent with the period of extensive magmatism and mineralization associated with the closure of the Mongol–Okhotsk Ocean (Xu et al. Reference Xu, Wang, Pei, Meng, Tang, Xu and Wang2013).
6.b. Nature, evolution and sources of the ore-forming fluids
6.b.1. Trapping pressures and depth estimations
Estimates of the trapping pressure can be made only if the actual trapping temperature is known, or if fluid boiling (immiscibility) was occurring in the system at the time of entrapment (Roedder & Bodnar, Reference Roedder and Bodnar1980; Brown & Hagemann, Reference Brown and Hagemann1995). The coexistence of the type 1, 2 and 3 FIs with similar homogenization temperatures (Fig. 9a, c) indicates that the fluid boiling event occurred during the oxide and early sulphide stages (II and III) (Fig. 14a). For the Pb–Zn mineralization stage IV, the type 1 FIAs are spatially associated with type 2 FIs, and they homogenized at similar temperatures (Fig. 9e); this also indicates that they were trapped during fluid boiling (Fig. 14a). Lack of evidence for boiling in the quartz–calcite stage V means that only minimum trapping temperatures and pressures can be estimated for the late fluids.
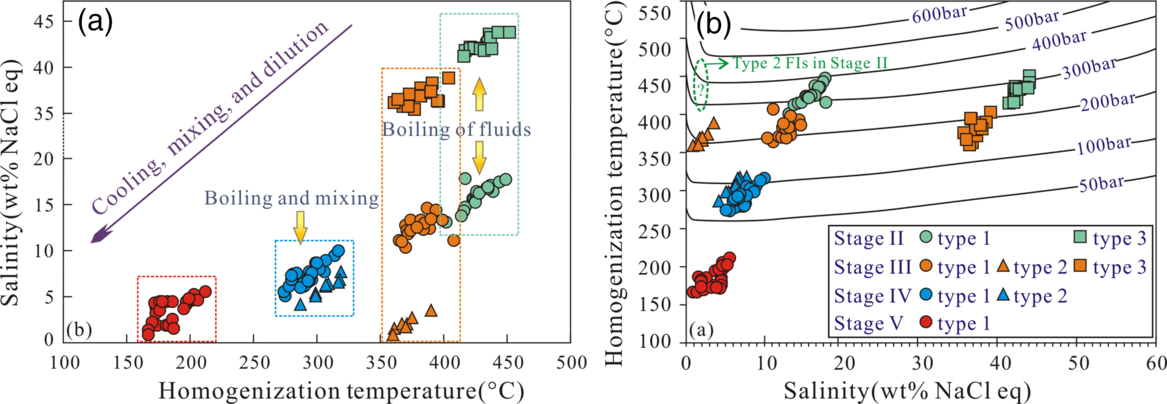
Fig. 14. Summary plot of the homogenization temperatures and salinities of Fls at different stages of the Bagenheigeqier Pb–Zn deposit. (a) Fluid salinity–temperature evolution of the Pb–Zn mineralization. The left-downwards trend represents the mixing of primitive fluid A with cold and low-salinity fluid B (Shepherd et al. Reference Shepherd, Rankin and Alderton1985). (b) Type 1, 2 and 3 FIs in stages II, III and IV were trapped under boiling conditions, so the estimated pressures represent the actual trapping pressures for these inclusions. No boiling assemblages occurred in mineralization stage V, so the minimum trapping pressures of the Fls can be estimated. Isobars were calculated using the equations of Driesner & Heinrich (Reference Driesner and Heinrich2007). Note that the salinities for stage II type 2 FIs are inferred.
Given that boiling assemblages were present in the hydrothermal system, the homogenization temperatures can be taken as closely approximating the trapping temperatures (Roedder & Bodnar, Reference Roedder and Bodnar1980). Based on a simple NaCl–H2O system, we estimated the trapping pressures in the pre-ore stages II and III to be 132–370 bar, with an average of 236 bar (Fig. 13b; Driesner & Heinrich, Reference Driesner and Heinrich2007; Steele-MacInnis et al. Reference Steele-MacInnis, Lecumberri-Sanchez and Bodnar2012). These trapping pressures are equivalent to formation depths of c. 0.49–1.37 km, assuming a lithostatic pressure (rock density of 2.7 g cm–3), or c. 1.32–3.70 km if we assume a hydrostatic pressure. For the syn-ore stage IV FIAs, the trapping pressures were estimated to range from 56 to 106 bar (Fig. 14b; Driesner & Heinrich, Reference Driesner and Heinrich2007; Steele-MacInnis et al. Reference Steele-MacInnis, Lecumberri-Sanchez and Bodnar2012), equivalent to depths of c. 0.56–1.06 km, assuming hydrostatic conditions. The single type 1 FIAs occurred in the post-ore stage V, and the trapping pressures are mostly < 50 bar (Fig. 14b; Driesner & Heinrich, Reference Driesner and Heinrich2007), representing their minimum trapping pressures (Roedder & Bodnar, Reference Roedder and Bodnar1980).
6.b.2. Sources and evolution of the ore-forming fluids
Although the hydrogen and oxygen isotope compositions of stage I were not determined, the source of the ore-forming fluids is likely to be magmatic during the early stages of skarn formation (Meinert et al. Reference Meinert, Hedenquist and Satoh2003, Reference Meinert, Dippl and Nicolescu2005; Peter et al. Reference Peter, Lexa and Fallick2010). A large number of studies have proven that the primary ore-forming fluids of the skarn deposits originated from magmatic water (e.g. Palinkas et al. Reference Palinkas, Palinkas, Renac, Spangenberg, Luders, Molnar and Maliqi2013; Lv, Reference Lv2015; Mei et al. Reference Mei, Lü, Cao, Liu, Zhao, Ai, Tang and Abfaua2015; Peng et al. Reference Peng, Mao, Hou, Shu, Zhang, Liu and Zhou2016; Zhong et al. Reference Zhong, Feng, Seltmann, Dolgopolova, Andersen, Li and Yu2018). Moreover, there is no obvious regional metamorphism in Bagenheigeqier. The δ18OH2O values in three quartz samples from oxide stage II vary from 6.8‰ to 9.3‰, exhibiting a typical magmatic signature (Table 3; Taylor, 1974). The hydrogen isotope compositions show a low δD value (–102.3‰ to –99.1‰), which might be due to isotope exchange during water–rock interactions and/or magma degassing (Rye, Reference Rye1993; Harris & Golding, Reference Harris and Golding2002). Interactions of the fluids with the wall rocks cannot account for such a large variation in δD values when the δ18O values remain constant, except possibly for unreasonably low water-to-rock ratios (i.e. ratios < 0.01), which would only have been possible during the very earliest stage of alteration (Bowman, Reference Bowman1998). Rayleigh fractionation degassing can lead to large δD depletions (up to 80%) in residual magmatic water, but such degassing only produces slight changes in δ18O values (Taylor, Reference Taylor1986; Shmulovich et al. Reference Shmulovich, Landwehr, Simon and Heinrich1999). The δD and δ18O values of degassed magmatic water at Bagenheigeqier therefore display a linear trend from the primary magmatic water field to the field below (Fig. 10).
The possible mechanisms for the boiling of hydrothermal fluids during the oxide stage II (Fig. 14a) include sudden decompression as a result of rock fracturing, the mixing of ore-forming fluids with other fluids of markedly different composition, or a combination of these mechanisms (Lu et al. Reference Lu, Fan, Ni, Ou, Shen and Zhang2004). There are no syn-ore fractures in the ore district, so the mechanism of sudden decompression was not considered. Furthermore, the fluids exhibit typical magmatic signatures (Taylor, 1974), which suggests that the contribution of meteoric water was limited during stage II. The decrease in δD values in stage II resulted from Raleigh fractionation during the progressive loss of the vapour phase as the boiling fluids ascended towards the surface (Driesner & Seward, Reference Driesner and Seward2000). The coexisting low-salinity vapours (type 2) and the moderate- and high-salinity liquids (types 1 and 3) reflect the boiling of a supercritical fluid (Fig. 14a). The late exsolved fluid would have cooled rapidly, and the fluid temperatures and salinities would have fallen rapidly, resulting in the fluid boiling (Shinohara & Hedenquist, Reference Shinohara and Hedenquist1997). This series of events resulted in the precipitation of oxides such as magnetite, hematite and specularite.
The quartz from the stage IV Pb–Zn mineralization contains coexisting type 1 FIAs and type 2 FIs (Fig. 7h, i). Some of these FIs homogenized to a liquid and some to vapour at similar temperatures during heating, reflecting the characteristics of typical boiling FIAs (Lu et al. Reference Lu, Fan, Ni, Ou, Shen and Zhang2004). The δD and δ18O values of the stage IV fluids range from –117.2‰ to –107.8‰ and from 1.1‰ to 3.5‰, respectively, and these values fall between the fields of meteoric and magmatic water on the δD–δ18O diagram (Fig. 10). This indicates significant mixing of meteoric water with the higher-temperature hydrothermal fluids during the syn-ore stage. Moreover, the trapping temperatures (274–319°C) of the stage IV fluids show a discontinuous and sudden reduction when compared with those (360–452°C) for stages II and III. Taking all these observations into account, we conclude that the evolution of the ore-forming fluids from stages III to V involved significant additions of meteoric water to the fluid system, leading to sudden decreases in the fluid temperatures and salinities, and resulting in the precipitation of ore minerals such as galena and sphalerite.
The δ18O (–4.6 to –3.5‰) and δD (–121.5 to –117.2‰) isotope compositions of the fluids in the quartz–carbonate veins of stage V are extremely depleted (Table 3, Fig. 10), implying a significant involvement of meteoric water in the fluid system. In addition, we observed that the stage V FIs only contain type 1 FIAs (Fig. 7k), characterized by low temperatures (167–212°C) and salinities (0.9–5.5 wt% NaCl eq) (Fig. 9g, h). With the continued decrease in temperature and pressure of the fluid system, quartz, fluorite and carbonates were precipitated from the fluids. In summary, we propose that the ore-forming fluids in the Bagenheigeqier deposit were primarily of magmatic origin, but were mixed with meteoric water as mineralization progressed to stages IV and V.
6.c. Sources of the ore-forming materials
Although the δ34S values of individual sulphides do not indicate their source, the δ34S value of total S in the fluids might be diagnostic of the source (Ohmoto, Reference Ohmoto1972). The mineral assemblage of the Pb–Zn mineralization comprises metallic sulphides, but there are no sulphates; this indicates that the ore-forming fluids had relatively low oxygen fugacities when the minerals were precipitated (Ohmoto & Rye, Reference Ohmoto, Rye and Barnes1979; Ohmoto & Goldhaber, Reference Ohmoto, Goldhaber and Barnes1997). This means that the values of δ34S represent the sulphur isotope compositions of the ore-forming fluids (i.e. δ34SΣS = δ34Ssulphide; Ohmoto, Reference Ohmoto1972). The δ34S values of sulphides in the Bagenheigeqier deposit vary from 1.4‰ to 5.5‰ (mean, 4.1‰; n = 23), which is similar to but more positive than the δ34S values of sulphides related to deep magmatism (–3‰ to +3‰; Chaussidon & Lorand, Reference Chaussidon and Lorand1990). The Bagenheigeqier isotope data do not cluster in a concentrated range (Fig. 11a), possibly indicating the incorporation of sulphur from a more 34S-enriched source than magma. This characteristic has been noted in many skarn deposits (e.g. Ishihara et al. Reference Ishihara, Kajiwara and Jin2002; Peng et al. Reference Peng, Mao, Hou, Shu, Zhang, Liu and Zhou2016; Zhang et al. Reference Zhang, Shao, Wu and Chen2017 c), where it has generally been accounted for by the mixing of magmatic sulphur with sulphur from sedimentary or volcanic rocks (Ripley, Reference Ripley1981; Pearson et al. Reference Pearson, Clark, Porter and Gonzalez1988). This explanation might be valid for the Bagenheigeqier deposit because the average contents of lead and zinc in the host Baiyin’gaolao Formation are 9.5 and 11.4 times the Clark value, respectively (Li, 2015). The wide range of δ34S values in the Bagenheigeqier deposit is therefore best attributed to contributions from both the granite porphyry (deep magma) and the volcanic rocks of the Baiyin’gaolao Formation (shallow crust). The sulphur isotope compositions of sulphides in the Bagenheigeqier deposit are also similar to those in other hydrothermal ore deposits in the SGXR (e.g. Hua’naote Pb–Zn–Ag, Aerhada Pb–Zn–Ag, Hashitu Mo, Dajing Cu–Sn–Pb–Zn, Meng’entaolegai Pb–Zn–Ag–In, Lianhuashan Cu–Ag and Naojiushan Cu deposits; Fig. 11).
Lead isotope data for the sulphides in the Bagenheigeqier deposit exhibit a linear trend within the region between the mantle and upper crust evolution curves (Fig. 12; Zartman & Doe, Reference Zartman and Doe1981), implying that the lead in this deposit was derived from a mixture of mantle and crustal sources (Pass et al. Reference Pass, Cooke, Davidson, Maas, Dipple, Rees, Ferreira, Taylor and Deyell2014). We compiled lead isotope data for other Mesozoic hydrothermal deposits and Mesozoic intrusive rocks in the SGXR (Fig. 12), and these data also show a linear trend although with a wider distribution than for the Bagenheigeqier (Fig. 12). The data indicate a similar source for the lead in all of these deposits, and that the lead isotope compositions in the SGXR are characterized by crustal and mantle sources.
The initial Os isotope ratio in pyrite is an important parameter when evaluating the relative contributions of crust and mantle in the formation of an ore deposit (Ruiz & Mathur, Reference Ruiz, Mathur, Lambert and Ruiz1999). The elevated 187Os/188Os ratios of the crust (c. 1.0–1.3) compared with the mantle (c. 0.11–0.15) can be used to discern between these two sources (Walker et al. Reference Walker, Morgan, Naldrett, Li and Fassett1991; Meisel et al. Reference Meisel, Walker, Irving and Lorand2001). The initial 187Os/188Os ratio from the isochron for the Bagenheigeqier pyrite is 0.307 ± 0.06 (Fig. 13a), and this is slightly more radiogenic than the chondritic 187Os/188Os mean ratio of 0.13 at 151 Ma. This indicates that the Os of the pyrite was derived from a mixed crust–mantle source.
If we take into account the sulphur and lead isotopic composition of sulphides and the initial 187Os/188Os ratio of the syn-ore pyrite, the ore-forming materials had a mixed crust–mantle source and possibly originated partly from the granite porphyry and partly from the Baiyin’gaolao Formation.
6.d. Ore genesis
There is considerable evidence for a skarn-type mineralization in the Bagenheigeqier deposit, including the following. (1) The fluid homogenization temperatures in the oxide stage reached 452°C and the temperatures during the later Pb–Zn mineralization ranged from 274 to 319°C, which is significantly different from regional medium- to low-temperature hydrothermal vein-type Pb–Zn deposits (e.g. Zhang et al. Reference Zhang, Wang, Fu, Zhang, Konare, Peng and Cai2017 b; Liu et al. Reference Liu, Han, Wang, Li, Li, Cai and Fu2018; Li et al. Reference Li, Cai, Fu, Zhang, Wang, Ma and Sun2020 a). (2) The ore-forming fluids of the Bagenheigeqier deposit originated from a mix of magmatic and meteoric water, which is consistent with the pioneering study of Taylor & O’Neil (Reference Taylor and O’Neil1977) who demonstrated the importance of both magmatic and meteoric waters in the evolution of skarn. (3) Generally, a very narrow range of δ34S values in the sulphide minerals of a skarn deposit indicates a magmatic source of the sulphur (e.g. Shimazaki & Yamamoto, Reference Shimazaki and Yamamoto1979, Reference Shimazaki and Yamamoto1983; Shimazaki & Sakai, Reference Shimazaki and Sakai1984). However, in some more distal Pb–Zn skarns, some of the sulphur in the ore-forming fluids was acquired from wall rocks along the path of fluid flow (Megaw et al. Reference Megaw, Ruiz and Titley1988). These two possible sources describe very well the origin of the sulphur at Bagenheigeqier, which was sourced partly from the granite porphyry and partly from the Baiyin’gaolao Formation. For some skarn deposits, the ore-forming fluids presumably travelled some distance from their source to interact with suitable wall rocks (Ca-rich volcanic rocks and/or carbonates) (Meinert et al. Reference Meinert, Dippl and Nicolescu2005; Hou et al. Reference Hou, Zhang, Santosh, Encarnacion, Zhu and Luo2014), with the resulting orebody occurring some distance from the intrusion (e.g. Mengya’a Pb–Zn and Haobugao Fe–Zn deposits; Fu et al. Reference Fu, Zheng, Xu, Yang, Hou, Huang, Liu, Zhang and Zhao2017; Liu et al. Reference Liu, Jiang, Bagas, Han, Chen and Kang2017).
When the granite porphyry cooled and crystallized at c. 154 Ma, an initial supercritical fluid with a salinity of 6–8 wt% NaCl eq was exsolved from the parent magma chamber below the ore deposit (Burnham, Reference Burnham and Barnes1979; Yang & Bodnar, Reference Yang and Bodnar1994; Bodnar, Reference Bodnar1995), similar to skarn deposits elsewhere (Einaudi et al. Reference Einaudi, Meinert, Newberry and Skinner1981; Yun & Einaudi, Reference Yun and Einaudi1982; Meinert et al. Reference Meinert, Hedenquist and Satoh2003; Williams-Jones et al. Reference Williams-Jones, Samson, Ault, Gagnon and Fryer2010). As the fluid ascended to shallower depths, the magmatic fluid separated into a hypersaline liquid in equilibrium with a vapour (e.g. Meinert et al. Reference Meinert, Hefton, Mayes and Tasiran1997, Reference Meinert, Hedenquist and Satoh2003, Reference Meinert, Dippl and Nicolescu2005; Baker & Lang, Reference Baker and Lang2003; Chang & Meinert, Reference Chang and Meinert2008; Vallance et al. 2009; Shu et al. Reference Shu, Lai, Sun, Wang and Meng2013), and then infiltrated the wall rocks (the Baiyin’gaolao Formation) along faults or fissures where it leached mobile elements, including Mn2+, Fe2+, Pb2+, Zn2+ and Ag+ (Palinkas et al. Reference Palinkas, Palinkas, Renac, Spangenberg, Luders, Molnar and Maliqi2013).
An acidic fluid (such as the fluid with a pH of 3.9 in the Bismark skarn deposit; Bertelli et al. Reference Bertelli, Baker, Cleverley and Ulrich2009) would have separated from the evolving source magma and reacted with prograde skarn minerals such as garnet (Fig. 15a) under a high fluid/rock ratio during the retrograde period, as evidenced by the abundance of retrograde minerals in the Bagenheigeqier deposit (Figs 5, 15b; e.g. magnetite, hematite, specularite, epidote, quartz, calcite, chlorite and actinolite). Such reactions resulted in large amounts of magnetite and consumed hydrogen, forcing the pH to rise and consequently reducing the stability of Cl complexes (Bertelli et al. Reference Bertelli, Baker, Cleverley and Ulrich2009). With the addition of meteoric water to the Bagenheigeqier system, a large number of sulphides such as pyrite, arsenopyrite, sphalerite, galena and chalcopyrite (Fig. 4i–o) were precipitated, providing conclusive evidence of these reactions.
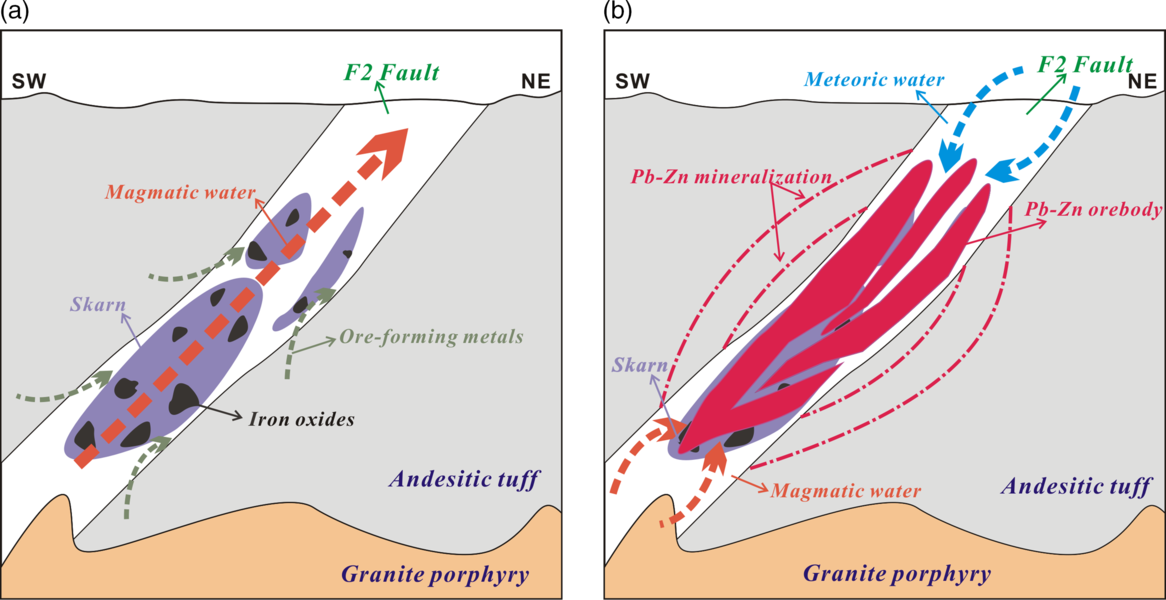
Fig. 15. Schematic diagrams depicting the formation of the Bagenheigeqier Pb–Zn deposit. (a) Formation of the skarn and iron oxides (magnetite, hematite, specularite, pyrite and arsenopyrite) during the pre-ore period. (b) The mixture of magmatic and meteoric water replaced skarn and iron oxides and then formed the Pb–Zn orebodies.
Various ore-forming mechanisms can be invoked to explain the origin of the Bagenheigeqier deposit. First, the pH of the ore-forming fluids would have increased by neutralization reactions (e.g. 4CaMgSi2O6 + Mg2+ + 2H+ = Ca2Mg5Si8O22(OH)2 + 2Ca2+), which would have reduced the solubility of Pb and Zn (Barnes & Gould, Reference Barnes and Gould1992). Second, temperatures decreased from 452–360°C (pre-ore stages II and III) to 319–274°C (main ore stage IV), with a sharp decrease in salinity from c. 43.8 to c. 10.0 wt% NaCl eq (Table 2), which can also reduce Pb and Zn solubility (Seward & Barnes, Reference Seward, Barnes and Barnes1997; Wood & Samson, Reference Wood, Samson, Richards and Larson1998). Third, fluid boiling as a result of the participation of meteoric water is an important mechanism for the precipitation of Pb and Zn (Reed & Spycher, Reference Reed and Spycher1985; Logan, Reference Logan1999; Yao et al. Reference Yao, Murphy and Robb2001; Calagari, Reference Calagari2004; Zhou et al. Reference Zhou, Yuan, Yue, Liu, Zhang and Fan2007). In addition, the degassing of the magma body and the opening of the ore-forming system favoured the release of sulphur. The increased sulphur fugacity could have reduced the metal-bearing capacity of the ore-forming fluids and enabled the formation of the sulphides. In summary, we propose that the concurrence of these processes could have readily initiated the deposition of ores in the Bagenheigeqier system.
7. Conclusions
Geological, fluid inclusion and multiple isotope investigations of the newly discovered Bagenheigeqier deposit provide compelling evidence that both ore-forming fluids and metals were genetically related to a felsic magma, which was the skarn ore-forming system during Late Jurassic time (pyrite Re–Os age of 151.2 ± 4.7 Ma and zircon 206Pb/238U age of 154 ± 1 Ma). Mineralization took place in five stages, namely the (I) skarn, (II) oxide, (III) early sulphide, (IV) late sulphide and (V) late quartz–calcite stages. A study of fluid inclusions shows that the homogenization temperatures and fluid salinities decreased from stages II to V. Temperatures of 274–319°C for the stage IV Pb–Zn mineralization were used to calculate trapping pressures of 50–106 bar, which correspond to depths of 0.56–1.06 km. The H and O isotope data suggest that the ore-forming fluids originated from magmatic water and meteoric water. The S and Pb isotope compositions consistently indicate the origin of ore-forming metals from the granite porphyry and partly from the host rocks of the Baiyin’gaolao Formation. This study provides a new case for the genesis of atypical Pb–Zn skarn deposits.
Acknowledgements
We thank Eimear Deady and an anonymous reviewer for their insightful comments, which greatly improved this manuscript. We thank Dr Kathryn Goodenough for her handling of the manuscript and editorial input. The project was funded by Self-determined Foundation of Key Laboratory of Mineral Resources Evaluation in Northeast Asia, Ministry of Land and Resources (grant no. DBY-ZZ-18-12).
Declaration of interest
None.