


INTRODUCTION
The Dardanelles is a very important water passage connecting the Aegean Sea and the Marmara Sea. It has two current systems. One of the currents is derived from the Aegean Sea, where the water density is high. The other comes from the Sea of Marmara, characteristically of low density. Aegean water is typically flowing from the south-west to north-east under the Marmara Sea water. Its north-east–south-west trend is interrupted by a north–south bend between Eceabat and Canakkale. In addition to the bend, there is a second bend ‘Nara Cape’. The width of the Strait varies from 1.35 to 7.73 km, the narrowest part located between Canakkale and Kilitbahir. The average depth of the Strait is approximately 60 m; the deepest part reaches more than 100 m (Unsal et al., Reference Unsal, Turkoglu and Yenici2003; Turkoglu et al., Reference Turkoglu, Unsal, Ismen, Mavili, Sever, Yenici, Kaya and Coker2004a, Reference Turkoglu, Baba and Ozcan2006; Baba et al., Reference Baba, Deniz, Turkoglu, Ozcan, Linkov, Gregory and Richard2007).
Emiliania huxleyi (Lohmann) Hay & Mohler is one of the most abundant coccolithophores occurring globally in all oceans, except polar ones. They drift freely and prefer the surface layer of the ocean. This species has received considerable attention since it tends to produce massive blooms under favourable conditions (Balch et al., Reference Balch, Holigan, Ackleson and Voss1991, Reference Balch, Holigan and Kilpatrick1992; Nanninga & Tyrrell, Reference Nanninga and Tyrrell1996; Hattori et al., Reference Hattori, Koike, Tachikawa, Saito and Nagasawa2004; Smyth et al., 2004). High surface irradiance, shallow stratification with a mixed layer depth of about 10–20 m, anomalies in salinity and temperature, low phosphate and silicate concentrations favour the bloom of this species (Egge & Heimdal, Reference Egge and Heimdal1994; Nanninga & Tyrrell, Reference Nanninga and Tyrrell1996; Smyth et al., Reference Smyth, Tyrrell and Tarrant2004; Zeichen & Robinson, Reference Zeichen and Robinson2004). During these blooms the numbers of E. huxleyi cells usually outnumber those of other species, frequently accounting for 80 or 90% or more of the total number of phytoplankton cells.
One significant problem of high concentrations or ‘blooms’ of E. huxleyi, is to alter ecological conditions of a region by acting as a source of organic sulphur (i.e. dimethyl sulphide) to the atmosphere (Balch et al., Reference Balch, Holigan and Kilpatrick1992; Burkill et al., Reference Burkill, Archer, Robinson, Nightingale, Groom, Tarran and Zubkov2002) and calcium carbonate to the sediments (Balch et al., Reference Balch, Kilpatrick, Holigan, Harbour and Fernandez1996; Tekiroglu et al., Reference Tekiroglu, Ediger, Yemenicioğlu, Kapur and Akça2001). Additionally, high cell concentrations can cause the water colour to change to a milky white or turquoise due to significant changes in the inherent optical properties of water (Brown & Yoder, Reference Brown and Yoder1994; Cokacar et al., Reference Cokacar, Kubilay and Oguz2001, Reference Cokacar, Oguz and Kubilay2004; Smyth et al., 2004). Therefore, documenting the occurrence of blooms in time and space is essential to characterize the biogeochemical environment of a target region.
Thus, the major aim of this study is to explain the bioecological effects of E. huxleyi blooms in the Dardanelles. This study focuses on the vertical distribution of the coccolithophore E. huxleyi and three dinoflagellates P. micans, C. furca var. furca and C. fusus var. seta against various environmental parameters. Furthermore, inorganic nutrients and chlorophyll-a were investigated in relation to the blooms and hydrography of the Dardanelles. According to previous similar studies, this study can be considered as unique since it contains information on the detailed discussions of the bloom of E. huxleyi in the Dardanelles and interactions of this species with other phytoplankton species in response to environmental parameters.
MATERIALS AND METHODS
The Dardanelles is located between the Aegean Sea and the Sea of Marmara, Canakkale, Turkey. The location of the sampling station (St; 40°09′ N 26°24′ E) is given in Figure 1. Water samples were collected using a Nansen sampling bottle for the analysis of nutrients, phytoplankton enumeration and chlorophyll-a from the following depths: 0.1, 0.5, 1.0, 2.5, 5.0, 7.5, 10, 25 and 50 m. Weekly samplings were conducted between 5 June and 11 July, 2003.

Fig. 1. Map of the Dardanelles and the location of the sampling station (St; 40°09′ N 26°24′ E).
Water quality parameters such as temperature, salinity, pH and dissolved oxygen (DO) were measured in situ using an YSI 6600 Model Multiple Water Analysis Probe during the time of each sampling.
Water for nutrient samples was kept frozen until analysis. Analyses for nitrite (NO−2), nitrate (NO−3), inorganic phosphate (PO−34) and silicate (SiO4) were conducted using a Technicon model auto-analyser according to the method of Strickland & Parsons (Reference Strickland and Parsons1972).
Chlorophyll-a samples were filtered through GF/F glass fibre filters. The filters were folded into aluminium foil and immediately frozen for the laboratory analysis. Chlorophyll-a was determined spectrophotometrically after extraction by 90% acetone (Strickland & Parsons, Reference Strickland and Parsons1972).
For quantitative analysis of phytoplankton, two litres of water samples collected with a Nansen bottle were preserved with 2% buffered formalin (v/v) and microscopic analysis was conducted within a week of the collection. Utermöhl sedimentation chambers and Neubauer and Sedgwick-Rafter counting slides were used in combination for enumeration of the phytoplankton species depending on the dimensions and concentrations of the organisms (Guillard, Reference Guillard and Sournia1978; Hasle, Reference Hasle and Sournia1978; Venrick, Reference Venrick and Sournia1978). Finally, Pearson correlation analysis among data groups within the surface, interface and deep layers was conducted separately using the Statistical Package for the Social Sciences 11.5 (SPSS, 2003). In some cases linear regression relationships were also obtained. All variables except pH were previously log10 transformed to improve linearity, as well as the normality and homogeneity of variances (Quinn & Keough, Reference Quinn and Keough2002).
The time-sequence of SeaWiFS true colour images of the Sea of Marmara and the Dardanelles showing the initiation, development and the decay of the E. huxleyi bloom in early summer 2003 were provided by Norman Kuring of the NASA SeaWiFS Project and the Goddard Earth Sciences Distributed Active Archive Center.
RESULTS
Vertical profiles of temperature and salinity suggest two different water masses during the E. huxleyi bloom (Figure 2A & B). A thin upper layer (0–15 m) had salinity values of 22.3–25.4 ppt while a much thicker lower layer (25–60 m) had salinity values of 36.5–38.5 ppt. However, temperature variations in both the upper layer (19.1–26.4°C) and lower layer (13.8–18.9°C) were more variable than salinity variations. Both seasonal thermocline and halocline interfaces were clear and formed between 15 and 25 m during the algal blooms (Figure 2A & B).

Fig. 2. The vertical profiles of (A) temperature (B) salinity (C) pH and (D) dissolved oxygen during the Emiliania huxleyi bloom in the Dardanelles.
During the bloom, pH values changed from 8.01 to 8.20 in the upper layer and from 7.72 to 7.96 in the lower layer (Figure 2C). However, DO values changed from 8.67 to 11.3 mg l−1 in the upper layer and from 7.75 to 9.01 mg l−1 in the lower layer. DO values in both upper and lower layer of the Dardanelles revealed high saturation (Figure 2D). According to the temperature and salinity values, it was calculated that DO values above 8.0 mg l−1 are high saturation values in both the upper layer and in the lower layer during the bloom. High saturated DO concentrations gradually decreased from the upper to the lower layer during the bloom.
Vertical profiles of inorganic nutrients showed that the concentrations in the upper layer were lower than the concentrations in the lower layer during bloom conditions (Figure 3A, B & C). Nutrient concentrations increased from the surface to 10 m. NO−2 + NO−3 had a peak value (1.5 µM) at 10 m. Below 10 m, all nutrients but silicate gradually decreased with depth. Silicate concentrations increased rather dramatically with depth (Figure 3C). N:P, Si:P and Si:N ratios are displayed in Figure 4A, B & C, respectively. N:P ratios were significantly lower than the assimilatory optimal of the Redfield ratio (Figure 4A). On the other hand, it is observed that the mean Si:P ratios were higher in the lower layer than in the upper layer (Figure 4B). N:P ratios ranged from 1.58 to 16.96 (mean 9.11 ± 3.95) while Si:P ratios ranged from 12.32 to 28.98 (20.91 ± 5.97) in the upper layer during the bloom conditions. However, Si:N ratios varied between 1.23 and 9.34 (mean 3.07 ± 2.16) in the upper layer and between 1.62 and 7.19 (mean 2.89 ± 1.93) in the lower layer during the bloom in the Dardanelles (Figure 4C).

Fig. 3. The vertical profiles of (A) PO−34, (B) NO−2 + NO−3, (C) SiO4 and (D) chlorophyll-a during the Emiliania huxleyi bloom in the Dardanelles.

Fig. 4. The vertical profiles of (A) N:P, (B) Si:P and (C) Si:N during the bloom in the Dardanelles.
Chlorophyll-a concentrations ranged from 1.5 to 6.5 µg l−1 in the upper layer (Figure 3F). The chlorophyll-a maximum was observed at about 7.5–10 m, the same depth as the NO−2 + NO−3 peak (Figure 3D).
The time-sequence of SeaWiFS images in Figure 5 shows the development of the E. huxleyi bloom in the Sea of Marmara in early summer 2003. The turquoise colour indicates the regions with the highest coccolith accumulations. The algal bloom started in Izmit Bay in early June then quickly spread through the Sea of Marmara and lasted until mid-July (Figure 5).

Fig. 5. SeaWiFS true colour images of the Sea of Marmara and the Dardanelles showing the (A) initiation, (B) development and (C) decay of the Emiliania huxleyi bloom in early summer 2003. The images are provided by Norman Kuring of the NASA Project/Goddard Earth Sciences. Turquoise colour marks the coccoliths in images (B) and (C).
Vertical profiles of E. huxleyi, Ceratium furca var. furca (Ehrenberg) Sournia, Ceratium fusus var. seta (Ehrenberg) Schiller and Prorocentrum micans Ehrenberg are shown in Figure 6. During the bloom period, cell density of E. huxleyi increased from 3.58 × 10⁷ to 2.55 × 10⁸ cells l−1 in the superficial layer. Between 12–25 June, E. huxleyi exceeded 2.0 × 10⁸ cells l−1 in the superficial layer. In general, the density dramatically decreased with depth (Figure 5A). Cell density of P. micans exceeded 1.0 × 10⁶ cells l−1 in the surface layer, reaching its peak on 12 June with a value of 3.3 × 10⁶ cells l−1 (Figure 6B). After this major peak, density of this species gradually decreased with depth. Other abundant species in this area included C. furca var. furca and C. fusus var. seta. Ceratium spp. in Figure 6C combines these two species for simplicity. Although cell density of these combined species was less (minimum–maximum: 3.90 × 10⁴ −1.05 × 10⁶ cells l−1; mean: 2.44 × 10⁵ ± 2.30 × 10⁵ cell l−1) than cell density of P. micans (minimum–maximum: 4.4 × 10⁴−3.30 × 10⁶ cells l−1; mean: 7.82 × 10⁵ ± 8.96 × 10⁵ cell l−1), the vertical profile was similar to P. micans in the surface layer during the algal bloom (Figure 6B & C).
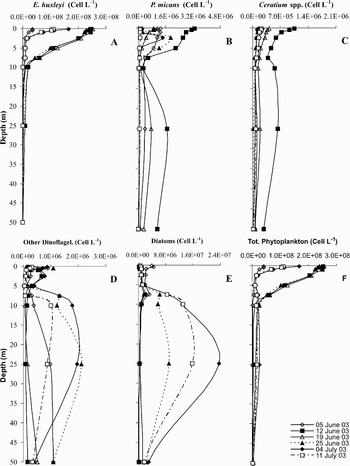
Fig. 6. The vertical profiles of (A) coccolithophore Emiliania huxleyi, (B) dinoflagellates Prorocentrum micans and (C) Ceratium spp., (D) other dinoflagellates, (E) diatoms and (F) total phytoplankton during the bloom. Numbers are in cells l−1. Note that scales are different for different phytoplankton groups.
Emiliania huxleyi was found to be the dominant species accounting for more than 90.0% of the phytoplankton assemblage (Table 1). Three dinoflagellates, C. furca var. furca, C. fusus var. seta and P. micans were other important species at the time of the E. huxleyi bloom. Prorocentrum micans was the second most-abundant species accounting for approximately 5.6% of the total phytoplankton (Table 1).
Table 1. Rational contributions (%) of coccolithophore Emiliania huxleyi, dinoflagellates Prorocentrum micans, Ceratium spp., other dinoflagellates and diatoms to phytoplankton community composition placed into different groups in the different water layers of the Dardanelles in the E. huxleyi bloom period of 5 June–11 July 2003.

Analysis showed strong positive correlations between E. huxleyi and chlorophyll-a in the surface and interface layers (Table 2). There was not a significant relation between E. huxleyi and the other parameters (Figure 7). Prorocentrum micans, Ceratium spp. and other dinoflagellates showed strong negative correlations with SiO4 in the surface layer (Table 2). Additionally, strong positive relations were observed between P. micans, dinoflagellates and PO−34 in the surface layer. Diatoms were strongly related with temperature, pH, PO−34 and SiO4 in the interface layer (Table 2). Prorocentrum micans showed strong negative relations with temperature, pH and SiO4 while there was a strong positive correlation between PO−34 in the interface layer. Dinoflagellates showed a relatively strong positive relation with PO−34 and negative correlation with temperature in the deep layer (Table 2).

Fig. 7. Relationships between Emiliania huxleyi and PO−34 in the surface (0.5 m), interface (25 m) and deep (50 m) layer of the Dardanelles. For each regression, the coefficients of determination (r2) and the significance levels (P) are shown.
Table 2. Pearson correlations between coccolithophore Emiliania huxleyi, dinoflagellates Prorocentrum micans, Ceratium spp., other dinoflagellate species, diatoms and several environmental and biological variables in the surface (0.5 m), interface (25 m) and deep (50 m) layer of the Dardanelles. Significant correlation coefficients are shown (*: P< 0.05; **: P < 0.01) and non-significant relationships are indicated (n.s.: P > 0.05).

While cell densities of the diatoms and dinoflagellates in the superficial layer varied between 5.0 × 10⁵ −4.5 × 10⁶ cells l−1 and 4.0 × 10⁴ −1.1 × 10⁶ cells l−1 respectively, their densities in the sub-surface layer varied between 7.8 × 10⁵ −2.4 × 10⁷ cells l−1 and 5.6 × 10⁴−2.1 × 10⁶ cells l−1 respectively. Except the 5 June 2003 sampling date, although cell density of diatoms was under 1.0 × 10⁶ cells l−1 in the superficial layer (0–5 m) due to the rather high E. huxleyi bloom, it was above 1.0 × 10⁷ cells l−1 in the sub-surface layer (10–25 m) in the second half period of the bloom (25 June–11 July 2003) (Figure 6E) due to the more dramatic decrease of the bloom (Figure 6A). On the other hand, while production of E. huxleyi was more important in the superficial layer than in the sub-surface layer, production of diatoms was more important in the sub-surface layer than in the superficial layer (Figure 4E). This low diatom production in the superficial layer was clear in the bloom period due to the significant decrease of phosphate (Figure 3A) and also the deficiency of silicate (<2.0 µM) essential for diatom production in the superficial layer in spite of the partial decay of the bloom (Figure 3C). However, high diatom production was clear in the sub-surface layer due to the sufficient amounts of nutrients, especially silicate and the dramatic decrease of the E. huxleyi bloom. This tendency of diatoms in the vertical profile was roughly similar to the vertical profile of the dinoflagellates except for P. micans and Ceratium spp. (Figure 6D). Contrary to other dinoflagellate species, P. micans and Ceratium spp. in the upper layer were higher than in the sub-surface layer.
DISCUSSION
Recently depleted inorganic nutrients, high irradiance and a stable water column in terms of vertical mixing following the establishment of the seasonal thermocline were the characteristics of the E. huxleyi bloom and the others in the Dardanelles confirmed previous studies on E. huxleyi blooms in the North Sea and north-eastern Atlantic (Nanninga & Tyrrell, Reference Nanninga and Tyrrell1996; Smyth et al., 2004; Zeichen & Robinson, Reference Zeichen and Robinson2004). In general, it has been suggested that E. huxleyi blooms follow those of diatoms (Holligan et al., Reference Holligan, Groom and Harbour1993; Uysal, Reference Uysal1995; Turkoglu & Koray Reference Turkoglu and Koray2002, Reference Turkoglu and Koray2004; Broerse et al., Reference Broerse, Tyrrell, Young, Poulton, Merico, Balch and Miller2003; Turkoglu et al., Reference Turkoglu, Buyukates and Kaya2004b; Turkoglu, Reference Turkoglu2005) and the summer 2003 event in the Sea of Marmara and the Dardanelles was no exception.
Nutrient dynamics in the Dardanelles differ slightly due to different water masses (Polat & Tugrul, Reference Polat and Tugrul1995; Unsal et al., Reference Unsal, Turkoglu and Yenici2003; Turkoglu et al., Reference Turkoglu, Unsal, Ismen, Mavili, Sever, Yenici, Kaya and Coker2004a, Reference Turkoglu, Yenici, Ismen and Kayac, Reference Turkoglu, Buyukates and Kayad; Turkoglu & Erdoğan, Reference Turkoglu and Erdoğan2007a, b; Turkoglu et al., Reference Turkoglu, Buyukates and Oner2007). Our results, however, are contradictory to previous observations, where the brackish Black Sea upper layer has high nutrient values and the salty Mediterranean lower layer has low nutrient values (Polat & Tugrul, Reference Polat and Tugrul1995; Polat et al., Reference Polat, Tugrul, Coban, Basturk and Salihoglu1998). Lower nutrient concentrations in the upper layer than the lower layer were probably due to the removal of nutrients by the early bloom of diatoms. Therefore, for instance, while diatoms were diminishing in the superficial layer (0–5 m), they were increasing in sub-surface layer (10–;25 m) due to the sufficient nutrient concentration. As a result of the sufficient nutrient concentration in the sub-surface layer, there were intensive blooms of some diatoms (5.7 × 10⁶ −2.4 × 10⁷ cells l−1) such as Rhizosolenia setigera Brightwell, Rhizosolenia fragilissima Bergon and Pseudonitzchia pungens (Grunow ex P.T. Cleve) Hasle between 25 June 2003 and 11 July 2003 in the sub-surface layer due to the high nutrient concentration, especially the high NO−2 + NO−3 concentration. It is known that diatoms are favoured when nitrogen is available at higher concentrations (Piehler et al., Reference Piehler, Twomey, Hall and Paerl2004) and it is also known that large phytoplankton cells such as R. setigera, R. fragilissima and P. pungens are better competitors for nitrate because of their larger specific storage volume (Dauchez et al., Reference Dauchez, Legendre, Fortier and Levasseur1996; Kormas et al., Reference Kormas, Garametsi and Nicolaidou2002).
Emiliania huxleyi is known to tolerate low nutrient levels and this ability allows this group to outcompete other species (Balch et al., Reference Balch, Holigan, Ackleson and Voss1991; Paasche, Reference Paasche2002). It is also known that E. huxleyi growth is limited by phosphate (Paasche, Reference Paasche2002). Naturally, the study system is nitrogen limited and low N:P ratios in this study confirmed previously reported values in other studies (Polat et al., Reference Polat, Tugrul, Coban, Basturk and Salihoglu1998; Turkoglu et al., Reference Turkoglu, Unsal, Ismen, Mavili, Sever, Yenici, Kaya and Coker2004a, Reference Turkoglu, Yenici, Ismen and Kayac, Reference Turkoglu, Buyukates and Kayad; Turkoglu & Erdoğan, Reference Turkoglu and Erdoğan2007a, b; Turkoglu et al., Reference Turkoglu, Buyukates and Oner2007). It is known that Redfield et al. (Reference Redfield, Ketchum, Richards and Hill1963) mentioned a ratio (C:N:P = 106:16:1) among the elements of sea water. If N:P ratios in a system are below the normal value of 16:1, the system is a nitrogen limited area (Stefanson & Richards, Reference Stefanson and Richards1963). However, if Si:N ratios in a system are below the value of 1:1, the system is a silicate limited area. Since N:P ratios (mean 9.11 ± 3.95) during the algal bloom are below the Redfield ratio (16:1) and Si:N ratios (average 3.03 ± 2.09) are above the Redfield ratio (1:1), the Dardanelles is limited for nitrogen, but for phosphate and silicate. It is known that diatom growth in marine waters is likely to be limited by dissolved silica when Si:N ratios are less than 1 according to Redfield ratios (Redfield et al., Reference Redfield, Ketchum, Richards and Hill1963; Piehler et al., Reference Piehler, Twomey, Hall and Paerl2004) or N:Si ratios above 1 (Roberts et al., Reference Roberts, Davidson and Gilpin2003).
Therefore, this may indicate that E. huxleyi growth was not nutrient limited. Additionally, in contrast to N:P, higher Si:P ratios in the lower layer than in the upper layer were due to the increase of silicate with depth. Consistent with these results diatoms dominated the lower layer. The chlorophyll-a maximum at 10 m depth during the algal bloom in the Dardanelles was mostly due to the abundance of diatoms and partly other dinoflagellates rather than P. micans and Ceratium species. In contradiction to some other studies (Balch et al., Reference Balch, Holigan, Ackleson and Voss1991, Reference Balch, Kilpatrick, Holigan, Harbour and Fernandez1996; Cokacar et al., Reference Cokacar, Oguz and Kubilay2004) E. huxleyi and chlorophyll-a were well correlated in this study (Table 2). But, it is known that E. huxleyi cells are small and consist of 0.1 × 10⁻¹² g chlorophyll-a cell−1 (Stolte et al., Reference Stolte, Kraay, Noordeloos and Riegman2000). The important positive relationship between E. huxleyi and chlorophyll-a can be explained due to a higher cell density during the bloom in the Dardanelles than in other areas such as the north-eastern Atlantic, subarctic Pacific and the south-eastern Bering Sea (Tyrrell & Taylor, Reference Tyrrell and Taylor1995; Hattori et al., Reference Hattori, Koike, Tachikawa, Saito and Nagasawa2004). Therefore, this bloom may be likely to have higher chlorophyll-a concentrations than the blooms of other areas.
Numerically, abundance of E. huxleyi during the study in the Dardanelles was higher than previous abundances in the north Aegean Sea (Aubert et al., Reference Aubert, Revillon, Aubert, Leger, Drai, Arnoux and Diana1990; Turkoglu et al., Reference Turkoglu, Unsal, Ismen, Mavili, Sever, Yenici, Kaya and Coker2004a) and in the other parts of the Turkish Straits System such as the Bosphorus and Sea of Marmara (Aubert et al., Reference Aubert, Revillon, Aubert, Leger, Drai, Arnoux and Diana1990), to the extent that the abundance was generally higher than previous ones in the Black Sea (Turkoglu & Koray, Reference Turkoglu and Koray2002, Reference Turkoglu and Koray2004; Cokacar et al., Reference Cokacar, Oguz and Kubilay2004). It is known that the Turkish Straits System is a water passage between the Mediterranean and the Black Sea region (Besiktepe et al., Reference Besiktepe, Sur, Ozsoy, Latif, Oguz and Unluata1994). For instance, some of the biogenic organic matter such as bacterio-plankton and phytoplankton in the Black Sea can be naturally exported to the Sea of Marmara and then reach the eastern Mediterranean via the Dardanelles (Polat & Tugrul, Reference Polat and Tugrul1996).
Although this study is not the first for the Dardanelles and Sea of Marmara, it is the first detailed study to present vertical distribution of E. huxleyi and the interaction of this species with other phytoplankton groups in the Dardanelles. Previous studies have shown the appearance and density of this species in the Turkish Straits System (Aubert et al., Reference Aubert, Revillon, Aubert, Leger, Drai, Arnoux and Diana1990; Uysal, Reference Uysal1995; Unsal et al., Reference Unsal, Turkoglu and Yenici2003; Turkoglu et al., Reference Turkoglu, Unsal, Ismen, Mavili, Sever, Yenici, Kaya and Coker2004a, Reference Turkoglu, Buyukates and Kayab, Reference Turkoglu, Buyukates and Kayad) and the Black Sea since the 1980s (Mikaelyan, Reference Mikaelyan, Ozsoy and Mikaelyan1997; Moncheva & Krastev, Reference Moncheva, Krastev, Ozsoy and Mikaelyan1997; Cokacar et al., Reference Cokacar, Kubilay and Oguz2001; Turkoglu & Koray, Reference Turkoglu and Koray2002, Reference Turkoglu and Koray2004). Therefore, this study may also indicate advancing of this species from the Black Sea through the Sea of Marmara and the Dardanelles under favourable conditions. This may be due to the climate changes in addition to the dramatic eutrophication of the system since the 1980s or this occurrence may just be an artefact of the transport of this species by the help of a two-layer flow regime in the Dardanelles. Further monitoring of the system in terms of anomalies in the temperature and salinity changes as well as the phytoplankton species composition is needed to better understand the bio-ecological significance of this species in and around this system.
ACKNOWLEDGEMENTS
This study was supported by the Turkish Scientific and Technical Research Council (TUBITAK, YDABAG, project number 101Y081). We thank Norman Kuring of the NASA SeaWiFS Project and the Goddard Earth Sciences Distributed Active Archive Center for producing and providing the images. Thanks are extended to Sandra E. Shumway and anonymous referees for their critiques on the previous version of this manuscript.


