1. Introduction
Numerous studies have documented alteration by hydrothermal fluids in Palaeozoic rocks in the southern Midcontinent (e.g. Cathles & Smith, Reference Chalmers, Bustin and Power1983; Bethke & Marshak, Reference Bethke and Marshak1990; Elmore et al. Reference Elmore, Muxworthy, Aldana, Elmore, Muxworthy, Aldana and Mena1993; Garven et al. Reference Goldstein and King1993 and numerous others). Most of these studies focused on ore deposits and carbonates. Estimates of the timing based on radiometric and palaeomagnetic techniques generally cover a wide age range in the late Palaeozoic period (e.g. Leach et al. Reference Li and Schieber2001). A number of mechanisms have been proposed for the origin of the hydrothermal deposits, with most studies suggesting a connection with collisional tectonics and uplift (e.g. Bethke & Marshak, Reference Bethke and Marshak1990; Garven et al. Reference Goldstein and King1993). Determining the timing of hydrothermal alteration can provide important constraints on the origin of the hydrothermal fluids.
The objective of this study is to test the timing and origin of hydrothermal alteration in the Woodford Shale, an important source rock and unconventional reservoir (Cardott, Reference Cardott2012; Kennedy et al. Reference Kirkland, Denison, Summers and Gormly2014), in an oriented core from the Ardmore Basin, southern Oklahoma (Core B; Fig. 1a). A recent study of the Woodford Shale (Upper Devonian – lower Mississippian) indicates that the unit contains hydrothermal minerals in two cores in the Anadarko Basin in Oklahoma (Roberts & Elmore, Reference Roberts and Elmore2018). Alteration by hydrothermal fluids will be tested in the Ardmore Basin core based on petrographic observations, and the timing of alteration will be determined using palaeomagnetic analysis (e.g. Elmore et al. Reference Elmore, Muxworthy, Aldana, Elmore, Muxworthy, Aldana and Mena2012). The results will be compared to the timing of other hydrothermal events in the Midcontinent (e.g. Shelton et al. Reference Shelton, Reader, Ross, Viele and Siedeman1986; Garven et al. Reference Goldstein and King1993; Leach et al. Reference Li and Schieber2001).

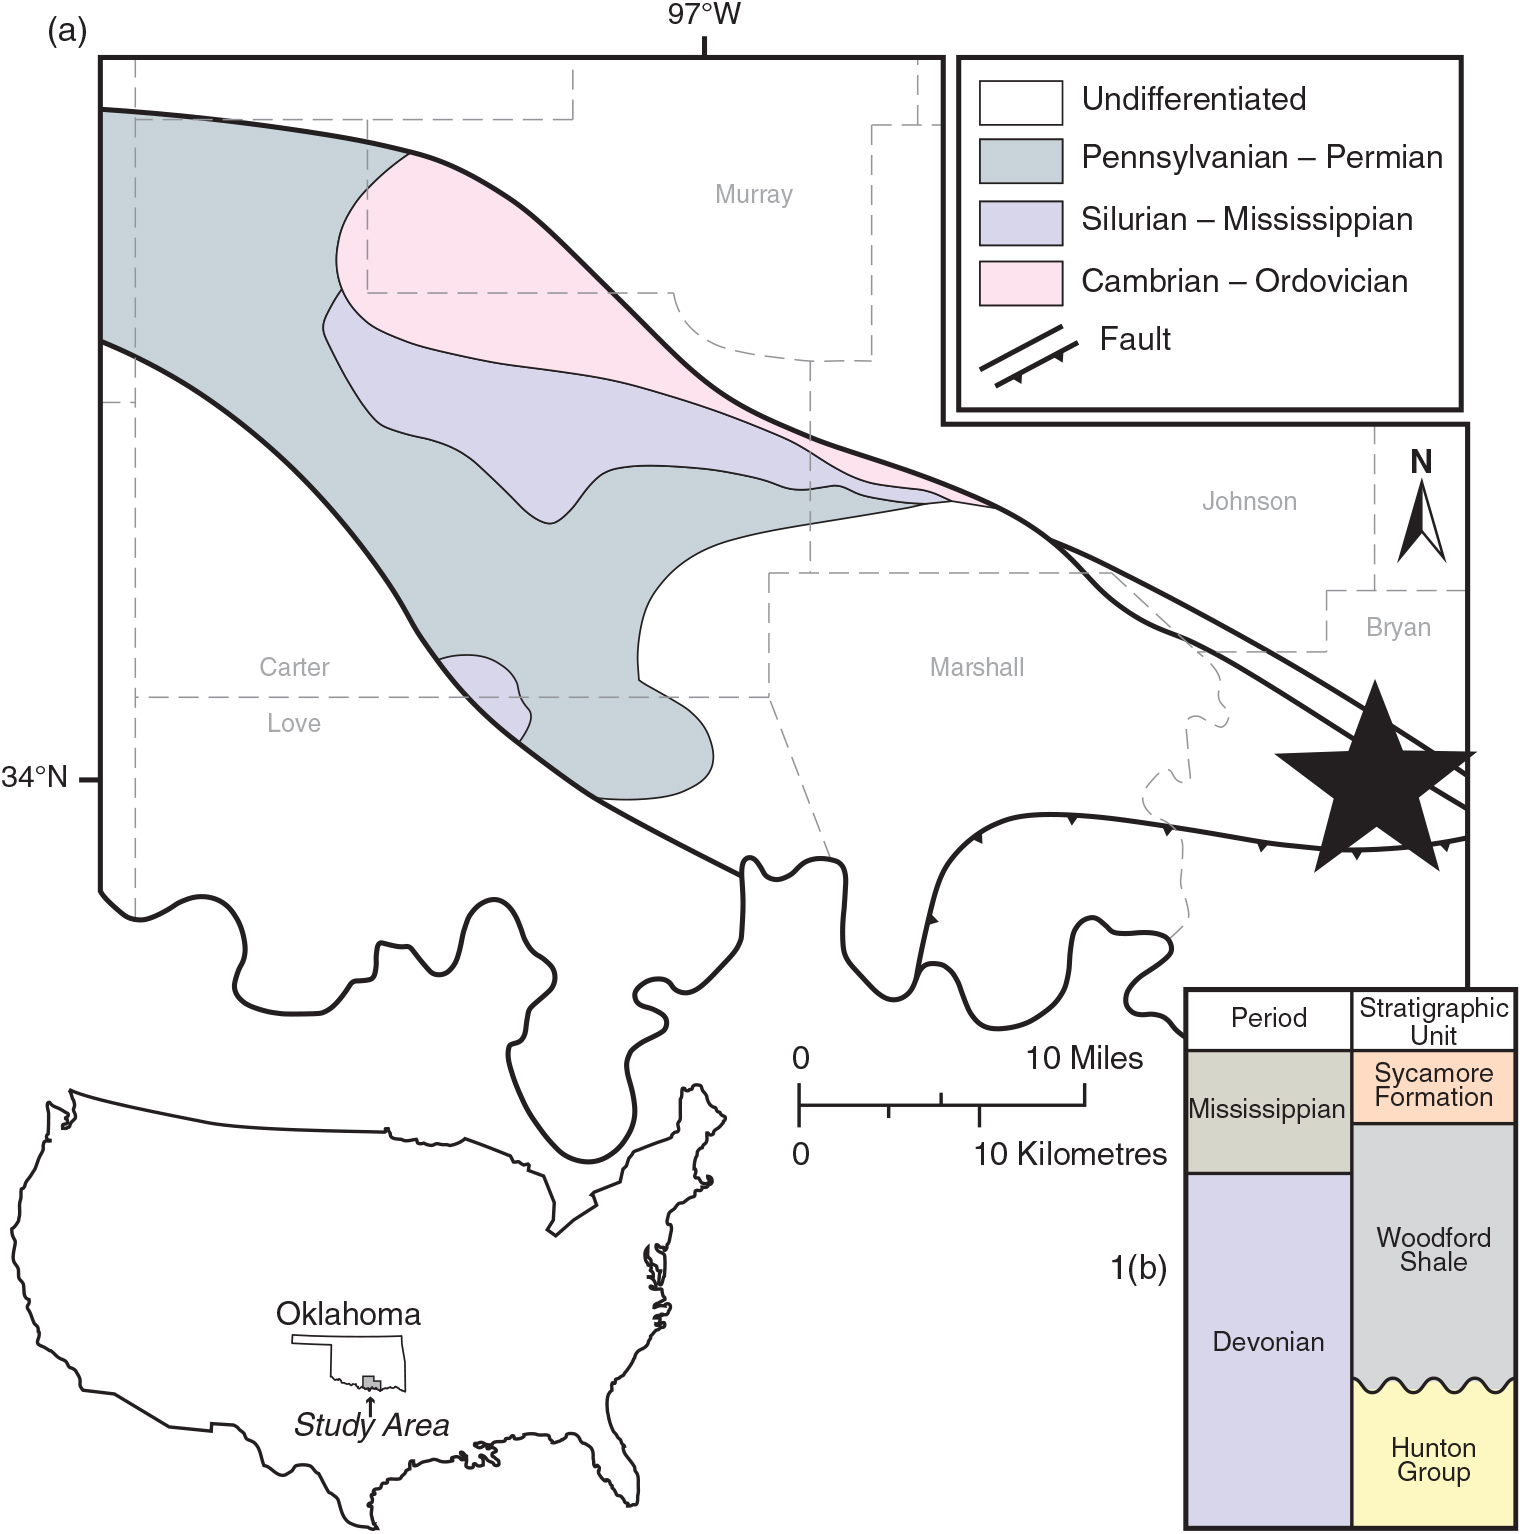
Fig. 1. (a) Simplified geologic map of the Ardmore Basin showing major rock units and faults in the basin (after Northcutt & Campbell, Reference Northcutt, Campbell, Hogan and Gilbert1998). Map of the United States shows location of Oklahoma and the study area. The star indicates the location of Core B. ‘Undifferentiated’ refers to Cretaceous and Quaternary rocks. (b) Simplified stratigraphic section from the study area. Adapted by permission from Springer Nature: Springer: Geologic Provinces of Oklahoma, RA Northcutt & JA Campbell, © Reference Northcutt, Campbell, Hogan and Gilbert1998.
The results of the study also have implications for our understanding of shales, which can be diagenetically complex and heterogeneous (e.g. Milliken et al. Reference Mrose, Chao, Fahey and Milton2012; Kennedy et al. Reference Kirkland, Denison, Summers and Gormly2014). While progress has been made understanding shale diagenesis, several fundamental issues still need to be investigated, including how shales evolve and whether they behave as open or closed systems (e.g. Land et al. Reference Landis and Castaño1997; Bjorlykke & Jahren, Reference Bjorlykke and Jahren2012). One reason for the mineralogical heterogeneity in shales could be alteration by external fluids.
2. Geologic setting
Between the late Cambrian and Mississippian period, up to ∼3 km of mostly carbonate and shale sequences were deposited in the southern Oklahoma trough, including the Woodford Shale (Perry, Reference Perry1989). During the Ouachita orogeny (late Mississippian to late Pennsylvanian), the trough was divided into sub-basins including the Ardmore Basin (Granath, Reference Hanor1989). The Ardmore Basin is within the foreland of the Ouachita fold belt, and is bounded by faults (Fig. 1a) which were part of a left-lateral fault system that evolved into a transpressive system in Pennsylvanian time (Granath, Reference Hanor1989). During Pennsylvanian deformation, the rocks in the Ardmore Basin were folded, faulted and uplifted, resulting in the structural complexity observed today (Granath, Reference Hanor1989). As a result of the deformation, unconformities and syntectonic conglomerates (e.g. Collings Ranch) are present in the Pennsylvanian section (Granath, Reference Hanor1989).
The Woodford Shale is an organic-rich, siliceous black shale with interbedded light-coloured shale, siltstone, dolostone and chert (Miceli Romero & Philp, Reference Migaszewski, Starnawska and Gałuszka2012) deposited in restricted marine, hypersaline and potentially lacustrine environments (Infante-Paez et al. Reference Jackson and Solheid2017). The high organic content present in the Woodford Shale is due to the primarily anoxic conditions it was deposited under and slow sedimentation rates, with its variability caused by sea-level fluctuations and topographic relief influencing ocean circulation and oxygenation during deposition (Kirkland et al. Reference Kirschvink1992). The Woodford Shale unconformably overlies the Hunton Group (Chimneyhill Subgroup, Henryhouse Shale, Haragan Shale and Bois d’Arc Limestone) and is conformably overlain by the Sycamore Limestone in the Ardmore Basin (Fig. 1b). The unconformity surface contains considerable topographic relief due to incised valleys and karst features that formed during subaerial exposure resulting from drops in eustatic sea-level (Infante-Paez et al. Reference Jackson and Solheid2017).
Several studies report on the diagenesis of the Woodford Shale in the Anadarko Basin (e.g. Chalmers et al. Reference Chalmers, Bustin and Power2012; Cardott, Reference Cathles and Smith2013; Laughrey et al. Reference Leach, Bradley, Lewchuk, Symons, de Marsily and Brannon2017; Roberts & Elmore, Reference Roberts and Elmore2018). Roberts & Elmore (Reference Roberts and Elmore2018) reported that the Woodford Shale contains hydrothermal minerals such as magnesite (MgCO3), norsethite (BaMg (CO3)2), gorceixite (BaAl3 (PO4)(PO3OH)(OH)6) and potassium feldspar in two cores from the southern part of the Anadarko Basin to the west and north of the Ardmore Basin. The absolute timing for precipitation of these minerals is unknown, although they are interpreted to have precipitated during middle–late diagenesis, mostly in and around mineralized fractures.
3. Methodology
Core B contains a total of 55 m (179 ft) of Woodford Shale, with depths ranging from 1011–1066 m (3317–3496 ft) and was oriented using the scribe method (Nelson et al. Reference Northcutt, Campbell, Hogan and Gilbert1987). The core is vertical and the bedding is horizontal. A fault occurs ∼600 m (∼2000 ft) above the Woodford Shale and there are some faults within the Woodford Shale. Most specimens (87 %) contain mineralized fractures (Fig. 2a) or are within 6 cm of an obvious fracture. The ‘butt’ sections of the vertical core were drilled normal to the bedding using a fixed, variable-speed, water-cooled drill press with a non-magnetic core bit, and oriented relative to the scribe line and the stratigraphic up direction. Core plugs were cut into standard palaeomagnetic specimens (2.54 diameter x 2.2 cm) and chips were used for thin-sections.

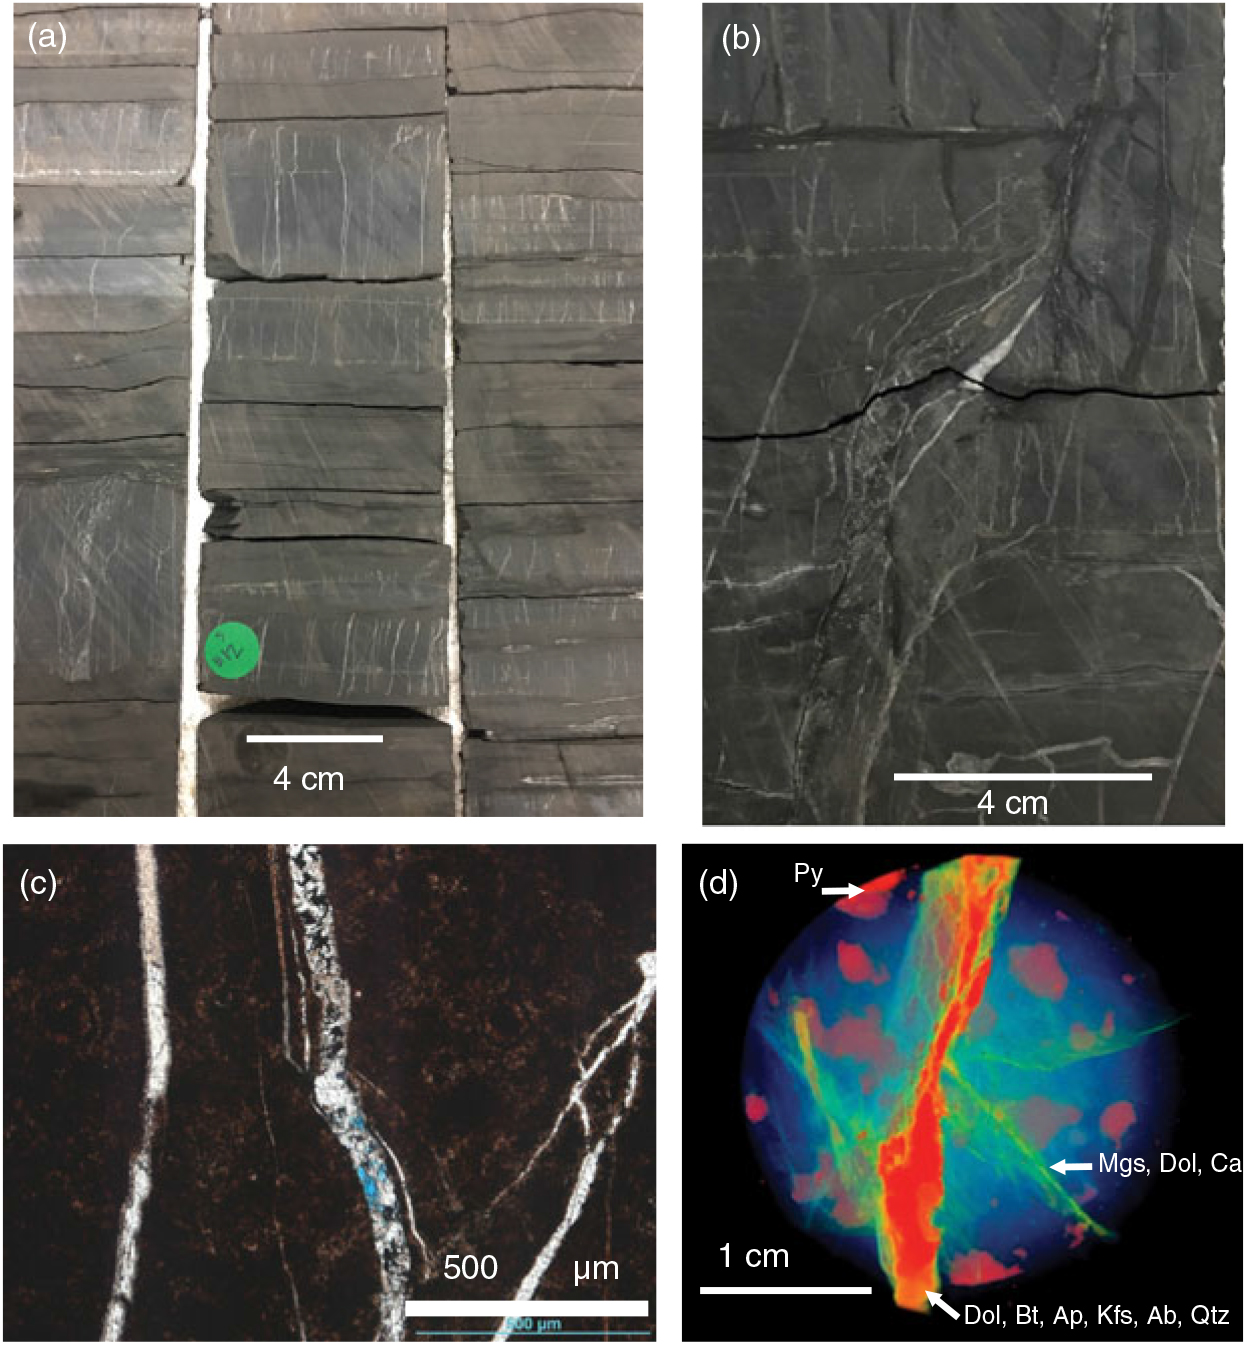
Fig. 2. (a, b) Photographs of representative core sections showing the, mostly vertical, mineralized fractures. Most fractures occur in siliceous beds. (c) Thin-section photomicrograph of siliceous shale with mineralized fractures filled with calcite and dolomite (plane-polarized light, PPL). (d) XRCT scan of sample illustrating the fractures in the sample. The less dense material (blue) has been largely removed, which shows the more dense mineralized fractures (red and green, red highest density) in three dimensions. Minerals in the fractures were identified based on SEM-EDS and thin-section analysis (see Fig. 3) of the core. (Dol – dolomite; Bt – biotite; Ap – apatite; Kfs – potassium feldspar; Ab – albite; Mgs – magnesite; Qtz – quartz; Py – pyrite; Cal – calcite)
Thirty-five polished thin-sections were examined using a petrographic microscope in both reflected and transmitted light and using a scanning electron microscope (SEM) with an electron dispersive spectrometer (EDS). The focus of the petrographic study was on mineralized fractures. Minerals were identified based on their habits and elemental composition, and their relative timing was determined by textural relationships. X-ray computed tomography scans (XRCT) were conducted on 2.5 cm plugs from the core to further characterize fracture networks and upscale features seen on the petrographic scale. XRCT data from Core B was obtained from the University of Minnesota using a X5000 high-resolution micro-CT system with a twin head 225 kV FeinFocus FXE-225.99 X-ray tube and Dexela 2923 area detector.
A Vickers M17 Research Microscope system adapted for reflected white light on slides immersed in oil at a magnification of 500× was used to obtain vitrinite and bitumen reflectance data from in and around mineralized fractures. The bitumen reflectance data was used to calculate vitrinite reflectance equivalent (VRE) values for thermal maturity (Landis & Castaño, Reference Laughrey, Purrazzella and Hooghan1994; Schoenherr et al. Reference Schoenherr, Littke, Urai, Kukla and Rawahi2007). Fluid inclusions in calcite and barite from mineralized fractures were examined but were too small to determine homogenization temperatures or compositions.
Thirty-four specimens collected from the core were subjected to stepwise, thermal demagnetization and were measured in a 2G-Enterprises cryogenic magnetometer with a direct current superconducting quantum interference device in a magnetically shielded room. In addition, three specimens were subjected to alternating field (AF) demagnetization up to 120 mT in 10 mT increments. Demagnetization data was plotted on orthogonal diagrams, from which magnetic components were found using principal component analysis (Kirschvink, Reference Land, Mack, Milliken and Lynch1980). Magnetic components with the maximum angular deviation (MAD) less than 18° were selected to calculate mean statistics (Fisher, Reference Garven, Ge, Person and Sverjensku1953).
Rock magnetic experiments were also performed to identify the magnetic mineralogy. Hysteresis loops were acquired on representative samples on a Princeton Measurements vibrating sample magnetometer (VSM) 3900-04 at Southern Illinois University Carbondale. An applied field of 0.5 Tesla (T) was applied to saturate the samples with a field step of 2.5 mT and averaging time of 0.5 s, which allowed for maximum signal to noise ratio. The paramagnetic slope correction and a moderate moving window smoothing was applied to raw hysteresis loops (e.g. Jackson & Solheid, Reference Johnson2010; Paterson et al. Reference Paterson, Zhao, Jackson and Heslop2018). Hysteresis parameters (remanent magnetization, Mrs; saturation magnetization, Ms; and coercivity, Bc) were computed from processed loops. Back-field measurements were measured to obtain remanent coercivity (Bcr). Isothermal remanent magnetization (IRM) acquisition curves were acquired in order to determine the contribution of magnetic carrier minerals. The IRM curves were analysed using the Max Unmix program (Maxbauer et al. Reference McCabe, Van der Voo and Ballard2016) to determine the coercivity spectrum of the samples. A Monte-Carlo style resampling routine was used for error analysis. The 95 % confidence intervals were used to display uncertainty in each modelled component distributions.
4. Results and interpretations
The stratigraphy of the Woodford Shale in the core is dominated by cherty and siliceous facies (Fig. 2a), with the least common facies being argillaceous and dolomitic. The lower section of the Woodford Shale is characterized by siliceous and argillaceous facies with sparse grey silty laminae which decrease up section where cherty and siliceous facies that are either massive or contain faint dark grey laminae dominate. Mineralized fractures are ubiquitous (Fig. 2a–d), particularly in the siliceous and cherty facies (Fig. 2b), and some brecciation is also present. Most mineralized fractures are vertical to subvertical and occur in siliceous beds (Fig. 2a–c). The XRCT analysis illustrates large millimetre-scale mineralized fractures with higher density mineral assemblages and relatively lower density mineral assemblages in the subordinate (< 1 mm) fractures (Fig. 2d).
The Woodford Shale displays a complex paragenesis (Fig. 3). Events within the matrix and allochems occurred primarily during early diagenesis whereas events associated with fracturing dominate late diagenesis. The most common allochems present are Radiolaria and Tasmanites. Events interpreted as early based on petrographic relationships include precipitation of pyrite (Fig. 2d), formation of phosphate nodules with barite and silica filling pores within the nodules, and quartz overgrowths.

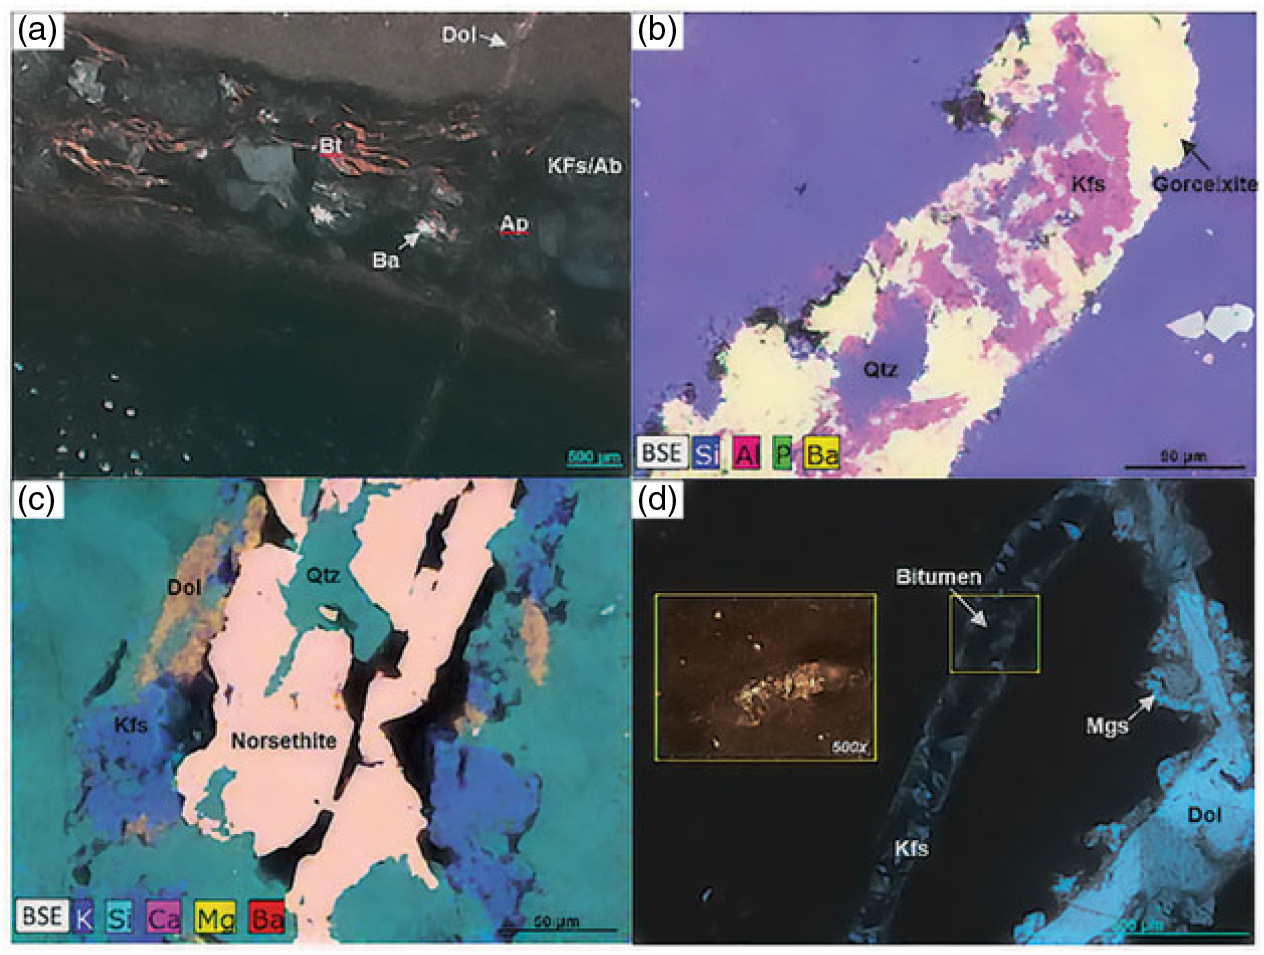
Fig. 3. Hydrothermal and diagenetic features/minerals. (a) Photomicrograph displaying a horizontal fracture filled with biotite, potassium feldspar as well as apatite and barite. The horizontal fracture is cut by a vertical dolomite-filled fracture (cross-polarized light, CPO). (b) Backscattered electron (BSE) image with elements based on an energy dispersive spectroscopy (EDS) overlay displaying a fracture filled with gorceixite (yellow-green-pink), potassium feldspar (pink-blue) and quartz (blue). (c) BSE image with an EDS overlay and the interpreted phases. The fracture contains dolomite (orange), potassium feldspar (blue), norsethite (red-yellow) and quartz (cyan). (d) Fracture containing dolomite and magnesite, and another containing potassium feldspar and pyrobitumen. Note that magnesite extends into the matrix. The pyrobitumen is displayed in a reflected-light image (yellow box) and was used to obtain bitumen reflectance values (CPO). (Dol – dolomite; Bt – biotite; Ba – barite; Ap – apatite; Kfs – potassium feldspar; Ab – albite; Mgs – magnesite; Qtz – quartz; Py – pyrite)
Mineralized fractures contain multiple minerals, including potassium feldspar, albite, quartz, barite, norsethite, pyrite, gorceixite, apatite, biotite and magnesite (Fig. 3a–d), and are interpreted as forming during middle–late diagenesis. Biotite occurs in a horizontal fracture-fill in association with potassium feldspar (Fig. 3a), interpreted as adularia based on its blocky habit (Deer et al. Reference Dunlop and Ozdemir1963). The minerals such as magnesite commonly extend from the fractures into the matrix (Fig. 3d). Fractures filled with megaquartz, calcite and dolomite are common. Six vitrinite reflectance values were obtained having an average Ro value of 1.81 % (standard deviation = 0.07; n = 5), equating to a maximum heating temperature of ∼230 °C (Barker & Pawlewicz, Reference Barker and Pawlewicz1986). Two VRE values (1.47 and 1.57 %) for bitumen (Fig. 3d) are consistent with a maximum heating temperature of ∼210 °C (Barker & Pawlewicz, Reference Barker and Pawlewicz1986).
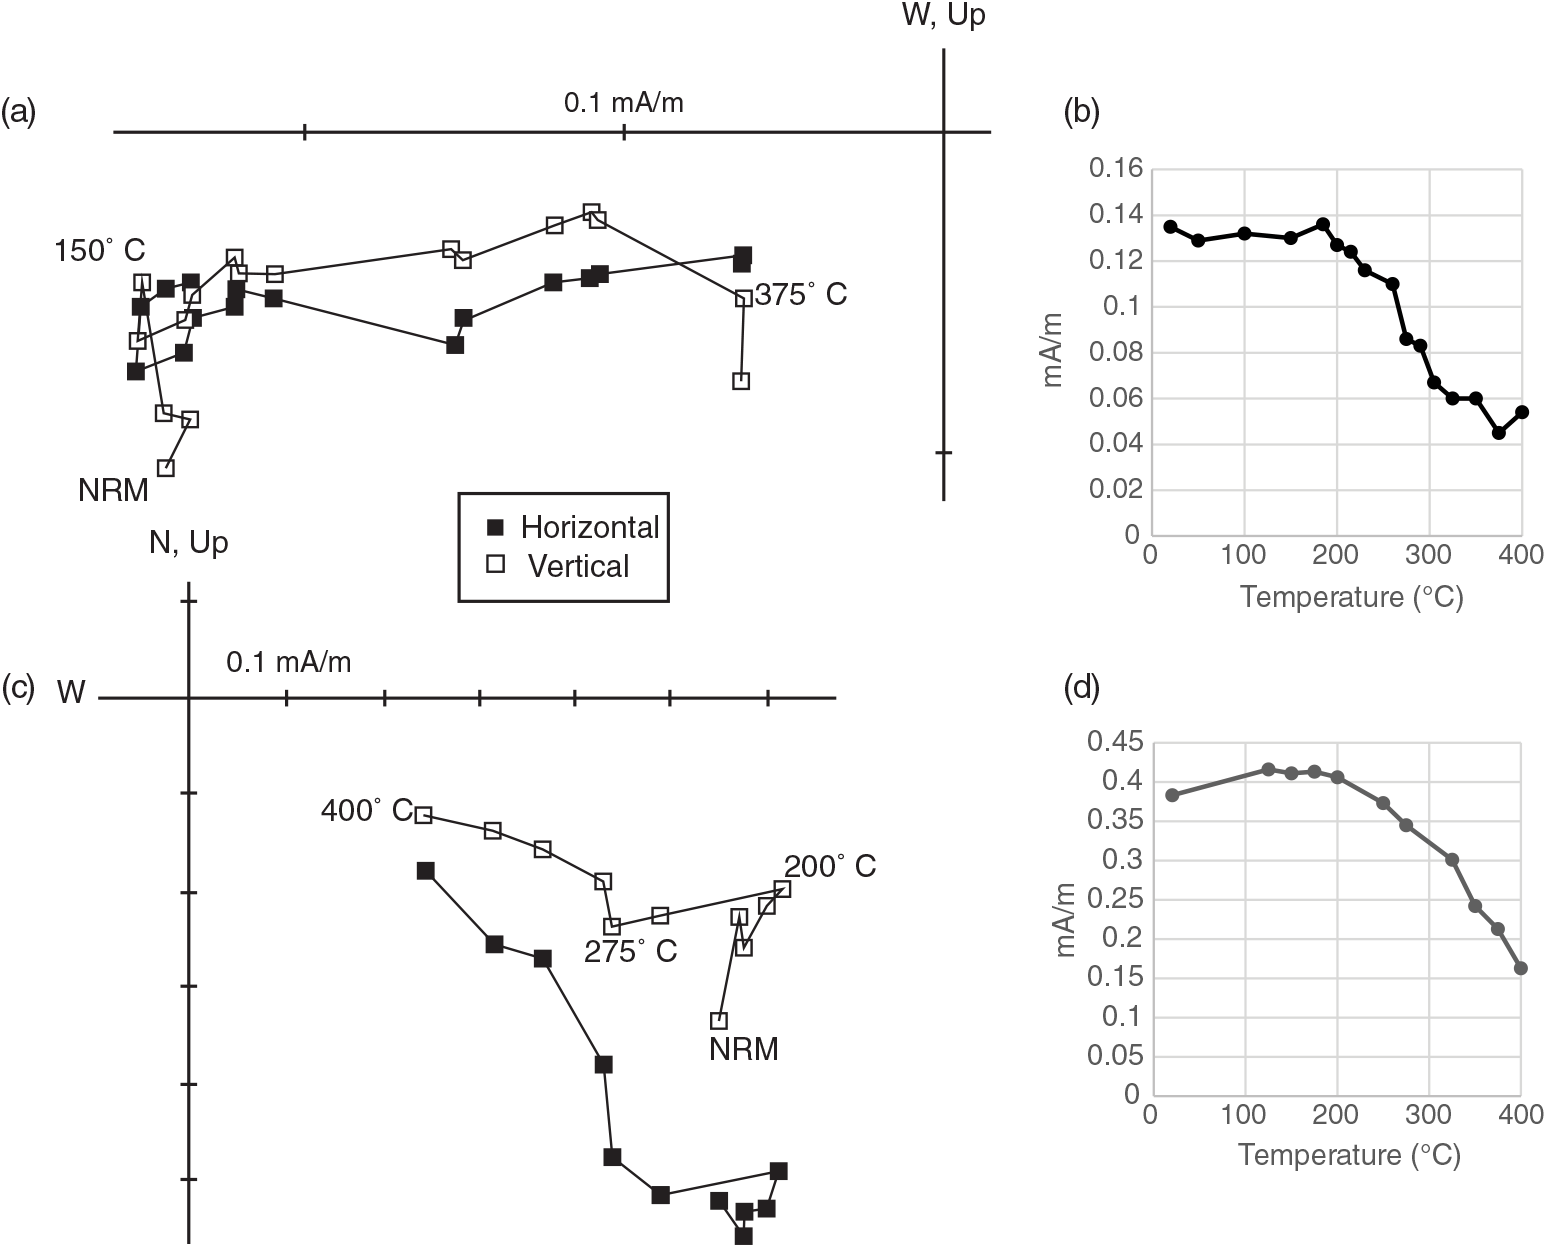
Thermal demagnetization reveals two magnetic components present in Core B. A poorly defined viscous remanent magnetization with a north-northwesterly declination and a moderate-steep down inclination is unblocked at low temperatures (natural remanent magnetization to ∼150 °C; Fig. 4a). At higher temperatures (200 to 400–425 °C), a characteristic remanent magnetization (ChRM) is unblocked with south-southeasterly declinations and shallow inclinations (Fig. 4a–d). Above 400–425 °C the magnetic intensity increases in many specimens, likely due to the creation of magnetite by oxidation of pyrite. The mean ChRM direction from thermal demagnetization is declination (D) 160.5° and inclination (I) 1.1° (Table 1).

Fig. 4. Thermal demagnetization data. (a) Orthogonal plot (in situ directions) of thermal demagnetization for specimen S23 (closed squares – horizontal component; open squares – vertical component). (b) Thermal decay of natural remanent magnetization (NRM) for specimen in (a). (c) Orthogonal plot of thermal demagnetization for specimen S29 (in situ directions). (d) Thermal decay of NRM for specimen in (c).
Table 1. Summary of palaeomagnetic data

Note: N/No – Number of specimens accepted for statistical purposes versus number of specimens demagnetized; Dec – declination; Inc – inclination; α95 – 95 % cone of confidence; k – Fisher’s (Reference Garven, Ge, Person and Sverjensku1953) best estimate of the precision parameter; Lat – latitude; Long – longitude; dp, dm – semiaxes of 95 % cone of confidence of pole. AF under component refers to specimens subjected to alternating field demagnetization in a pilot study.
A preliminary set of specimens was subjected to AF demagnetization, which isolated ChRM from 20–120 mT with southeasterly declinations and moderate down inclinations (D = 154.0°, I = 26.4 °; Table 1). The ChRM isolated by AF demagnetization displays a steeper inclination than the ChRM revealed by thermal demagnetization. This discrepancy probably indicates a partial contamination of the ChRM by a modern component during AF treatment (e.g. McCabe et al. Reference Miceli Romero and Philp1984); therefore, the specimen directions obtained from AF demagnetization were excluded from determining the mean direction.
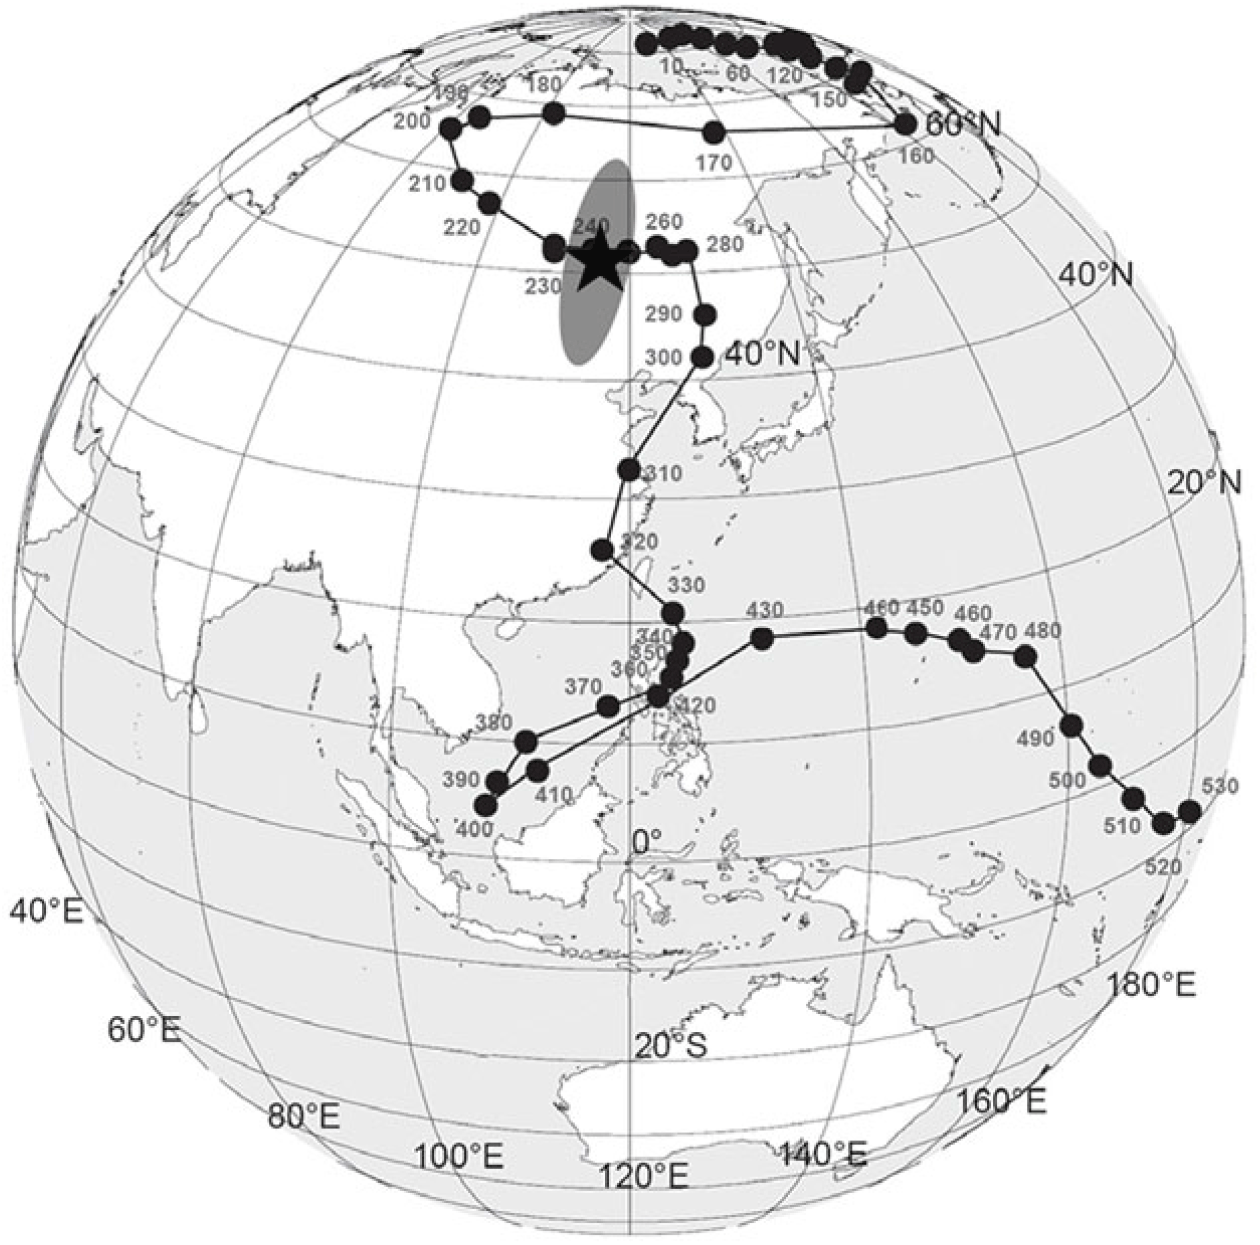
The ChRM is revealed in 24 of the 34 specimens during thermal demagnetization (Fig. 5; Table 1) which span the core and are present in those intervals that are highly altered by mineralized fractures. Of the remaining ten specimens, five contain what is interpreted as the ChRM, but their MAD angles were unacceptable ( > 18°) and five exhibit weak, unstable magnetizations. A virtual geomagnetic pole (VGP) for the mean (in situ) isolated from thermal demagnetization (51.0° N, 115.6° E; Table 1) plots on the apparent polar wander path (APWP) for North America at 245 ± 10 Ma, consistent with a Late Permian age (Fig. 6).

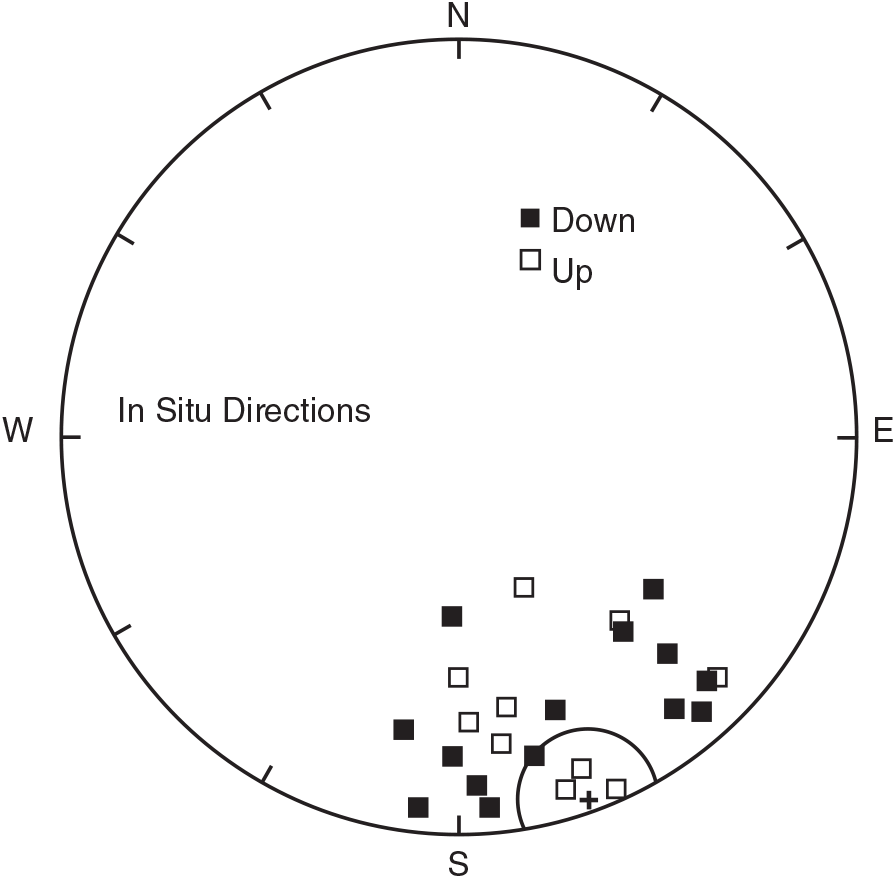
Fig. 5. Equal-area projection of the in situ ChRM specimen directions. The plus symbol is the mean direction and its surrounding circle is the α95 confidence limit. Closed squares – down inclinations; open squares – up inclinations.

Fig. 6. North American APWP (data from Torsvik et al. Reference Torsvik, Van der Voo, Preeden, Niocaill, Steinberger, Doubrovine, Van Hinsbergen, Domeier, Gaina, Tohver, Meert, McCausland, Robin and Cocks2012) with the pole for the ChRM (star) and the 95 % confidence ellipse. The age of the Woodford Shale is Late Devonian – early Mississippian (∼375–360 Ma). The pole for the ChRM intersects the path at 245 ± 10 Ma in the Late Permian. The error is based on the extent of the 95 % ellipse as plotted on the APWP.
The samples have very weak magnetizations. A representative hysteresis loop is slightly wasp-waisted (Fig. 7a–c) and is consistent with a mixed magnetic assemblage or a mixture of grain sizes (e.g. Tauxe et al. Reference Tauxe, Mullender and Pick1996). The Ms value is 3.3e−08 Am2, the Mrs value is 5.91e−09 Am2, the Bc is 13.1 mT and the Bcr is 22.9 mT. The Mr/Mrs and Bc/Bcr ratios are consistent with pseudo single domain (PSD) magnetite. A separation of the loop at high fields is interpreted to indicate thermal drift and pole saturation artefacts.
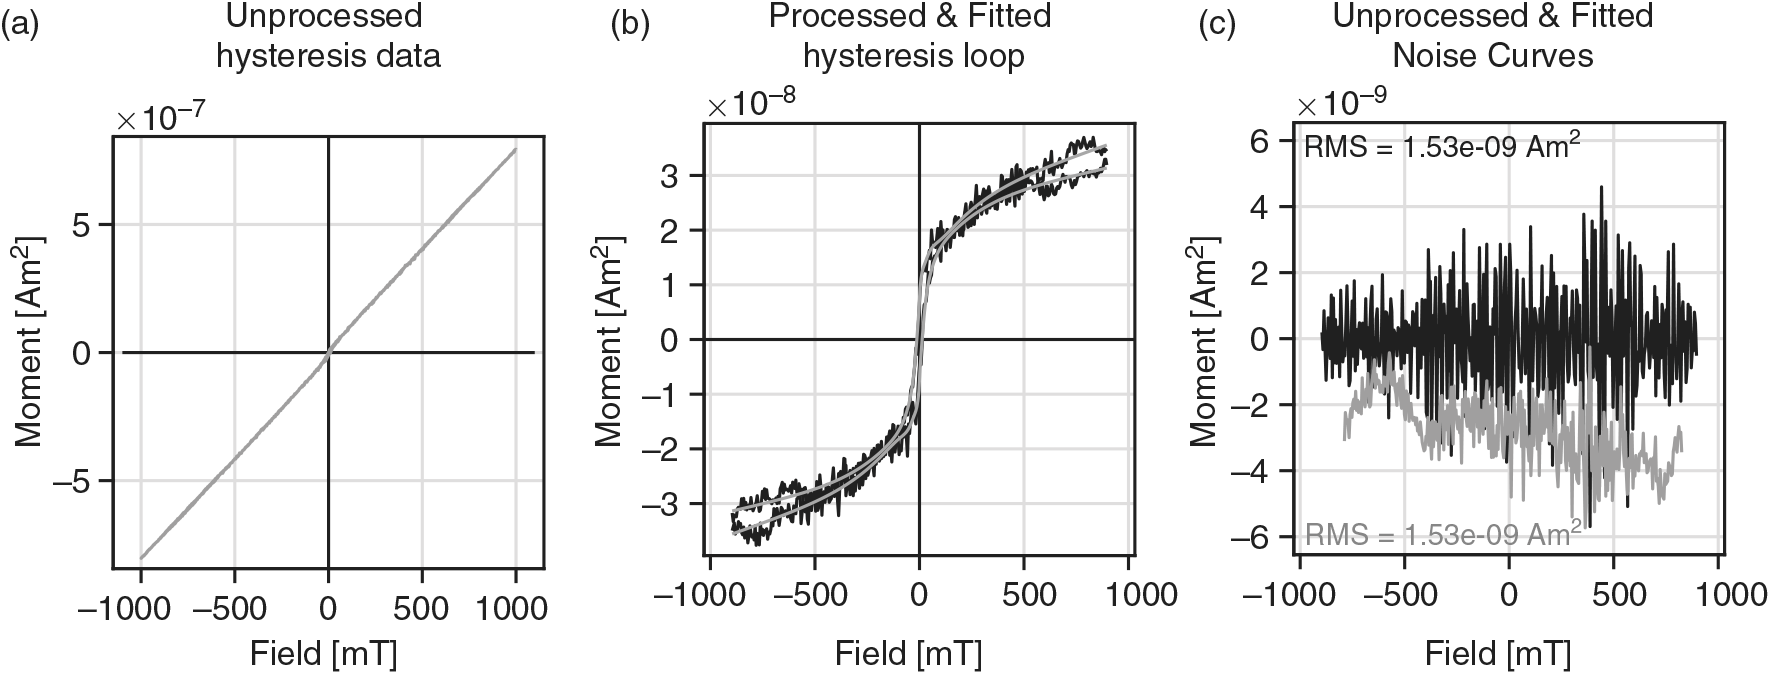
Fig. 7. (a) Representative unprocessed hysteresis loop, (b) processed and fitted hysteresis loop with the paramagnetic slope removed, and (c) the unprocessed (grey) and fitted (black) noise curves. Data processed following Paterson et al. (Reference Paterson, Zhao, Jackson and Heslop2018).
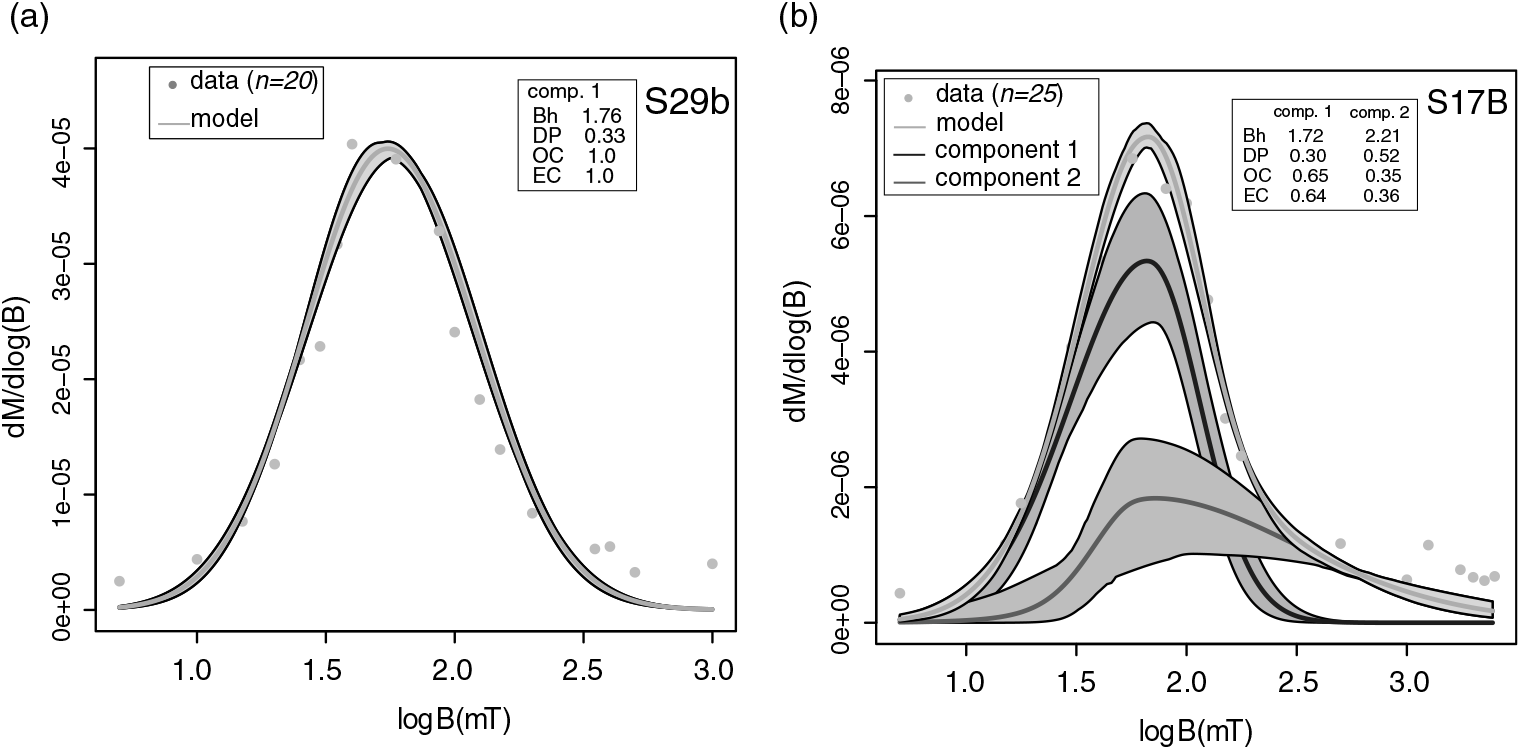
Unmixing of IRM acquisition data can be modelled using one or two components (Fig. 8). Most specimens were modelled with one component with the mean log coercivity (Bh) ranging from 1.75 to 1.84 (Fig. 8a). These results are consistent with ranges for magnetite reported by Egli (Reference Elmore2003). For the two-component modelling, the observed contribution (OC) of component 1 is 0.65 with a Bh of 1.72 (Fig. 8b), consistent with magnetite. The OC for component 2 is 0.35 with a mean Bh of 2.2 (Fig. 8b). Component 2 has a relatively broad coercivity range and probably resides in haematite, although it is not interpreted to carry a stable remanence based on the demagnetization characteristics.

Fig. 8. Representative model fits of coercivity spectrums. Shaded areas represent 95 % error envelopes of the model and the components. Most samples were modelled with one component (a), which is interpreted to be magnetite. A sample modelled with two components is shown in (b). Component 1 likely corresponds to magnetite whereas component 2 represents a higher coercivity mineral such as haematite. Component 2 is not interpreted to carry a remanence based on the demagnetization characteristics. OC – mean observed contribution; EC – estimated contribution; DP – Dispersion parameter; Bh – mean log coercivity.
5. Discussion
Based on unblocking temperatures and the rock magnetic data, the ChRM is interpreted to reside in magnetite. The relatively high temperatures interpreted from the vitrinite and bitumen reflectance data could have exerted an influence on the acquisition of the ChRM. A thermoviscous remagnetization is possible based on the unblocking temperatures (425 °C) and heating temperatures (210–230 °C) for multi-domain magnetite (e.g. Dunlop & Ozdemir, Reference Egli1997, p. 281). The timing of the Late Permian ChRM, however, is not consistent with timing of deformation and uplift, which occurred in late Pennsylvanian time (Granath, Reference Hanor1989). There is no evidence for significant faulting younger than late Pennsylvanian, and the rocks were at relatively shallow depths (< 1066 m) in Late Permian time. Burial heating and uplift would presumably have caused a thermoviscous remagnetization in late Pennsylvanian not Late Permian times. This suggests that a thermoviscous mechanism caused by burial heating is not likely.
The palaeomagnetic evidence indicates there was one major episode of chemical remagnetization. The specimens with the ChRM contain hydrothermal alteration and the magnetite is interpreted to have formed from the hydrothermal fluids. Although magnetite was not observed based on the petrographic studies, it is a common mineral that is found in association with other hydrothermal minerals (Nadoll et al. Reference Nelson, Lenox and Ward2014). The ChRM is interpreted as either a chemical remanent magnetization (CRM) that formed from the chemical growth of magnetite or thermochemical remanent magnetization (TCRM) that formed from a combination of magnetite growth and cooling from the hot fluids (Dunlop & Ozdemir, Reference Egli1997, p. 409).
The difference in timing between the likely time of maximum burial (late Pennsylvanian) and the CRM age (Late Permian) suggests that a burial remagnetization mechanism (e.g. Aubourg et al. Reference Aubourg, Pozzi, Kars, Elmore, Muxworthy, Aldana and Mena2012; Elmore et al. Reference Elmore, Muxworthy, Aldana, Elmore, Muxworthy, Aldana and Mena2012) is not likely. The Woodford Shale in the core is at 1011–1066 m (3100–3500 ft), which would not result in burial temperatures of 210–230°. If maximum burial as well as significant faulting and uplift occurred in Late Permian time, however, then a burial diagenetic mechanism and/or thermoviscous remagnetization is a possibility. There is no evidence for Late Permian uplift, and we conclude that a burial diagenetic mechanism and/or thermoviscous remagnetization are not supported by the geological history and the age of the magnetization. It is possible, however, that the hot fluids may have triggered burial diagenetic processes (e.g. Aubourg et al. Reference Aubourg, Pozzi, Kars, Elmore, Muxworthy, Aldana and Mena2012) such as maturation of organic matter or clay diagenesis in the matrix in Late Permian time, but if this is the case, the CRM or TCRM would still date the migration of hydrothermal fluids.
Numerous minerals in the Woodford Shale suggest alteration by hydrothermal fluids, including magnesite (Shand, Reference Shand2006), norsethite (e.g. Steyn & Watson, Reference Steyn and Watson1967; Bötcher, Reference Bötcher2000), apatite (e.g. Bouzari et al. Reference Bouzari, Hart, Bissig and Barker2016), gorceixite (Migaszewski et al. Reference Milliken, Esch, Reed and Zhang2007), biotite (Wang et al. Reference Wang, Liu, Peng, Liu, Zhao, Li, Wang and Liu2014) and potassium feldspar (Shelton et al. Reference Shelton, Reader, Ross, Viele and Siedeman1986). The abundance of quartz-filled fractures in the core suggests the necessary pressure–temperature conditions were reached to cause the dissolution and precipitation of silica within a hydrothermal system (e.g. Okamoto et al. Reference Okamoto, Saishu, Hirano and Tsuchiya2010). The relatively high Ro and VRE values suggest temperatures of 210–230 °C, which is consistent with at least localized alteration by hydrothermal fluids.
Some of the minerals, such as norsethite (Mrose et al. Reference Nadoll, Angerer, Mauk, French and Walsh1961) and albite (Kastner, Reference Kennedy, Löhr, Fraser and Baruch1971), have been found as authigenic minerals in rocks that are not hydrothermally altered. The abundance of likely hydrothermal minerals and the temperature data (210–230 °C), however, are consistent with the hydrothermal fluid interpretation.
The source for some of the elements in the minerals could have been the basement or from the Woodford Shale. For example, the K in the feldspar and the Mg could have been derived from minerals in the basement. Alternatively, the Mg might have come from dewatering of the shale or the smectite to illite conversion. The Ba and P, however, could also have been derived from the basement, although they could also come from shales. Barite can form relatively early (Zhou et al. Reference Zhou, Rush and Miller2015), produced by bacterial activity in the sediment (e.g. González-Muñoz et al. Reference Granath2003), and then can be remobilized in strongly reducing environments (Hanor, Reference Infante-Paez, Cardona, McCullough and Slatt2000) to form in mineralized fractures. Phosphate can also form during early diagenesis (e.g. Li & Schieber, Reference Marsh and Holland2015). Quartz could have been derived from hydrothermal fluids (e.g. Shelton et al. Reference Shelton, Reader, Ross, Viele and Siedeman1986), biogenic silica (e.g. Milliken & Olson, Reference Milliken and Olson2017), shale dewatering or from silica released during the conversion of smectite to illite (e.g. Land et al. Reference Landis and Castaño1997).
The open versus closed issue has been controversial (e.g. Land et al. Reference Landis and Castaño1997; Bjorlykke & Jahren, Reference Bjorlykke and Jahren2012) and remains an important fundamental issue in shale diagenesis, partly because it relates to reservoir quality. Shales can be open during early diagenesis and can evolve to a closed system during burial (Bjorlykke & Jahren, Reference Bjorlykke and Jahren2012), although migration of hydrothermal fluids into a shale during and after deformation can establish an open system. The results from this study imply that warm hydrothermal fluids entered the shale during late diagenesis. They probably carried some elements that formed the hydrothermal minerals, although they may have leached some elements from the shale.
The Late Permian age for the hydrothermal event in the Woodford Shale is younger than many other fluid-related and burial diagenetic events in the Arbuckle Mountains and north-central Oklahoma, which range in age from late Pennsylvanian to Early Permian (Elmore, Reference Elmore, Haynes, Farzaneh, Anzaldua, Grammer, Gregg, Puckette, Jaiswal, Mazzullo and Pranter2001; Elmore et al. Reference Elmore, London, Bagley and Fruit2018). The timing of alteration in the Woodford Shale is also younger than some Mississippi Valley-type (MVT) mineralization in the Midcontinent, although it is generally consistent with the timing of mineralization in northern Arkansas (Leach et al. Reference Li and Schieber2001). The timing of alteration in the Woodford Shale is generally consistent with the second or third stage of a hypothesized three-stage set of hydrothermal events that affected lower and middle Palaeozoic carbonate units north of the study area in southeastern Kansas, northeastern Oklahoma and southwest Missouri (Goldstein & King, Reference González-Muñoz, Fernandez-Luque, Martinez-Ruiz, Ben Chekroun, Arias, Rodriguez-Gallego and Paytan2014). Stage one altered Ordovician and Mississippian strata, and was inferred to be late Pennsylvanian – Early Permian in age and related to the Ouachita orogeny and gravity-driven flow. Stage two was characterized by precipitation of baroque dolomite in the carbonate units, and was inferred to be Permian in age, of regional extent and affected by Ouachita tectonics. Stage three resulted in calcite precipitation, was more localized and was interpreted to be after the main phase of Ouachita tectonic activity. We note, however, that the study area for the Goldstein and King study was north of the Ardmore Basin, and the nature of the hydrothermal minerals that precipitated was different, suggesting it may have been a different hydrothermal system. Garven et al. (Reference Goldstein and King1993), based on modelling studies, proposed that late Pennsylvanian uplift of the Ouachita Mountains caused gravity-driven flow of fluids to the north. They also pointed out that the flow systems dissipated in Late Permian – Early Triassic times because of erosion of the uplifts.
Several studies conducted in the region also indicate alteration by hydrothermal fluids in Late Permian time. For example, Shelton et al. (Reference Shelton, Reader, Ross, Viele and Siedeman1986) found Ba-rich adularia in the Upper Ordovician Womble Shale in the Ouachita Mountains with a K–Ar date of 262 ± 10 Ma that is associated with post-folding quartz veinlets. Fluid inclusion data yielded a maximum formation temperature of 300 °C. The mechanism proposed for this event was post-folding faulting in the Ouachita Mountains that accessed a reservoir of hot hydrothermal fluids. Elmore et al. (Reference Elmore, Muxworthy, Aldana, Elmore, Muxworthy, Aldana and Mena1993) found alteration by warm fluids with elevated 87Sr/86Sr values in and around fault-related veins mineralized with MVT minerals in the Viola Limestone in the Arbuckle Mountains. Haematite alteration around veins was dated using palaeomagnetic data to the Late Permian.
The Late Permian timing for alteration in the Woodford Shale may have implications for the mechanism of hydrothermal fluid flow since one of the most popular mechanisms, gravity-driven flow from highlands (e.g. Garven et al. Reference Goldstein and King1993), is not likely because of low relief in southern Oklahoma in Late Permian time (Johnson, Reference Kastner1989). Another mechanism, such as fluid flow along Pennsylvanian faults, perhaps reactivated, in Late Permian time, is a possibility. The fact that Core B cuts through a fault ∼600 m (∼2000 ft) above the Woodford Shale and that faulting is common in the study area (Marsh & Holland, Reference Maxbauer, Feinberg and Fox2016) is consistent with this interpretation. The coincidence of three events at about the same age in southern Oklahoma (this study; Shelton et al. Reference Shelton, Reader, Ross, Viele and Siedeman1986; Elmore et al. Reference Elmore, Muxworthy, Aldana, Elmore, Muxworthy, Aldana and Mena1993) are consistent with a similar origin, such as migration of hydrothermal fluids along faults.
6. Conclusions
Numerous minerals found largely in mineralized fractures in a core from the Ardmore Basin (southern Oklahoma), such as norsethite, potassium feldspar, albite, gorceixite, biotite, magnesite and quartz, and in the matrix, suggest that the Woodford Shale has been altered by hydrothermal fluids. The Ro and VRE values yield a maximum temperature of 210–230 °C. Palaeomagnetic results from the oriented core indicate a CRM or TCRM residing in magnetite that formed in Late Permian time. The palaeomagnetic data, significant quantities of hydrothermal minerals and the high thermal maturities suggest that the Woodford Shale was altered by externally derived fluids in Late Permian time. This suggests that the Woodford Shale was an open system in the Late Permian period. The agreement in timing with other studies which report hydrothermal alteration in southern Oklahoma and eastern Arkansas (e.g. Shelton et al. Reference Shelton, Reader, Ross, Viele and Siedeman1986; Elmore et al. Reference Elmore, Muxworthy, Aldana, Elmore, Muxworthy, Aldana and Mena1993) suggest there may have been widespread post-collisional fluid-flow events in late Palaeozoic time in the Midcontinent.
Author ORCIDs
Richard Elmore 0000-0003-0062-6276
Acknowledgements
The authors thank Chesapeake Energy for supplying the core. We thank Brian Cardott for collecting the vitrinite and bitumen reflectance data and Eric Ferré for providing the hysteresis data. The authors thank two anonymous reviewers for helpful suggestions. This research did not receive any specific grant from funding agencies in the public, commercial or not-for-profit sectors.
Declaration of Interest
Jennifer Roberts works for Chesapeake Energy in Oklahoma City. The manuscript was submitted to Chesapeake for approval, which was granted.