Introduction
There are many examples of restricted gene flow due to geographic barriers (e.g. Bossart & Prowell, Reference Bossart and Prowell1998; Storfer et al., Reference Storfer, Murphy, Evans, Goldberg, Robinson, Spear, Dezzani, Delmelle, Vierling and Waits2007) or land clearing resulting in fragments of remnant native habitat in a sea of unsuitable habitat or matrix (Vandergast et al., Reference Vandergast, Bohonak, Weissman and Fisher2007); these are issues of particular importance for species conservation. However, less attention has been given to organisms in agricultural landscapes, which are often patches of different habitat types changing in space and time. The population dynamics (population size, dispersal and stability) of many pest species can be influenced by crop type, growing season, location, pest management strategies, host plant availability and the surrounding geography (e.g. Fuentes-Contreras et al., Reference Fuentes-Contreras, Espinoza, Lavandero and Ramírez2008; Lavandero et al., Reference Lavandero, Miranda, Ramirez and Fuentes-Contreras2009). A greater understanding of the factors influencing population dynamics may improve predictions of population fluctuations and identify potential sources of individuals moving across the landscape (Kennedy & Storer, Reference Kennedy and Storer2000).
The dispersal of pest insects is not necessarily constrained by the boundaries of agricultural growing areas, nor are movements necessarily inhibited as these areas are removed or changed (Schellhorn et al., Reference Schellhorn, Macfadyen, Bianchi, Williams and Zalucki2008). Wild hosts might provide refuge when agricultural hosts are unavailable. Within a cultivated region, populations may also move from crop to crop as alternate hosts become available. For instance, large scale monocultures present ideal environments for many pest species to breed, multiply, and disperse to alternate areas and crops. As such, managing highly mobile pest species at a farm-based and individual crop level does not necessarily make for the best solution, and management may be more effective at larger spatial scales (Schellhorn et al., Reference Schellhorn, Macfadyen, Bianchi, Williams and Zalucki2008).
The complicated nature of changing insect populations in agricultural systems is exhibited by population structuring across small scales, large scales, seasonal changes and temporal changes. For example, in Helicoverpa zea and Helicoverpa virescens (formerly the genus Heliothis), populations spread rapidly through cropping systems in the USA, with prolonged growing seasons, increased field sizes, decreased crop heterogeneity and local wild hosts likely contributors to this spread (Bradley Jr, Reference Bradley, Kim and McPheron1993). In aphids, De Barro et al. (Reference De Barro, Sherratt, Carvalho, Nicol, Iyengar and Maclean1995a) and Wilson et al. (Reference Wilson, Sunnucks, Blackman and Hales2002) showed genetic structuring over relatively small geographic scales of less than 50 km, while Massonnet & Weisser (Reference Massonnet and Weisser2004) showed isolation by distance over larger scales. De Barro et al. (Reference De Barro, Sherratt, Brookes, David and Maclean1995b) and Vorburger (Reference Vorburger2006) found evidence of host races exhibiting high genetic structuring at the beginning of a growing season, and this genetic structuring diminished as the season progressed. Aphid populations collected immediately after winter exhibited seasonal change in genetic structure when compared to populations sampled before or after (Wang et al., Reference Wang, Shen, Gao and Zhang2008). Sunnucks et al. (Reference Sunnucks, DeBarro, Lushai, Maclean and Hales1997) reported that aphids exhibited rapid temporal genetic changes and low variation in population structure between sample sites (indicative of movement and population mixing), and Han & Caprio (Reference Han and Caprio2004) reported temporal genetic change in Helicoverpa virescens. Such studies indicate that agricultural pest insects can be affected very readily by cropping practices, and spatial and temporal factors.
The relationships between population sizes and movements of agricultural pests are quite complex. However, if we can link host crop availability in space and time with information on pest movements, this will give us important context for area wide management of pests and insecticide resistance rather than uncoordinated individual farm efforts. This is especially important due to the population fluctuations through a growing year, with reduced generation time and accelerated population growth during the warmer months in growing areas in Australia (Sutherst, Reference Sutherst2001). One tool to infer dispersal is to use measurements of genetic structure by determining differences or similarities between sampled populations; this is the approach we follow with Bemisia tabaci.
Bemisia tabaci (Hemiptera: Sternorrhyncha: Aleyrodoidea: Aleyrodidea) is a cryptic species complex that contains some of the most significant global agricultural pests (Perring, Reference Perring2001; Simon et al., Reference Simon, Cenis, Demichelis, Rapisarda, Caciagli and Bosco2003; Zhang et al., Reference Zhang, Zhang, Zhang, Wu, Xu and Chu2005; Qiu et al., Reference Qiu, Ren, Mandour and Wen2006a,Reference Qiu, Ren, Wen and Mandourb; Zang et al., Reference Zang, Jiang, Xu, Liu and Zhang2006; De Barro et al., Reference De Barro, Liu, Boykin and Dinsdale2011). The complex has at least 28 distinct species (Dinsdale et al., Reference Dinsdale, Cook, Riginos, Buckley and De Barro2010; De Barro et al., Reference De Barro, Liu, Boykin and Dinsdale2011; Hu et al., Reference Hu, De Barro, Zhao, Wang, Nardi and Liu2011). One, referred to as Middle East – Asia Minor 1 (commonly known as the B biotype or silverleaf whitefly, hereon referred to as MEAM1) is ranked as one of the world's worst invasive species (Global Invasive Species Database, http://www.issg.org/database 8/10/2011). MEAM1 was first discovered to have invaded Australia in 1994 (Gunning et al., Reference Gunning, Byrne, Conde, Connelly, Hergstrom and Devonshire1995) and shares some hosts with the native Australian species, though this native species is readily controlled (De Barro & Driver, Reference De Barro and Driver1997). Infestations have caused considerable production losses (Duffus, Reference Duffus1987, Reference Duffus, Gerling and Mayer1996; Oliveira et al., Reference Oliveira, Henneberry and Anderson2001), with MEAM1 attacking a wide range of agricultural crops, such as cotton, cucurbits, tomato, beans, potato and sunflower. MEAM1 has a short generation time of 2–3 weeks at optimal temperatures (Wang & Tsai, Reference Wang and Tsai1996), high fecundity, and has developed insecticide resistance (Eveleens, Reference Eveleens1983; Dittrich et al., Reference Dittrich, Ernst, Ruesch and Uk1990; Castle, Reference Castle1999). Infestations are exacerbated by suppression of parasitoids and beneficial insects due to the use of broad spectrum insecticides (Eveleens, Reference Eveleens1983) and poor insecticide management (Castle, Reference Castle1999). Adults can occur in high numbers, as large-scale cropping practices provide many ideal host plants. These factors facilitate heavy infestations, which can be problematic for an entire region, as large pest numbers in part of the landscape provide a source for dispersal to other field crops (Oliveira et al., Reference Oliveira, Henneberry and Anderson2001).
Despite numerous integrated control measures (Hirano et al., Reference Hirano, Budiyanto and Winarni1993; Ellsworth et al., Reference Ellsworth, Dennehy and Nichols1996; Palumbo et al., Reference Palumbo, Horowitz and Prabhaker2001), MEAM1 can readily disperse from old crops to populate new areas (Riley & Ciomperlik, Reference Riley and Ciomperlik1997). From previous mark-release-recapture experiments, there is some understanding of the dispersal of MEAM1. Even though there was strong directionality in dispersal of MEAM1 correlated with the direction of prevailing winds (Byrne et al., Reference Byrne, Rathman, Orum and Palumbo1996), Byrne (Reference Byrne1999) showed that populations were not always passively dispersed. Factors that are influential in the dispersal of aphids include small size, short lifespan, large population sizes, and ability for populations to disperse due to flight capacity (Loxdale et al., Reference Loxdale, Hardie, Halbert, Foottit, Kidd and Carter1993) are applicable to B. tabaci, and not easily elucidated with the limitations of mark-release-recapture experiments.
Here, we estimate spatial and temporal genetic structure in MEAM1 with the aim of understanding how this organism interacts with its environment. Specifically, we examine genetic structure of MEAM1 across an agricultural landscape to determine if and how its genetic composition changes between sites and over time. We find evidence for both spatial and temporal structure, but the temporal structure is much greater than spatial structure, suggesting that entire cohorts of pests can occupy a large and variable agricultural landscape but that these cohorts are also quickly replaced.
Methods
Field collection
The Lockyer Valley, Queensland (27°33′31.43″S 152°16′34.26″E) is an area of intense horticultural production, covering 8347 sq km, located 70 km from the urban centre of Brisbane, Australia. The landscape of the catchment combines steep ranges, low undulating hills and wide alluvial plains. The climatic conditions can be characterized as subtropical, with hot humid summers and mild winters (allowing populations to perpetuate in colder months rather than being killed by very low temperatures), resulting in a year long growing season and challenging pest management issues. The majority of vegetable crops are grown under irrigation and several are host to MEAM1. These include plants in the Cucurbitaceae (rock, water, and honeydew melons and pumpkin), Fabaceae (fresh and dried soybeans), Asteraceae (sunflower), Solanaceae (tomatoes, egg plant and zucchini) and Brassicaceae (cabbage). As nymphs and adults feed on the underside of leaves, the physical process in efficiently and effectively reaching individuals adds difficulty for their control. Several species of weeds in the area, both annual (Sonchus oleraceus) and perennials (Lantana camara) are also host plants of MEAM1.
To collect MEAM1 adults, plants were searched at all sites (fig. 1), with sampled plants evenly distributed at distances from 5 m to 30 m, depending on field size. Individuals were removed from leaves from a variety of plant types (table 1) using an aspirator, and stored in 95% ethanol. From each site collection, 27–30 individual females were sorted from males, based on morphological differences, with these diploid (heterozygote) females used for analysis.

Fig. 1. Sampling locations in the Lockyer Valley, QLD. White areas with numbers indicate flat cropping area and sample sites. Shaded area indicates hilly terrain and native vegetation.
Table 1. List of plant types sampled according to site and time (T).
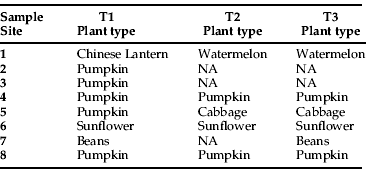
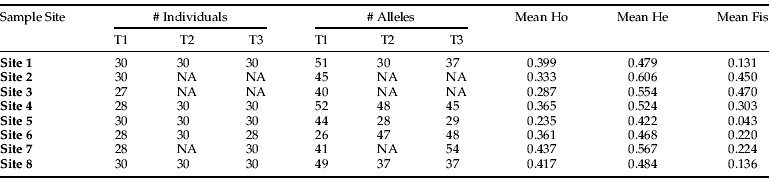
A total of 559 individuals from eight sampling sites were collected over a four-month summer cropping period spanning the end of 2006 to the beginning of 2007. Four of the sites (numbers 3, 5, 6 and 8) were located in the wide alluvial plain, approximately 6 to 25 km between each point (fig. 1). The other four sites were at the base of steep ranges. Sites 1 and 2 were approximately 4 km apart at Mt Sylvia and were separated by steep ranges from sites 4 and 7, which were approximately 4 km apart at Mulgowie (fig. 1). Collections were made at three different times to account for changes in the genetic structure over this period and account for different insect generations to encompass biological meaning. Sites 1 to 8 were sampled during December (time 1), January/February (time 2), and March (time 3). However, in January/February (time 2) at sites 2, 3 and 7, there were no host crops present nearby, so no samples were collected. The same was true in March (time 3) for sites 2 and 3. The lack of host crops was due to drought conditions and fewer than normal plantings. Missing samples (no insects present at these time points) are shown as ‘NA’ in figures and tables. Where samples came from different crops at different times at the same sample site, the geographic location was the same, or directly adjacent.
Molecular methods
DNA was extracted using standard Chelex extractions following Walsh et al. (Reference Walsh, Metzger and Higuchi1991). This method used 20% Chelex and RNase (25 mg ml−1) in TE buffer (10 mM Tris HCl and 1 mM EDTA pH 8.0), using 200 μl amounts per individual extraction. Each individual was initially screened using nine microsatellite loci selected from a larger pool of 33 used in previous studies (De Barro et al., Reference De Barro, Scott, Graham, Lange and Schutze2003; Tsagkarakou & Roditakis, Reference Tsagkarakou and Roditakis2003; Delatte et al., Reference Delatte, David, Granier, Lett, Goldbach, Peterschmitt and Reynaud2006). Initial PCR optimisation was performed by using temperature gradients and altered concentrations of PCR reagents (Bioline Biotaq DNA Polymerase) with products visualized on 5% 37:1 native acrylimide GS2000 gels. After testing and optimisation, nine working microsatellite loci chosen were Bem25, Bem40, Bem6, Bem15, Bem31 (De Barro et al., Reference De Barro, Scott, Graham, Lange and Schutze2003), BTb34, BTb69 (Tsagkarakou & Roditakis, Reference Tsagkarakou and Roditakis2003), 5, 7 (Delatte et al., Reference Delatte, David, Granier, Lett, Goldbach, Peterschmitt and Reynaud2006). However Bem40 was subsequently eliminated after analysis due to null alleles (see Results). Bem6, Bem25 and Bem31 also acted as a species identity check, as, while they amplify the two species of the B. tabaci complex found in eastern Australia, MEAM1 and Australia, their size range for the two species do not overlap; all microsatellites were consistent with the size range for MEAM1.
Samples were then amplified via PCR using an M13 tail protocol as per Schuelke (Reference Schuelke2000) with modified conditions using FAM, HEX and NED fluorescent labels on M13 primers. The optimized PCR conditions (per 10 μl reaction) using Bioline (London, UK) Biotaq DNA Polymerase were, 1μl 10× buffer, 0.6 μl 50 μM magnesium, 0.1 μl 25 mM DNTP, 0.2 μl 10 μM M13 fluorescent tail, 0.1 μl 10 μM forward primer, 0.2 μl 10 μM reverse primer, 0.05 μl 5 ug μl−1 TAQ, 2 μl 5× Q solution (Qiagen), 4.75 μl MQ water, 1 μl template. Thermocycler (BioRad DNA engine, Hercules, CA, USA) conditions were: denaturation for 3 min at 94°C, followed by 35 cycles of denaturing for 30 s at 94°C, annealing for 30 s with a range of between 49°C to 52°C (primer dependent), and extension time of 30 s at 72°C. A final extension for 10 min at 72°C was performed, and the product held for 3 min at 24°C.
Fragments were separated by size on a MegaBACE capillary system (GE Healthcare, Amersham Biosciences, UK) with size standard ET400R. Runs were scored using Fragment Profiler software (Amersham Biosciences) for peak intensity and allele sizes, with intensity indicating allele amplification, and size indicating the different alleles. Each individual was manually checked for errors in scoring.
Null alleles, Hardy-Weinberg equilibrium, heterozygosity and linkage disequilibrium
Null alleles or non-amplifying alleles were determined in Genepop Ver 4.0 (Raymond & Rousset, Reference Raymond and Rousset1995) (100 batches, 5000 iterations per batch) and Microchecker Ver 2.2.3 (Van Oosterhout et al., Reference Van Oosterhout, Hutchinson, Wills and Shipley2004). Microchecker parameters used a 95% confidence interval, maximum expected allele size of 450 bp, and default random generated seed value. Null alleles were excluded from further analyses, as they can falsely add to homozygote excess, altering measures of Hardy-Weinberg equilibrium and heterozygosity.
Allele numbers for each sample site and time point were estimated in Genalex Ver 6.1 (Peakall & Smouse, Reference Peakall and Smouse2006). Deviations from Hardy-Weinberg equilibrium and heterozygosity deficits, both of which were determined in Genalex Ver 6.1 using the HWE test option and the ‘frequency’ option (Peakall & Smouse, Reference Peakall and Smouse2006), were used as an indicator of panmictic or non-panmictic populations. Deviations from Hardy-Weinberg equilibrium and heterozygosity deficits (excess of homozygotes) can be indicative of population inbreeding or selection (non-panmictic populations).
Linkage disequilibrium was determined in Genepop Ver 4.0 (Raymond & Rousset, Reference Raymond and Rousset1995) (100 batches, 5000 iterations per batch). Linkage disequilibrium tests (using the Genotypic ‘linkage disequilibrium’ option) were performed to assess non-random association of the alleles. When testing for differences in populations, the genes should ideally be independent of each other, so genetic differentiation of one gene is not influencing the differentiation of another.
Analyses of molecular variance, Mantel tests and structure
To test for genetic changes over time, we used hierarchical analyses of molecular variance (AMOVA) (Excoffier et al., Reference Excoffier, Smouse and Quattro1992), where we tested the effect of location (sampling site) within sampling time, as well as the effect of sampling time within location. Using this structure, we were able to independently estimate the effects of time, geographic location and differences between individual sampling sites. This analysis was performed in Genalex Ver 6.1 (Peakall & Smouse, Reference Peakall and Smouse2006), giving measures of ΦRT: difference among regions, ΦPR: difference among populations within regions, and ΦPT: difference among all populations. Further analyses were performed by grouping data according to time, e.g. overall data from all sample sites at time 1 were compared to time 2, etc., and similarly pooling data according to geography (e.g. overall data from sample site 1 for the three time points was compared to data at sample site 2 for the three time points, etc.) was investigated. Pairwise comparison of all individual sample sites from all sample times was also estimated (ΦST) with sequential Bonferroni correction.
Simple Mantel tests, investigating the relationship between ΦST and geographic distance, were performed in Genalex Ver 6.1 (Peakall & Smouse, Reference Peakall and Smouse2006) with 999 permutations, after geographic distance was calculated in Genalex Ver 6.1 using X, Y coordinates (latitude and longitude). We also used partial Mantel tests to determine whether time, geography (site/location), or the interaction between time and geography was the influencing factor on the genetic shift, after normalisation of ΦST and distance values. Partial Mantel tests were performed in FSTAT Ver 2.9.3.2 (Goudet, Reference Goudet1995) with 20,000 permutations.
Given the amount of plant material moving in and out of an agricultural area and the vast number of host plant species potentially supporting whiteflies, some mixing among distinct groups is likely. The effective number of populations was estimated using Structure Ver 2.2 (Falush et al., Reference Falush, Stephens and Pritchard2003) using the admixture model with K=1 to 20 (five runs for each value of K), 2,000,000 reps, 100,000 burnin. The admixture model was chosen due to its flexibility and that it would be expected that some fraction of the genome in each population would be inherited from mixed ancestry. Structure analysis was independent of time and geography. Analyses based on ‘structure’ complement AMOVAs and Mantel tests, in that individuals are not assigned to populations; and, therefore, patterns across time and space can be inferred in a heuristic manner, whereas hierarchical AMOVAs and Mantel tests evaluate the specific hypotheses of genetic partitioning by space and time.
Results
Null alleles, Hardy-Weinberg equilibrium, heterozygosity and linkage disequilibrium
A total of eight loci were used in the final analyses after the presence of null alleles attributed to the locus Bem 40 was determined. This locus was shown to contain a null allele when using Genepop Ver 4.0 (Raymond & Rousset, Reference Raymond and Rousset1995), indicated by null allele frequencies >0 for this locus in all populations, but not when using Microchecker Ver 2.2.3 (Van Oosterhout et al., Reference Van Oosterhout, Hutchinson, Wills and Shipley2004). Due to this conflict, it was removed from further analyses. The number of alleles per locus across the sampled populations ranged from 1 to 13.
There were significant departures from Hardy-Weinberg equilibrium expectations (P<0.05), as 61 out of 152 population by locus combinations showed significant deviations after sequential Bonferroni correction. This departure from Hardy-Weinberg equilibrium was reflected in individual sample sites that showed observed heterozygosity deficits across all the sampled time points (with the exception of site 5 at time 3) with total mean observed heterozygosity (0.38) considerably lower than the total mean expected (0.53) (Appendix 1), indicating an excess of homozygotes, corresponding with measures of inbreeding for each sample site (table 2). Four populations by locus comparisons were monomorphic.
Table 2. Data from each sample site and time (T) including the number of individuals, alleles, average observed (Ho) and average expected heterozygosity (He) and average inbreeding coefficient (Fis).

Tests for linkage disequilibria at each sample site for each locus pair across all populations yielded 19 out of 28 combinations with statistical significance (P<0.05) after sequential Bonferroni correction. There are no specific pairs of loci showing linkage disequilibrium. Thus, inbreeding and linkage disequilibria were prevalent across all populations considered.
Analyses of molecular variance, Mantel tests and structure
When comparing sample sites across the three sampled time points, the hierarchical AMOVA showed significant differences according to the sample time (table 3). Further investigation showed a significant difference in the genetic structure of B. tabaci MEAM1 as time progressed over the summer growing season. The genetic structure at time 1 (December) was significantly different to the genetic structure at time 2 (January/February) and time 3 (March), while time 2 (January/February) and time 3 (March) were not significantly different from each other (table 3). The hierarchical AMOVA was also performed, omitting the sites that had data missing, to test if this missing data affected the AMOVA. However, the results obtained did not change the statistical significance. This indicates a strong change in the dominant genetic structure from the start of the season to the end.
Table 3. Hierarchical AMOVA table and corresponding values for ΦRT, difference among regions; ΦPR, difference among populations within regions; and ΦPT, difference among all populations.
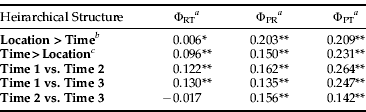
a Statistical significance indicated by asterisks, whereby
* is P≤0.05,
** is P≤0.001.
b Sampling time is nested within location: site 1 (time 1, time 2, time 3), site 2 (time 1), site 3 (time 1), site 4 (time 1, time 2, time 3), site 5 (time 1, time 2, time 3), site 6 (time 1, time 2, time 3), site 7 (time 1, time 3), site 8 (time 1, time 2, time 3).
c Location is nested within sampling time: time 1 (sites 1, 2, 3, 4, 5, 6, 7, 8), time 2 (sites 1, 4, 5, 6, 8), time 3 (sites 1, 4, 5, 6, 7, 8).
When sampling site data was grouped according to geography, the hierarchical AMOVA also indicated significant differences according to sample site location (table 3). Further investigation showed that, when the sites were grouped according to site location and AMOVA was performed between each of the groupings, most were not significantly different from sites at different geographic locations. However, six site comparisons out of 28 were shown to be significantly different after sequential Bonferroni correction (table 4).
Table 4. Pairwise comparisons of sample sites where data from all sampled times grouped according to site.
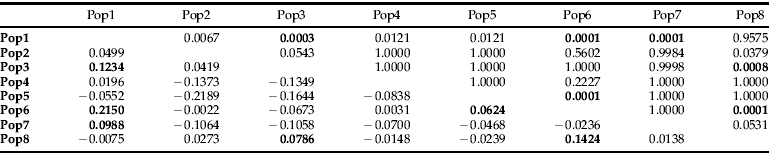
P values above diagonal. ΦRT values below diagonal. P values are raw P values and are bold if they were significant after sequential Bonferroni correction.
Pairwise comparisons between populations also indicated substantial genetic structure, with 130 out of 171 pairwise comparisons significantly different from each other after sequential Bonferroni correction (table 5). AMOVA was performed on host type and reflect differences seen in the AMOVAs, structure analyses, and Mantel tests when these three analyses were performed on time and geography.
Table 5. Pairwise comparisons of all sample sites and times.

P values above diagonal. ΦPT values below diagonal. P values are raw P values and are bold if they were significant after sequential Bonferroni correction.
1 Sample time 1,
2 sample time 2,
3 sample time 3.
Mantel tests indicated that geography was not significant in explaining genetic differentiation (P<0.4). The partial Mantel showed that neither geography (sampling location) nor the interaction between time and geography (both P<0.9) was an explanatory factor in the genetic differentiation. Time alone, however, was found to have a significant effect (P<0.0001, β=0.033, R2=0.092, 20,000 randomisations) on the genetic structure as the growing season progressed.
Results from ‘structure’ revealed two dominant genetic clusters, one early in the summer growing season that was replaced by another as the season progressed (fig. 2). Little additional information was obtained after K=2 with the log likelihood reaching a plateau at this group number (Appendix 2) (Pritchard et al., Reference Pritchard, Stephens and Donnelly2000; Evanno et al., Reference Evanno, Regnaut and Goudet2005). At K=2, the log likelihood was stable across five runs. At time 1 (December), there were two distinct genetic groups present in nearly all populations. However, by time 2 (January/February), one of these original groups had greatly diminished in frequency (with the exception of location 6), and the maintenance of the second group in low frequency persisted through time 3 (March) (fig. 2). These patterns clarify the results from AMOVAs and Mantel tests, where we found that time had a strong effect on structure but that sampling locations sometimes also contributed to population structure.

Fig. 2. Average assignment probability of individuals across time at each sampling location based on ‘structure’ output for K=2.
Discussion
Our results point to a rapid shift in the genetic composition of MEAM1 over a summer growing season of just four months across a relatively small geographic area. We have also shown the existence of two genetic clusters, with the genetic composition changing at sample sites in apparent synchronicity as the season progressed. De Barro (Reference De Barro2005) and Tsagkarakou et al. (Reference Tsagkarakou, Tsigenopoulos, Gorman, Lagnel and Bedford2007) observed structuring and genetic clustering in B. tabaci with the use of microsatellites. Interestingly, De Barro (Reference De Barro2005) showed this structure over a larger geographic scale and Tsagkarakou et al. (Reference Tsagkarakou, Tsigenopoulos, Gorman, Lagnel and Bedford2007) over some small scale comparisons. Our results are striking, as the population structure exhibited in this study was not predominantly spatial; rather, it was predominantly temporal over a short time period.
For MEAM1 in the Lockyer Valley, the shift in genetic composition over time was evident in all analyses. By treating time and location as independent variables in our AMOVA analyses, the greater importance of time over space is apparent. The results from ‘structure’ reveal the particulars of these patterns; across the Lockyer Valley, there was a large shift in genotypes between December and January/February. In some populations, one group of genotypes went extinct; whereas, in other populations, they persisted at low frequencies (and high frequency for location 6) (fig. 2).
Given two distinct sets of genotypes (fig. 2) with many populations containing both, it is not surprising that departures from Hardy-Weinberg expectations under random mating were prevalent along with linkage disequilibria. This particular finding is not uncommon, as previous studies have also found deviations from Hardy-Weinberg equilibria with heterozygote deficits. De Barro (Reference De Barro2005) observed lower heterozygosity among B. tabaci populations sampled within the Asia Pacific region, and Delatte et al. (Reference Delatte, David, Granier, Lett, Goldbach, Peterschmitt and Reynaud2006) found lower heterozygosity within populations in a comparison of MEAM1 and Indian Ocean (referred to as biotype Ms in their study) populations, indicative of a departure from non-random matings. Tsagkarakou et al. (Reference Tsagkarakou, Tsigenopoulos, Gorman, Lagnel and Bedford2007) showed a similar pattern from populations sampled across the island of Crete.
Why and how these two different genetic groups arose is unclear, as is the reason for their shift in frequency over time. The causes may simply be stochastic; for example, at the start of the growing season, two overwintering stocks (either from the Lockyer Valley or from nearby regions) may have expanded greatly in numbers and become admixed locally. Genetic drift as the season progressed may have been the cause for changes in genotype frequencies. Alternatively, we can speculate about potential deterministic explanations, whereby one group had a selective advantage over the other in time points two and three. Such explanations may be related to host preference, farming practice (i.e. insecticides) and/or temperature.
Genotypic differences may be explained by the possibility of host races, perhaps attributed to different crop types. For instance, site 6 was the only site with sunflowers (table 1). However, this seems the least likely explanation, as sites 4, 7, and 8 also had constant host types across the sample period (albeit not sunflowers; table 1), and they showed a rapid change in genotype frequencies. Should host preference be a controlling factor, planned studies of B. tabaci preference for different crops should be straightforward.
Another possibility may be that the two genotypes were influenced by differing resistance to insecticide. For instance, site 6 did not experience insect control measures and appeared to remain dominated by the genotype found at the first sample time point (fig. 2). This site was the only site not using insecticide (as there was low insect pressure). Other sites used insecticide consistently through the growing season. It is, therefore, possible that, at the other sample sites, the initial genetic group existing at the start of the summer season was greatly reduced due to control measures and replaced by a different genetic cluster. If repeated seasonal monitoring shows this pattern of change associated with insecticide use, then control measures should be reassessed, to avoid the promotion of resistant B. tabaci strains. While most farms may be practicing good technique with insecticide use to minimize the risk of resistance build up, a minority practicing poor control may promote resistance.
Another potential cause for two distinct groups may be a predisposition of one genetic group to cooler environments and one more suited to warmer environments. Temperature-adapted groups may present problems for the continued selection of those suited to warm temperatures in greenhouse seedling environments, or indicate that these genotypes suited to warm temperatures are coming from external sources (greenhouses). If this is the case, there needs to be consideration of whether these two genotypes exist from season to season in the landscape, or are reinfesting the landscape from outside sources. However, it appears the second genotype was already present in the population, so these external sources may not be a contributing factor. Repeated sampling over many growing seasons might reveal predictable shits in genotypes associated with temperature and provide clarification.
With predicted climatic change for this region being decreased rainfall and increased temperature (http://www.climatechangeinaustralia.gov.au/qldtemp1.php 8/10/2011), there may be implications for future insecticide resistant genotypes or temperature dependent genotypes. Short-term studies such as these may give insight to potential problems should control measures fail. Crops may be more water stressed, promoting higher numbers of B. tabaci (Flint et al., Reference Flint, Naranjo, Leggett and Henneberry1996). As optimal development occurs in warmer temperatures (Wang & Tsai, Reference Wang and Tsai1996), longer warm periods may also promote increased numbers due to shorter times between generations. Increased numbers and faster turnover of generations may contribute to dispersal and faster development of resistance, creating urgency for development of new pesticides. Where higher atmospheric carbon leads to decreased nutrient levels in plants, insect feeding pressure on crops may increase to obtain necessary nutrients (Drake et al., Reference Drake, GonzalezMeler and Long1997; Coviella & Trumble, Reference Coviella and Trumble1999; Trumble & Butler, Reference Trumble and Butler2009). Finally, there is evidence that phloem feeders may show increased population size and decreased development time (Bezemer & Jones, Reference Bezemer and Jones1998). Given that MEAM1 processes high amounts of phloem (Byrne & Miller, Reference Byrne and Miller1990), its pressure in the landscape may increase.
Understanding the cause and consequences of the rapid shifts in genotypes is likely to influence pest and resistance management decisions. Our results imply that simple measures of population abundance is only part of the story; emerging data on temporal population structure in agricultural systems indicate that morphologically homogeneous groups may contain distinct genetic groups than can change rapidly in abundance. Thus, the dynamic nature of agriculture pest population biology suggests that local pest management strategies will be largely ineffective, but large-scale coordinated efforts are required.
Acknowledgements
P. Prentis, F. Frentiu, C. Lange, N. Sims, D. Shanahan and A. Hulthern for advice and assistance. Access to farms for crop sampling generously provided by B. Tait, Mulgowie Farms, G. Hahn, Pacific Seeds, Qualipac, D. Reck, K. & S. Osborne, T. Kamholtz. This research was funded in part by the Grains Research and Development Corporation, the University of Queensland and CSIRO Ecosystem Sciences. YMB was funded by an Australian Research Council Australian Research Fellowship.
Appendices
Appendix 1. Mean observed (Ho) and expected (He) heterozygosity with standard error (SE) for each sample site and sample time (T).

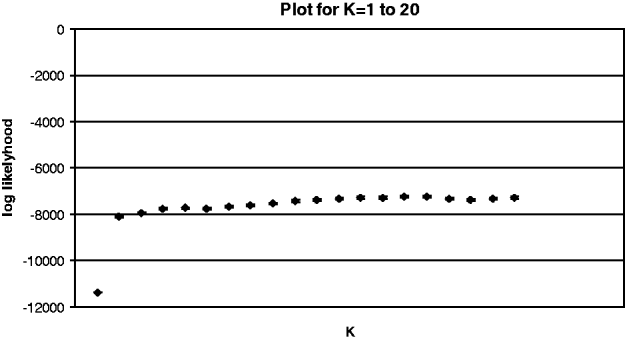
Appendix 2 Log likelihood plot from Structure, for K values of 1–20. Little additional information is gained after K=2. Standard error bars are present, but very small.