Layered silicates such as magadiite (NaSi7O13(OH)3. 4H2O), kenyaite (Na2Si22O41(OH)8.6H2O) and kanemite (NaHSi2O5.3H2O) have recently become the subject of great interest due to their adsorptive and catalytic properties (Alarcón et al., Reference Alarcón, de Villa and de Montes2005; Kalvachev et al., Reference Kalvachev, Kostov, Todorova and Kadinov2006; Park et al., Reference Park, Jung, Se and Kwon2009; Royer et al., Reference Royer, Cardoso, Lima, Macedo and Airoldi2010; Guerra et al., Reference Guerra, Ferrreira, Pereira, Viana and Airoldi2012; Kim et al., Reference Kim, Kim, Seo and Uh.2012; Chen et al., Reference Chen, Yao, Zou and Yan2016). The structure of kenyaite is composed of silica layers and interlayer hydrated cations; each silica layer is built from three silica sheets instead of two, as in the case of magadiite (Wang et al., Reference Wang, Wang and Chang2006). Generally the synthesis of layer silicates (particularly ilerite, magadiite and kenyaite) is achieved by the combination of silica and an alkali source in an aqueous solution under hydrothermal crystallization (autogenous pressure) (Wang et al., Reference Wang, Wang and Chang2006; Kooli et al., Reference Kooli, Mianhui and Plevert2006a). Due to their structural features, the layered silicates can be easily modified using various methods, such as proton exchange or the insertion of cations that are larger than those being exchanged (Shimojima et al., Reference Shimojima, Mochizuki and Kuroda2001; Thiesen et al., Reference Thiesen, Beneke and Lagaly2002). The use of organic cations or molecules or inorganic polyoxocations leads to a structural swelling (Ruiz-Hitzky & Rojo, Reference Ruiz-Hitzky and Rojo1998; Ahn et al., Reference Ahn, Kim and Hahm2008). The intercalated cations may act as pillars between the layers or facilitate exfoliation of the inorganic nanolayers into a polymer network (Wang & Pinnavaia, Reference Wang and Pinnavaia1998; Kwon & Park, Reference Kwon and Park2001; Yukutake et al., Reference Yukutake, Kobayashi, Otsuka and Takahara2010; Ma et al., Reference Ma, Sun, Sun and Zhang.2015).
Unlike magadiite, for which different modification approaches have been reported, few studies have been performed on the use of kenyaite as a starting material. Kalvachev et al. (Reference Kalvachev, Kostov, Todorova and Kadinov2006) described the activity of a cobalt containing kenyaite in complete hexane oxidation. Additionally, after intercalation of the precursor, Co(OH)2, the stability of the host-matrix system was reported. The modification of kenyaite with 3-aminopropyltriethoxysilane created active amine groups attached to the surface of H-kenyaite (Park et al., Reference Park, Jeong and Kwon2004). Alarcón et al. (Reference Alarcón, de Villa and de Montes2005) described a kenyaite modified by tin-containing pillars that was active in nopol synthesis. However, although the catalyst exhibited 94% selectivity to nopol, the conversion of the substrate dropped to approximately 20% after the fourth recycling. In the modification process, the Na-kenyaite was first expanded by surfactant molecules, such as cetyltrimethylammonium cations (C16TMA), at a fixed concentration, and no further details were reported on the effect of the starting concentrations of the organic molecules on the organo-kenyaites and their thermal properties.
The use of layer silicates, such as clay minerals and other low-cost materials, as a removal agent of dye molecules has been reported previously (Sanghi & Verma, Reference Sanghi and Verma2013). However, few studies concerning the removal of dyes in wastewater have been reported using the synthetic layered silicates magadiite and kenyaite (Miyamoto et al., Reference Miyamoto, Kawai and Kuroda2001; Royer et al., Reference Royer, Cardoso, Lima and Ruiz2009, Reference Royer, Cardoso, Lima, Macedo and Airoldi2010; Nunes et al., Reference Nunes, Moura and Prado2011). In the present study, we report the intercalation properties of Na-kenyaite using C16TMA cations at different initial concentrations. The materials were fully characterized using different techniques. The thermal stability of the organo-kenyaites was studied with in situ FTIR and powder XRD techniques. The ability of the materials to remove dyes was investigated for eosin dye. The eosin dye was selected due to its diverse applications in the cotton industry and biological studies (Larson et al., Reference Larson, Ho, Anumolu and Chen2011; Kim et al., Reference Kim, Arul and Han2016). In addition, regeneration tests were performed on one selected organo-kenyaite.
EXPERIMENTAL
Synthesis of Na-kenyaite
The Na-kenyaite was prepared by the dissolution of 4.8 g of NaOH in 105 g of water, followed by the addition of 16 g of fumed silica to the base solution under stirring over the course of a few minutes. The resulting gel was placed into a Teflon-lined stainless-steel autoclave and heated at 170°C for 48 h. The autoclave was cooled, and the solid was filtrated, washed with deionized water and then air-dried at 40°C (Kooli et al., Reference Kooli, Mianhui and Plevert2006a).
The H-kenyaite was prepared by stirring 1 g of Na-kenyaite into a solution of 25 mL of 0.1 N HCl and 25 mL of water for 3 h at room temperature (RT). The product was filtered, washed with water, and then dried at room temperature.
Preparation of organo-kenyaites
Different amounts of C16TMAOH were dissolved into 50 mL of deionized water; then 2 g of Na-kenyaite were added to these solutions, which were stirred overnight at room temperature. The solid materials were collected by filtration, washed with deionized water several times and dried at room temperature. The samples are identified as C16Ken-X, where X represents the loading amount of C16TMA cations in mmoles: C16Ken-0.2 corresponds to an organo-kenyaite with a load of 0.20 mM of C16TMA cations. For terms of comparison, organo-kenyaite was prepared from H-kenyaite at an initial C16TMA loading concentration of 0.40 mM. The sample was denoted as C16-HKen-0.40.
Dye-removal properties
The ability of Na-kenyaite and its organo-derivatives to remove dyes was studied in a batch process, as reported in a previous study (Al-Faze & Kooli, Reference Al-Faze and Kooli2014). Approximately 0.1 g of Na-kenyaite or organo-kenyaite was mixed with 10 mL of eosin solution of different initial concentrations in sealed tubes. The mixture was allowed to equilibrate in a water bath shaker at 25°C at natural pH. The equilibrium dye concentration was measured using a Varian spectrophotometer at a wavelength of 610 nm. The effect of calcined organo-kenyaite at different temperatures on the removal of eosin dye was also investigated.
Regeneration of spent organo-kenyaite
The sulfate radical-based oxidation method was applied, as described in a previous study (Kooli et al., Reference Kooli, Liu, Al-Faze and Al Suhaimi2015). It consists of using oxone and homogeneous Co2+ ions as the oxidant and the catalyst, respectively. The organo-kenyaite used was dispersed into a Co(NO3)2.6H2O aqueous solution; then an amount of oxone was added and the mixture was stirred for 10 min. The solid was separated by centrifugation, washed five to six times with water and then reused for the next run.
CHARACTERIZATION
The powder XRD patterns of Na-kenyaite and organo-derivatives were collected with a Bruker Advance 8 diffractometer (Ni-filtered Cu-Kα radiation). The C, N and H contents in the modified samples were estimated by a EURO EA CHN elemental analyzer. Thermogravimetric analyses (TGA) were performed using a calorimeter (TA Instruments, model SDT2960). The measurements were performed in the temperature range 25–800°C at an air flow of 100 mL min−1 and a heating rate of 5°C min−1. Solid-state NMR experiments were performed on a Bruker 400 spectrometer operating at a 29Si NMR frequency of 78 MHz. A 4-mm magic-angle spinning (MAS) probe head was used with sample-rotation rates of 4.0 kHz for the 29Si NMR experiments. Between 80 and 100 scans were accumulated with the recycle delay of 200 s. The 29Si chemical shift was reported with respect to tetramethylsilane (TMS). 1H – 13C cross-polarization solid-state NMR spectra (1H – 13C CP/MAS) were acquired with a Bruker Avance DSX400 spectrometer operating at 400.16 MHz for 1H and 100.56 MHz for 13C with an MAS triple resonance probe using 4-mm diameter zirconia rotors. The spinning rate was 4.0 kHz, the 1H π/2 pulse length was 4.40 μs and the pulse delay was 10.0 s. 13C chemical shifts were quoted in ppm with respect to TMS. The change in morphology of the products and EDX analysis were examined by scanning electron microscopy (SEM) using a JEOL model JSM-6700 F. In situ high-temperature powder XRD patterns were obtained by heating the samples from room temperature to 425°C using an Anton Parr heating stage, model KT450, under air atmosphere. In situ diffuse reflectance infrared Fourier Transform (DRIFT) spectra were obtained using a BIORAD Excalibur spectrometer at various temperatures under nitrogen atmosphere. The spectra were collected over the range 3500–700 cm−1, with a resolution of 4 cm−1; each spectrum was the average of 128 scans.
RESULTS AND DISCUSSION
CHN analysis
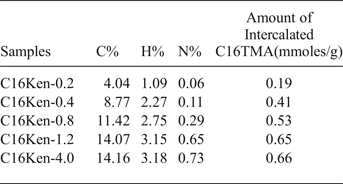
The CHN analysis data of the different organo-kenyaites are reported in Table 1. The amount of C in the organo-kenyaites increased with increasing initial loading of C16TMAOH in the solution used, and reached a plateau of 0.66 mmoles/g. No further increase in the amount of C16TMA adsorbed was observed at loading concentrations >1.20 mmoles. The uptake of C16TMA was lower than the theoretical cation exchange capacity of 0.71 mmoles/g. The adsorption of long–chain quaternary amines on the aluminosilicate layers involves at least three types of reaction: first cation exchange reaction (CEC), secondly adsorption of ion-pairs, and thirdly chain–chain interactions (Zhu et al., Reference Zhu, He, Guo, Yang and Xie2003). However, in the present case, the amount adsorbed was lower or close to the CEC and might proceed only via the cation exchange reaction, similar to organo-magadiite materials (Kooli & Yan, Reference Kooli and Yan2009).
Table 1. CHN elemental analysis of organo-kenyaite prepared with various initial C16TMAOH loading solutions.
The stability of a selected organo-kenyaite (C16Ken-0.8) was investigated in various solutions. After 5 days of contact with water, a total of 1% of the C was leached, revealing a stable structure of organo-kenyaite in aqueous media. A similar observation was made when the C16Ken-0.8 was in contact with NaOH solution. However, a dramatic decrease in the C content was observed when C16Ken-0.8 was mixed with an acidic solution (HCl), indicating a possible exchange of C16TMA cations by protons, which might stand as evidence that the cation exchange was the leading mean of intercalation. Similar data were obtained for organo-magadiites (Kwon & Park, Reference Kwon and Park2001; Kooli & Yan, Reference Kooli and Yan2009).
Powder XRD data
The powder XRD pattern confirmed that the material obtained was pure Na-kenyaite with 00l characteristic reflections at 1.96 and 0.98 nm (Fig. 1), in agreement with previous work (Feng et al., Reference Feng and Balkus2003; Park et al., Reference Park, Jeong and Kwon2004; Kooli et al., Reference Kooli, Mianhui and Plevert2006a). After the reaction with the C16TMAOH solution with an initial concentration of 0.20 mmole, the resulting C16Ken-0.2 exhibited two phases, at 3.50 nm and 1.96 nm, corresponding to an intercalated and a non-intercalated phase, respectively (Mochizuki & Kuroda, Reference Mochizuki and Kuroda.2006), the latter resulting from partial exchange of Na cations with C16TMA. With increasing loading concentration, the intensity of the phase at 3.50 nm increased significantly, and the phase at 1.96 nm decreased dramatically. The latter phase was detected even when a higher C16TMAOH initial concentration was used (sample C16-Ken-4), indicating that the complete exchange of Na+ with C16TMA cations did not occur. This was confirmed by CHN analysis, which showed that 90% of CEC was achieved. The in situ XRD studies indicated that this phase disappeared after treatment of the organo-kenyaite at 50°C. When H-kenyaite was used to prepare the organo-kenyaite (i.e. the reflection at 1.96 mm was absent) the XRD pattern exhibited only one phase at 3.51 nm along with higher-order 00l reflections (Fig. 1).
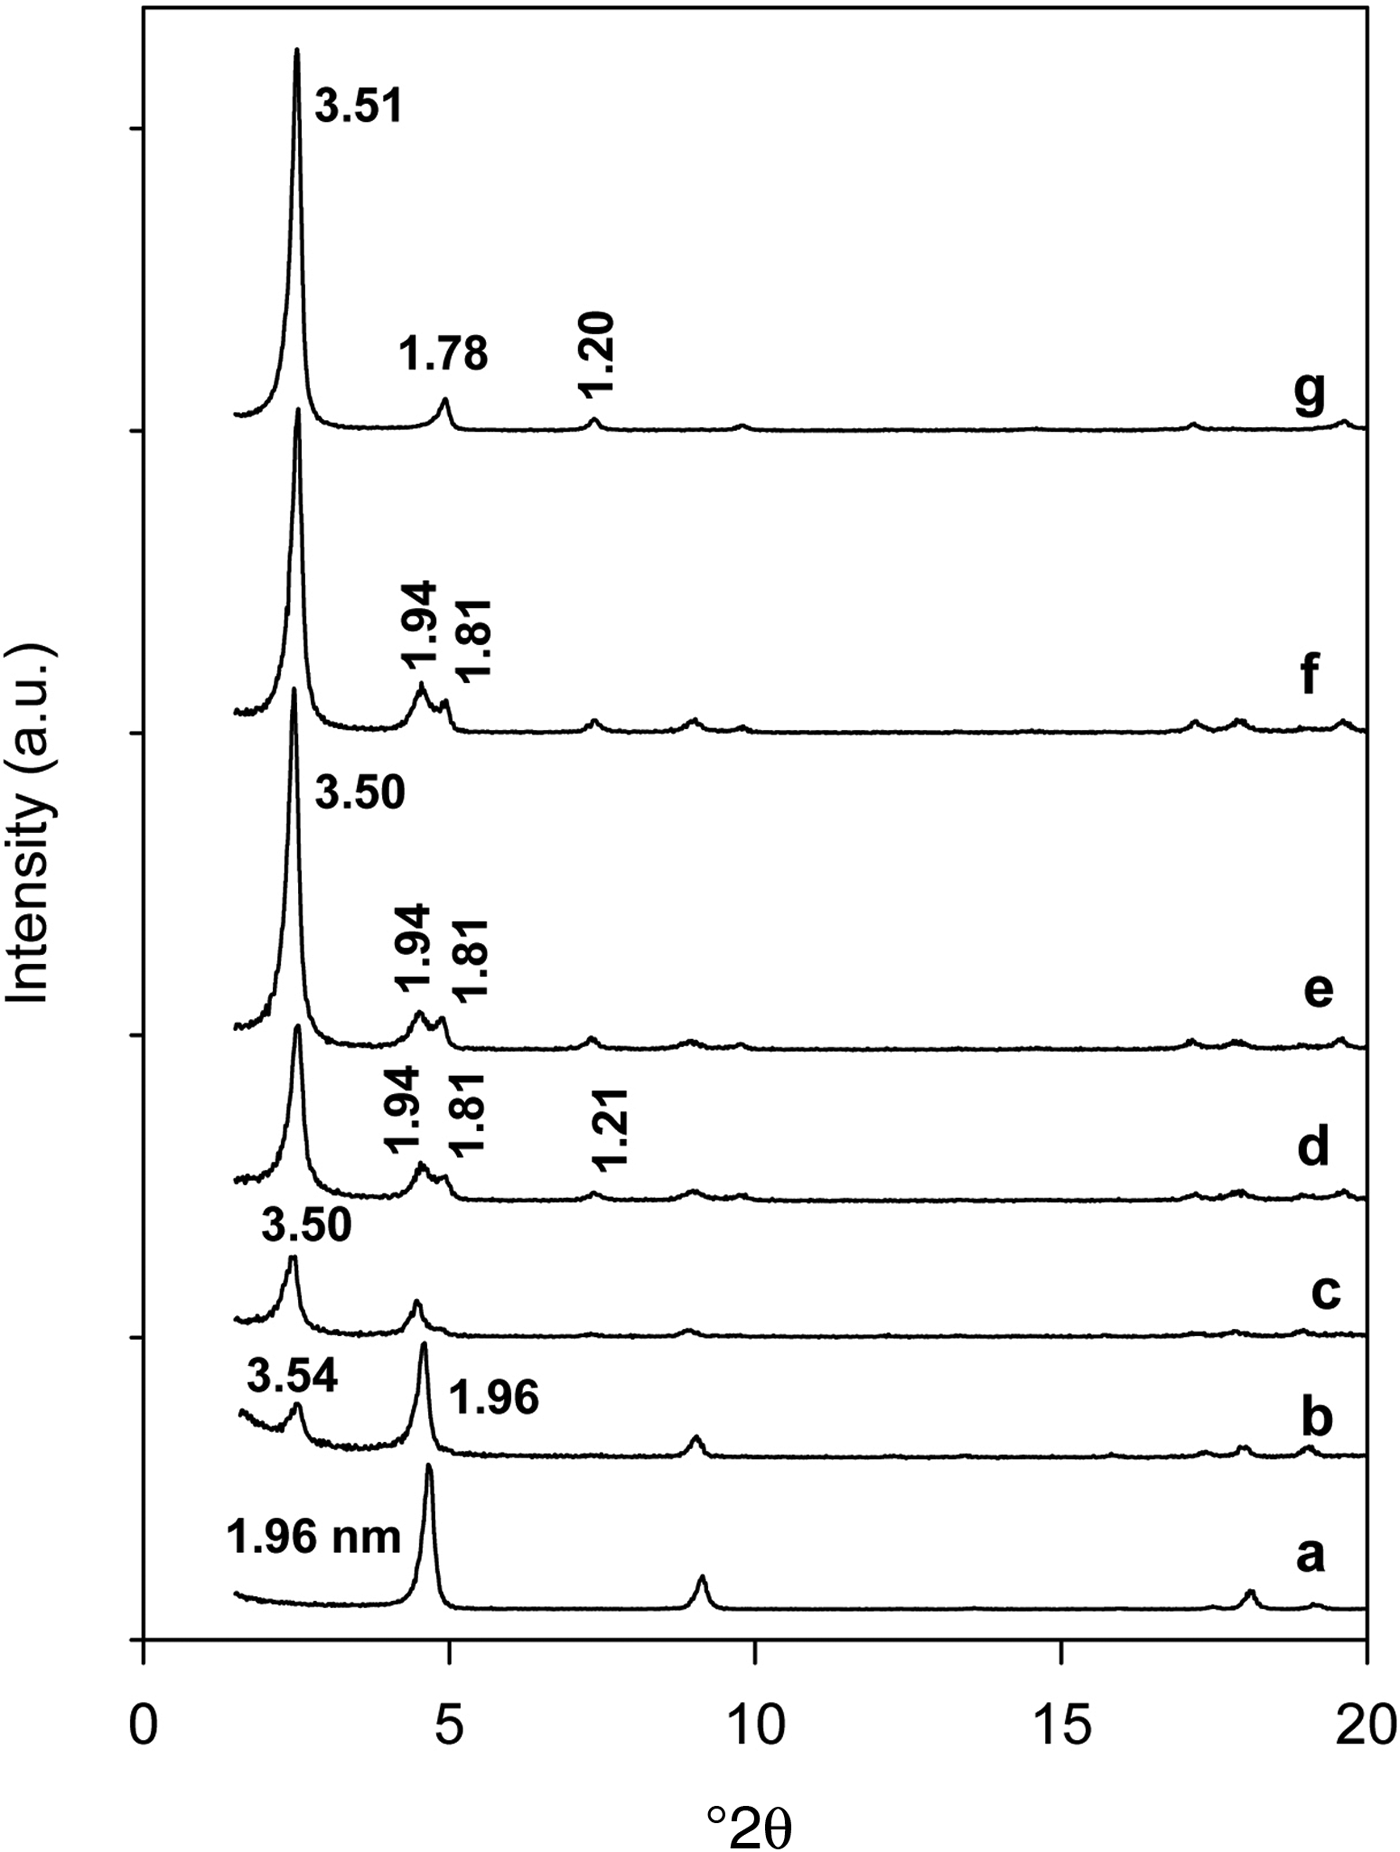
Fig. 1. Powder XRD patterns of Na-kenyaite (a) exchanged with various C16TMAOH concentrations (b) 0.20 mM, (c) 0.40 mM, (d) 0.80 mM, (e) 1.2 mM, and (f) 4.0 mM. (g) Protonated kenyaite (H-kenyaite) exchanged with C16TMAOH solution.
The ion-exchange properties of C16Ken-0.8 were confirmed by powder XRD. The intercalated C16TMA cations were difficult to exchange with Na cations when a suspension of organo-kenyaite was treated with the NaOH solution. The XRD pattern showed no variation in the position of the 3.42 nm diffraction line (Fig. 2). This was not the case when the suspension was treated with the HCl solution, whereby the XRD data indicated a decrease of the basal spacing from 3.51 nm to 1.61 nm (Fig. 2), close to that reported for H-kenyaite (Beneke & Lagaly, Reference Beneke and Lagaly1983). These data indicated an exchange of C16TMA cations by protons.
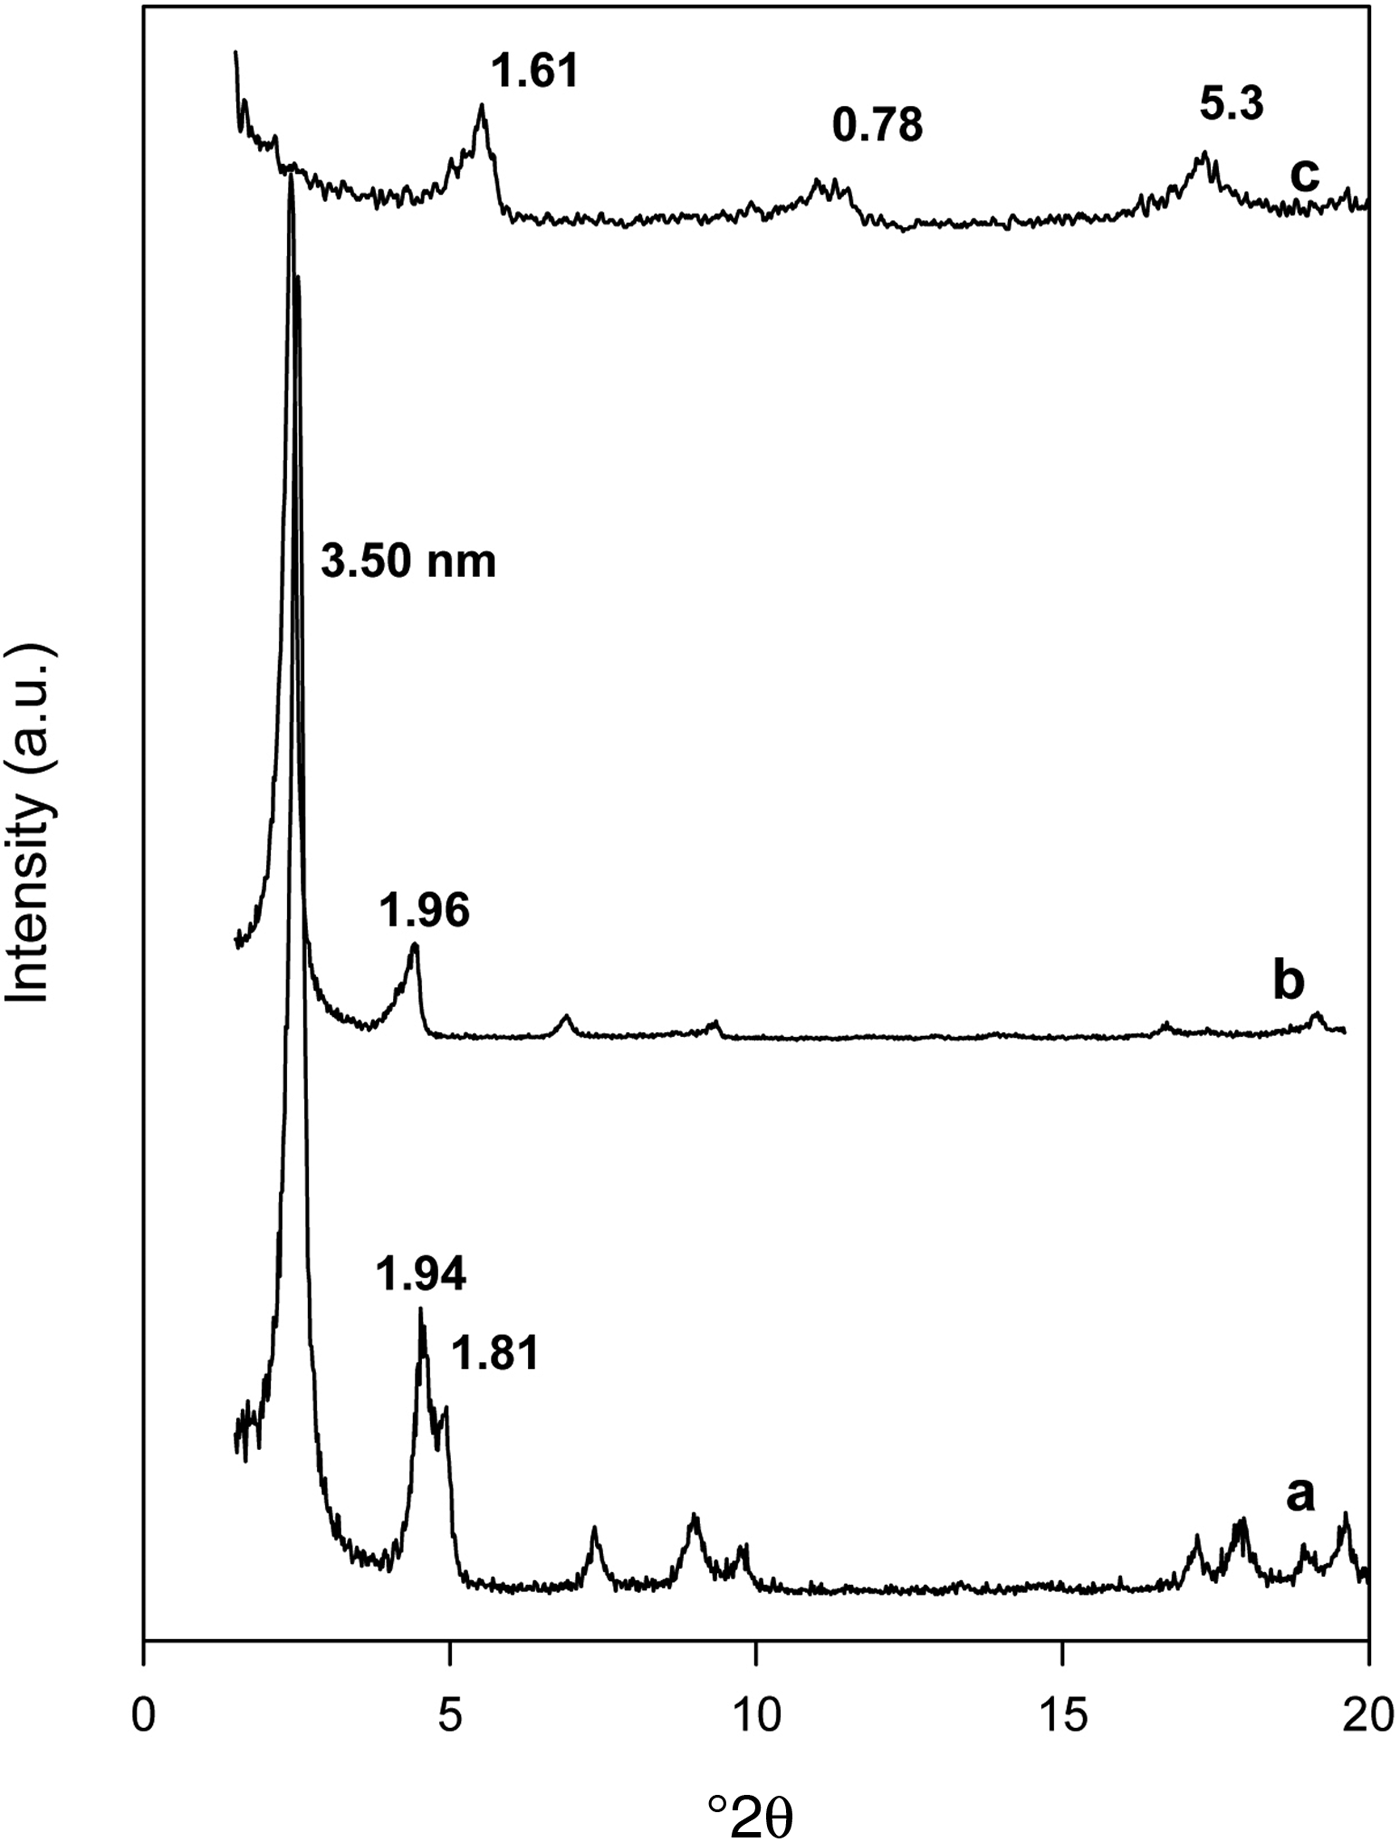
Fig. 2. Powder XRD patterns of (a) organo-kenyaite (C16Ken-0.8) and kenyaite exchanged with (b) NaOH and (c) HCl solutions.
The C16TMA cations exhibit a length of 2.2–2.5 nm, depending on the proposed model to estimate these values (Slade & Gates, Reference Slade and Gates2004; Venkataraman & Vasudevan, Reference Venkataraman and Vasudevan2001; Gavrilko et al., Reference Gavrilko, Puchkovska, Styopkin, Bezrodna, Baran and Drozd2013). The basal spacing of 3.50 nm corresponds to an interlayer space close to 1.88 nm (deduced from the subtraction of 3.50 nm and the basal spacing of dehydrated kenyaite at 1.62 nm). This value was smaller than the length of C16TMA cations reported above (with all the methyl groups in trans position), and it would not correspond to a paraffin-like monolayer arrangement. A tilt of the organic cations to the silicate layer with an angle of 42° was proposed instead.
29Si solid-state NMR
The 29Si MAS NMR spectra of the Na-kenyaite and selected organo-kenyaites are shown in Fig. 3. The Na-kenyaite exhibited one main resonance peak at −99.5 ppm and overlapping broad peaks at −107.7 and −112.7 ppm. The first resonance at −99.5 ppm corresponds to Si in the Q3 environment, while the broad peaks in the range of −107 to −113 ppm were assigned to Si in the Q4 environment (Yanagisawa et al., Reference Yanagisawa, Harayama, Kuroda and Kato1990). The 29Si MAS NMR spectrum of organo-kenyaite (C16Ken-0.8) exhibited similar features to the original Na-kenyaite, with a sharp band in the region −107 to −113 ppm, which indicated that the structure of Na-kenyaite was not altered during the exchange reaction, even for higher loading concentrations of 0.12 mmoles (C16Ken-1.2). The sharpness of the Si peaks in the Q4 environment might indicate dissolution of an amorphous phase that was not detected by XRD.
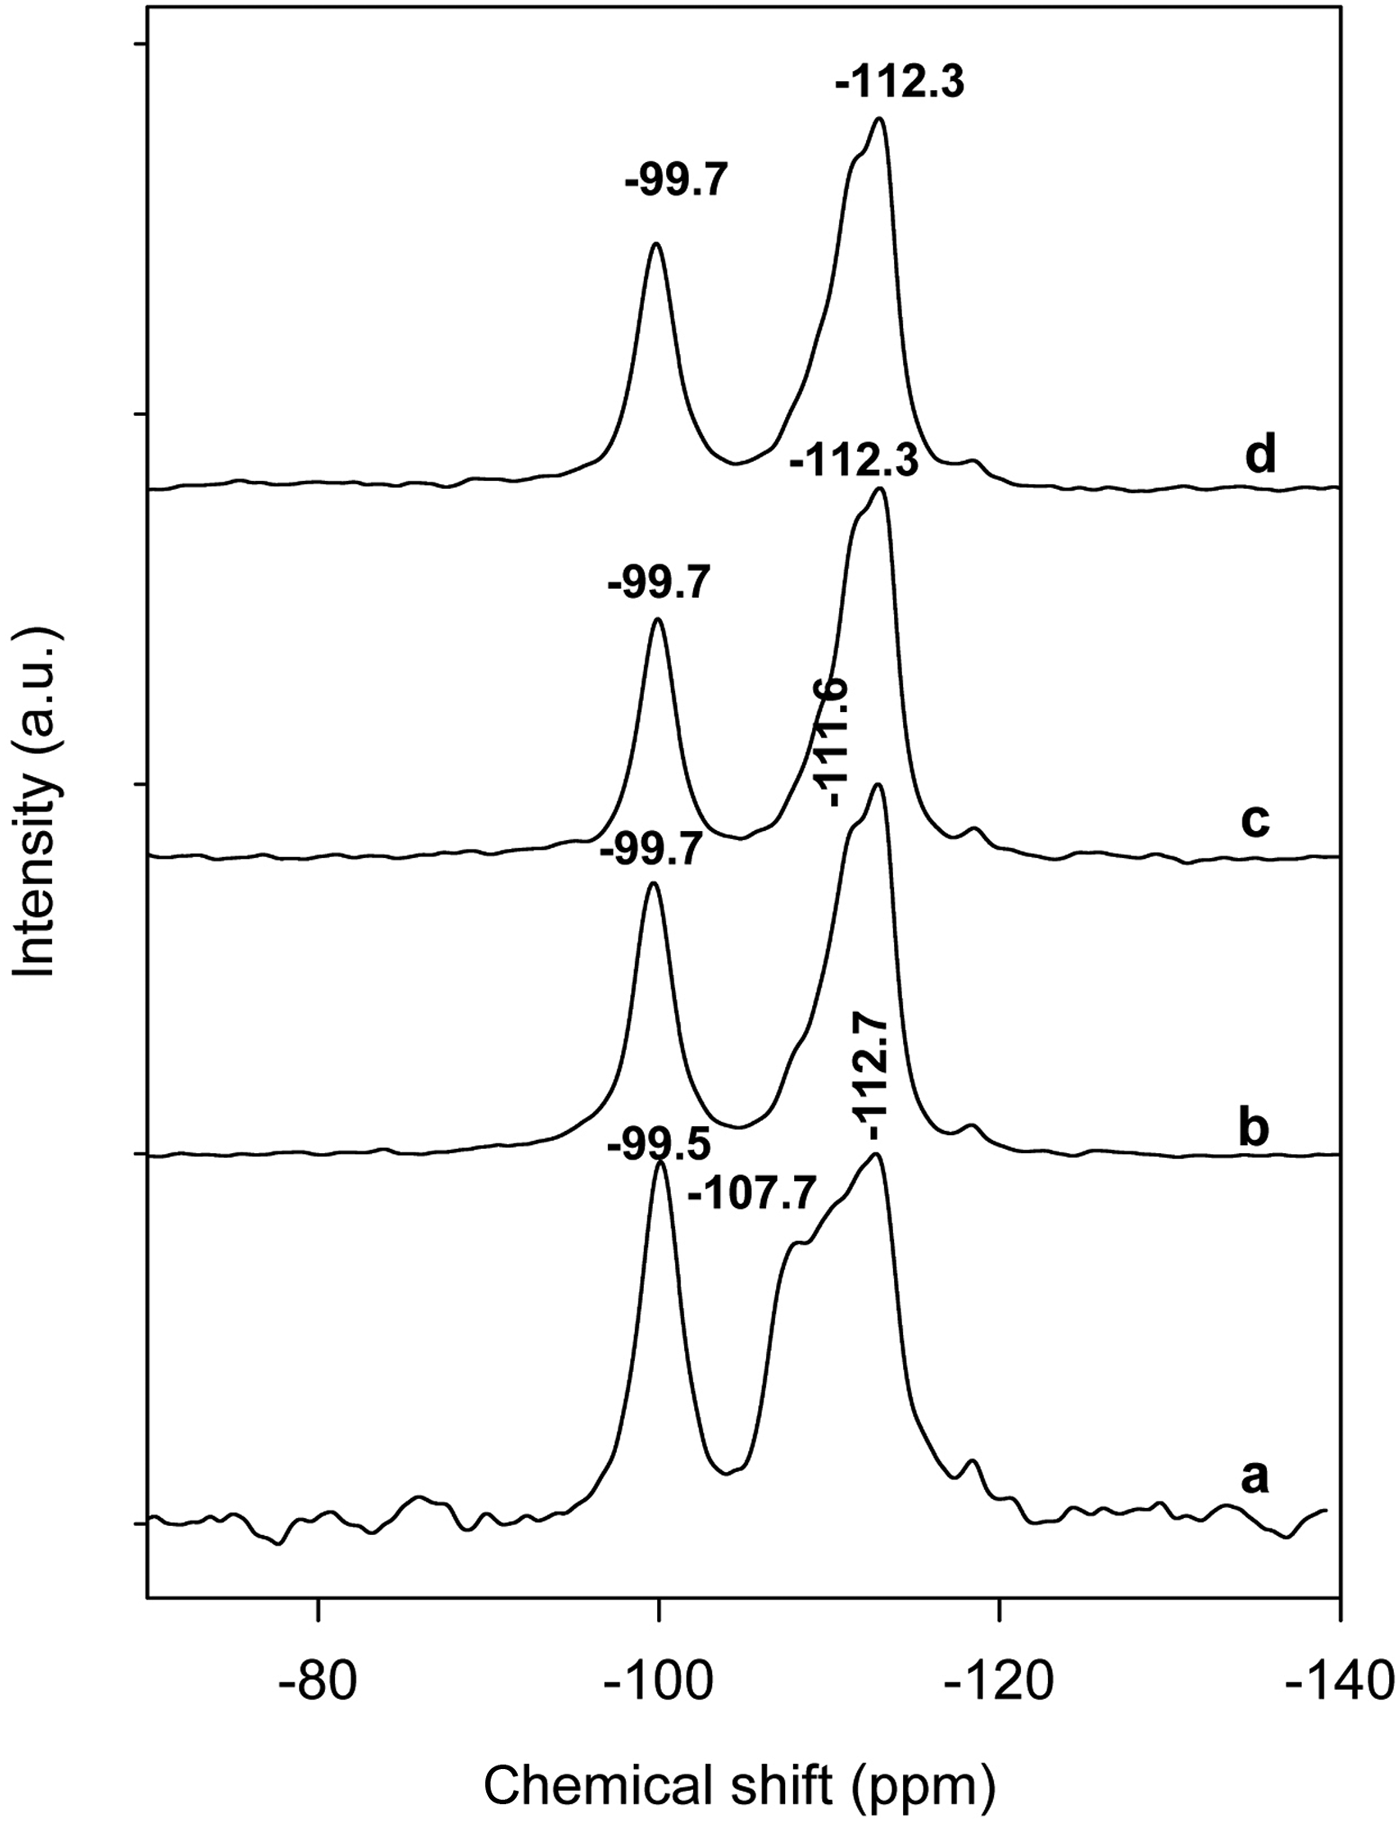
Fig. 3. 29Si MAS NMR spectra of Na-kenyaite before (a) and after reaction with C16TMAOH solution at various concentrations of: (b) 0.20 mM, (c) 0.40 mM and (d) 0.80 mM.
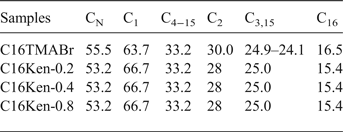
Nuclear magnetic resonance has been proven to be one of the most powerful techniques for probing the structure and conformation of the intercalated organic molecules (Kubies et al., Reference Kubies, Jerome and Grandjean2002; He et al., Reference He, Frost, Deng, Zhu, Wen and Yuan2004). The 13C CP/MAS spectrum of the solid C16TMABr was characterized by a main signal at 32.7 ppm (assigned to C4–C13), indicating that the trans conformation of the CH2 groups was dominant, with a shoulder at 30 ppm associated with a minor degree of the gauche conformation (Kooli et al., Reference Kooli, Mianhui, Alshahateet, Chen and Yinghuai2006b). The peaks at 63.7 ppm and 55.5 ppm were assigned to C1 and the methyl groups bonded to N (CN), respectively. The full assignments of the other peaks are shown in Table 2. The 13C CP\MAS spectrum of C16TMA-kenyaite with lower C16TMA content (C16Ken-0.2) exhibited one resolved resonance peak at 33.2 ppm, arising from the all trans conformation of C16TMA cations, with an embedded shoulder at 30.0 ppm that is related to a minor contribution of the gauche conformation. In addition to the C4–C13 resonance, the peaks at C1, C15 and C16 provided useful information about the ordering conformation and the local environment of the intercalated surfactants. The CN (53.2 ppm) and C1 (66.7 ppm) resonance peaks of the intercalated cations were more intense than those of the crystalline C16TMABr, while the sharp C16 resonance peak (15.4 ppm) has a greater intensity in the crystalline C16TMABr (Kooli et al., Reference Kooli, Mianhui, Alshahateet, Chen and Yinghuai2006b). This fact reflected the difference in the mobility of these carbon atoms and the breadth of the peaks indicated that the C16TMA cation mobility was reduced between the silicate sheets. Another reason for the shift in the CN peak might be the changes in electrostatic interactions between the cationic ‘heads’ of C16TMA and the negatively charged sites on the silicate layers. The present results are in agreement with previous work on C16TMA cations intercalated between other layer silicates such as magadiite or montmorillonite (Kooli et al., Reference Kooli, Mianhui, Alshahateet, Chen and Yinghuai2006b, Reference Kooli2014). With increasing C16TMA content in the organo-kenyaites (C16Ken-1.2), similar spectra were obtained (Fig. 4), indicating that the intercalated C16TMA cations adopted a similar conformation between the kenyaite layers, and thus confirmed the PXRD data.
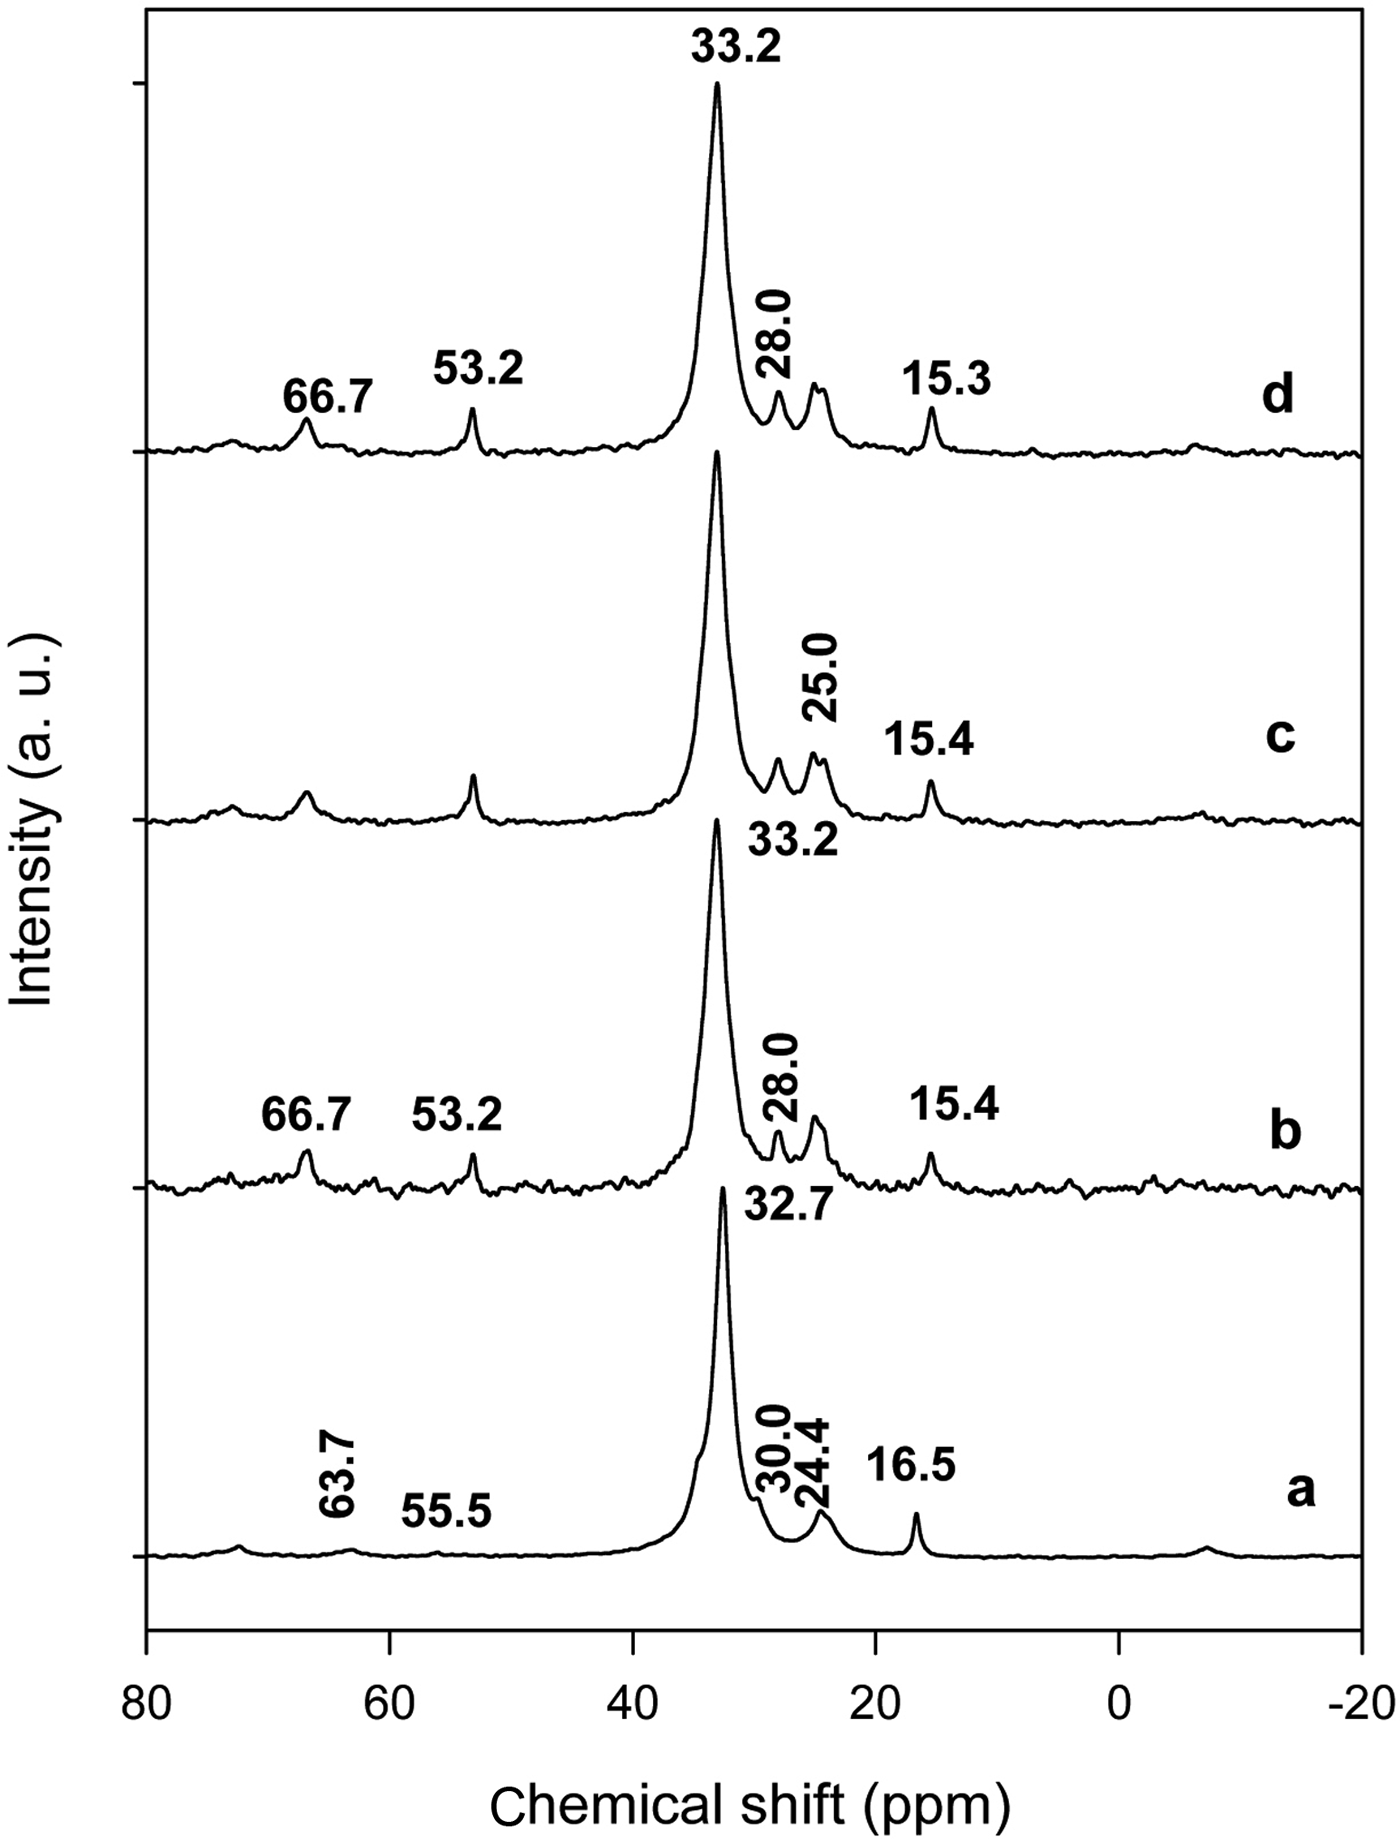
Fig. 4. 13C CP MAS of (a) pure C16TMAbr salt, and organo-kenyaites exchanged with C16TMAOH solution at various concentrations of: (b) 0.20 mM, (c) 0.40 mM and (d) 0.80 mM.
Table 2. Solid 13C CP/NMR assignments of solid C16TMABr and the organo-kenyaite samples.
SEM images
Na-kenyaite crystals exhibited a hexagonal platy morphology with crystals of various sizes. Locally, lamellar domains were observed (Supplementary information S1). After reaction with C16TMAOH, the platy morphology was preserved for low contents of C16TMA cations (C16Ken-0.4). When Na-kenyaite was completely exchanged (sample C16Ken-0.8), spherical agglomerates of particles were obtained. The spherical agglomerates might have resulted from the organophilic character of the C16Ken-0.8 sample (Supplementary information S1). Similar changes in morphology were observed for the organofunctionalized kenyaite.
Microtextural properties
The specific surface area was used to examine the changes of the textural properties of the raw kenyaite. The N2 adsorption isotherm of neat Na-kenyaite corresponded to type IV, which is related to non-porous materials, with an S BET of 30 m2g−1, related mainly to the adsorption of nitrogen molecules on the external surface of the kenyaite particles (Remy et al., Reference Remy, Vieira Coelho and Poncelet1996). The S BET value was comparable to that reported for other silicate materials such as Na-magadiite (Lambert et al., Reference Lambert, Millot, Casale, Blanchard, Zeng, Nie and Li2011). After intercalation of C16TMA cations, the C16Ken-0.2 exhibited a similar N2 isotherm to Na-Kenyaite, with a decrease in the S BET value to 10 m2g−1. Similar observations have been reported for organoclays (Kooli et al., Reference Kooli, Khimyak, Alshahateet and Chen2005). The pore volume deduced from the N2 isotherms was mainly related to the interparticle voids between the organo-kenyaites. By increasing the C16TMA contents, the S BET values decreased further to the average value of 5 m2g−1. The reduction of S BET was related to the decrease of the active sites necessary for the adsorption of N2 molecules, either on the external surface of the Na-kenyaite, or in the interlayer space of the organo-kenyaites. The N2 molecules may have access to the interlayer space, provided that the interlayer is not occupied by C16TMA cations. The reduction of the S BET in organoclays has been attributed to the formation of closely packed aggregates due to interparticle hydrophobic interactions (Bhatt et al., Reference Bhatt, Praful, Sakaria, Vasudevan, Pawar, Sudheesh, Bajaj and Mody2012). The average pore volume decreased due to the close packing of the particles and to the shape of the voids (Bhatt et al., Reference Bhatt, Praful, Sakaria, Vasudevan, Pawar, Sudheesh, Bajaj and Mody2012).
THERMAL STABILITY
TGA studies
Thermogravimetric analysis was performed on neat C16TMABr salt and on the Na-kenyaite and its organo-derivatives to study their thermal stability. The thermal decomposition of C16TMABr occurred mainly in one step with a single mass-loss zone at 220°C (Fig. 5A). However, the derivative of TGA (DTG) indicated that the thermal decomposition occurred in two steps, with two maximum mass-loss rate temperatures at 248 and 277°C, due to the degradation of the hydrocarbon chain (Kooli et al., Reference Kooli, Khimyak, Alshahateet and Chen2005, Fig. 5A′). The Na-kenyaite displayed multiple mass loss steps. A mass loss of 6.8% was observed for temperatures up to 100°C, and was centred at 82°C (Fig. 5A, 5A′). It was attributed to the desorption of physically adsorbed water. A second mass loss of 4.2% was observed in the range 100–180°C with two peaks centred at 112 and 130°C, which were attributed to the removal of water molecules intercalated and bound to Na+ cations, respectively (Fig. 5A′). The continuous mass loss of 2.5% above 300°C was due to the dehydroxylation of the layer structure and is associated with a broad maximum temperature peak at 283°C (Kalvachev et al., Reference Kalvachev, Kostov, Todorova and Kadinov2006; Kooli et al., Reference Kooli, Mianhui and Plevert2006a). After reaction with the C16TMAOH solution, the resulting material (C16Ken-0.2) showed an additional mass-loss step in the range 180–270°C, with a broad peak centred at 221°C in the DTG curve (Fig. 5A′). The width of the DTG peak indicated overlapping steps during the loss of the organic surfactants. The third and fourth mass losses, centred at 352 and 445°C, may be attributed to various decomposition steps of organic materials within the sample (Kooli & Yan, Reference Kooli and Yan2009). Mass loss of water molecules bonded to Na+ cations was also observed, as indicated by the peak at 120°C in the DTG curve (Fig. 5A′). As the content of the C16TMA cations increased to 0.66 mmol/g, the shape of the peak centred at 221°C changed, and two different decomposition steps were observed that accounted for the large mass loss of the C16TMA cations (11%). The intensity of the peaks centred at 120°C decreased significantly due to the replacement of Na+ by C16TMA cations. In addition, the mass loss of physi-adsorbed water molecules decreased from 6.8 to 2.5% with increasing amount of intercalated C16TMA cations, suggesting the hydrophobic character of the organo-kenyaites. The continuous mass loss of 3.5% from 400°C to 800°C was related to the dehydroxylation process of the silicate layers and the burn-out of the residual carbonaceous materials (Yariv, Reference Yariv2004; Fig. 5A′). Compared to the neat C16TMABr, the mass loss of intercalated cations occurred in a narrow temperature range, indicating a similar degradation process of C16TMA cations between the silicate layers. The maximum temperatures of mass loss of the intercalated C16TMA cations at 213 and 241°C were smaller than that of the neat surfactant (Fig. 5A′), probably due to the retardant effect of the layers on the decomposition of the C16TMA cations.
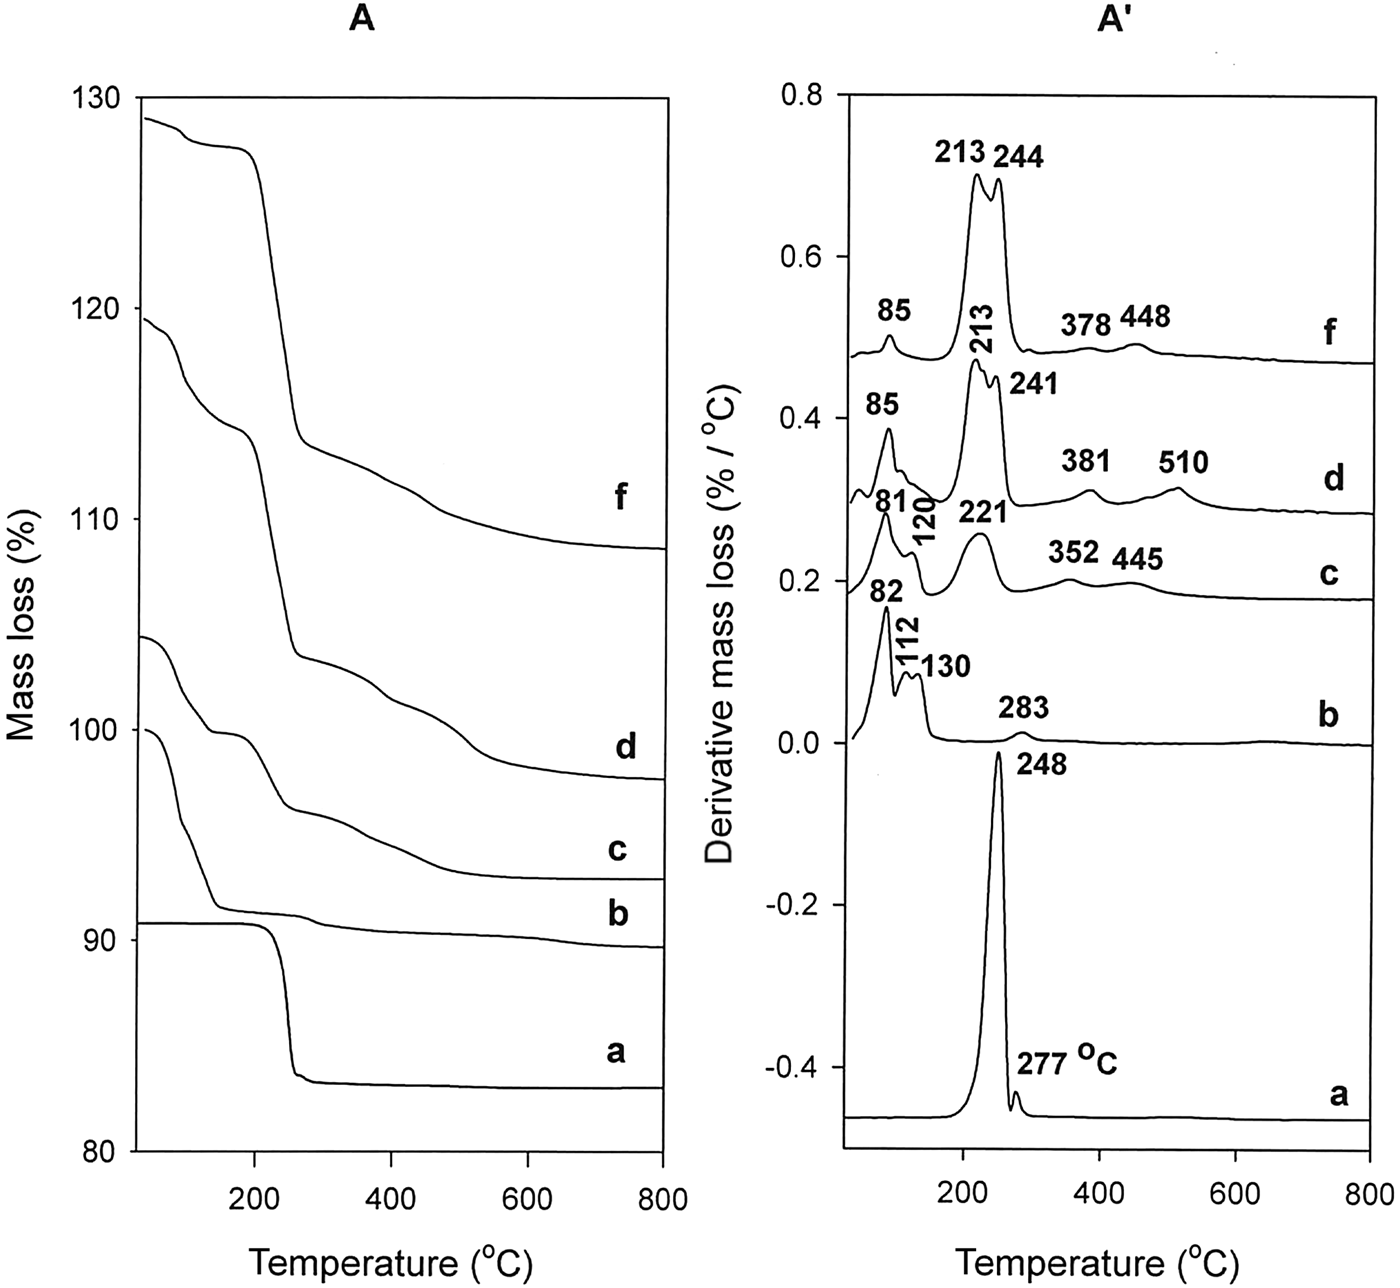
Fig. 5. TGA (A) and DTG (A′) features of (b) Na-Ken exchanged with various C16TMAOH concentrations (c) 0.25 mM, (d) 0.40 mM, and (f) 0.80 mM; (a) correspond to the TGA and DTG curves of pure C16TMABr salt.
The DTG curve of C16Ken-0.8 contains two broad peaks centred at 378 and 448°C (Fig. 5A′), assigned to the dehydroxylation of the silicate layers and the oxidation of the carbonic materials, respectively. The presence of C16TMA cations reduced the dehydroxylation temperature of the silicate layers from 510 to 448°C. Similar trends have been observed for organoclays and the intercalated alumina clays (Yariv, Reference Yariv2004; Kooli, Reference Kooli2013).
IN SITU ANALYSIS
In situ DRIFT studies
The in situ DRIFT spectra of organo-kenyaite at real heating temperatures are shown in Supplementary information S2. The spectrum of the C16TMABr salt is in accordance with previous works (Vaia et al., Reference Vaia, Teukolsky and Giannelis1994; Wong et al., Reference Wong, Wong and Tanner1997), with bands at 2945, 2890 and 2850 cm−1, corresponding to both (νas(CH2)) antisymmetric and (νs(CH2)) symmetric CH2 stretching modes. The vibrations of methylene chains in the 790–730 and 1420–1470 cm−1 spectral regions and of a polar group in the 950–970 cm−1 region exhibited splitting. This splitting was observed for other long-chain compounds (Zhu et al., Reference Zhu, He, Zhu, Wen and Deng2005).
The spectrum of the C16Ken-0.8 organo-kenyaite at room temperature exhibited similar features to the C16TMABr salt. The position of the characteristic bands of C16TMA cations was close to that reported for C16TMABr, indicating a similarity in the conformation of the methyl chain. As the heating temperature increased to 100°C, the intensity of the bands of C16TMA at 2883, 2851, 1441, 964 and 763 cm−1 decreased and they became broader. The intensity of these bands continued to decrease with increasing temperature up to 250°C (Supplementary information S2). Qualitatively, no noticeable change in the position of the bands was observed, indicating that almost no conformation changes occurred during heating. Indeed, the C16TMABr salt does not melt; however, it decomposes at temperatures near 250°C. At temperatures of >250°C, no traces of surfactants were detected due to the decomposition of the C16TMA cations, as indicated by the TGA studies.
In situ XRD study
The structural changes were monitored by means of the in situ powder XRD from room temperature to 420°C. It was necessary to study the thermal stability of the neat C16TMABr salt. The PXRD pattern of C16TMABr at room temperature exhibited 002 reflections at 2.60 nm, 1.30 nm and 0.86 nm, indicating that the structure of the salt may be described as nonpolar bilayers located between polar layers (Wong et al., Reference Wong, Wong and Tanner1997). The value of 2.60 nm was slightly higher than the reported value for the length of similar cations. A continuous increase in the basal spacing was observed from 2.60 nm to 2.90 nm, 3.00 nm and 3.10 nm, as the heating temperature increased from 100 to 215°C. No reflections were obtained when C16TMABr was calcined at temperatures of >220°C, due to its decomposition (Supplementary information S3), in good agreement with the TGA data and DSC studies. Indeed, the DSC features of C16TMABr exhibited a peak at 103.5°C related to its solid–solid transition phase, which coincided well with the temperature at which an increase in the basal spacing of C16TMABr started to occur (Bezrodna et al., Reference Bezrodna, Puchkovska, Styopkin, Baran, Drozd, Danchuk and Kravchuk2010) (Supplementary information S4).
The basal spacing of Na-kenyaite decreased from 1.97 nm to 1.82 nm at 100°C, and it continued to decrease to 1.62 nm above 150°C due to the complete loss of water molecules between the layers (Fig. 6). Slight changes from 1.63 nm to 1.58 were observed up to 400°C, and the calcined material exhibited low crystal order. The value of 1.62 nm at 150°C was close to that reported for H-kenyaite, where the Na cations were exchanged with protons in which intercalated molecules of water were not present (Wang & Pinnavaia, Reference Wang and Pinnavaia2003).
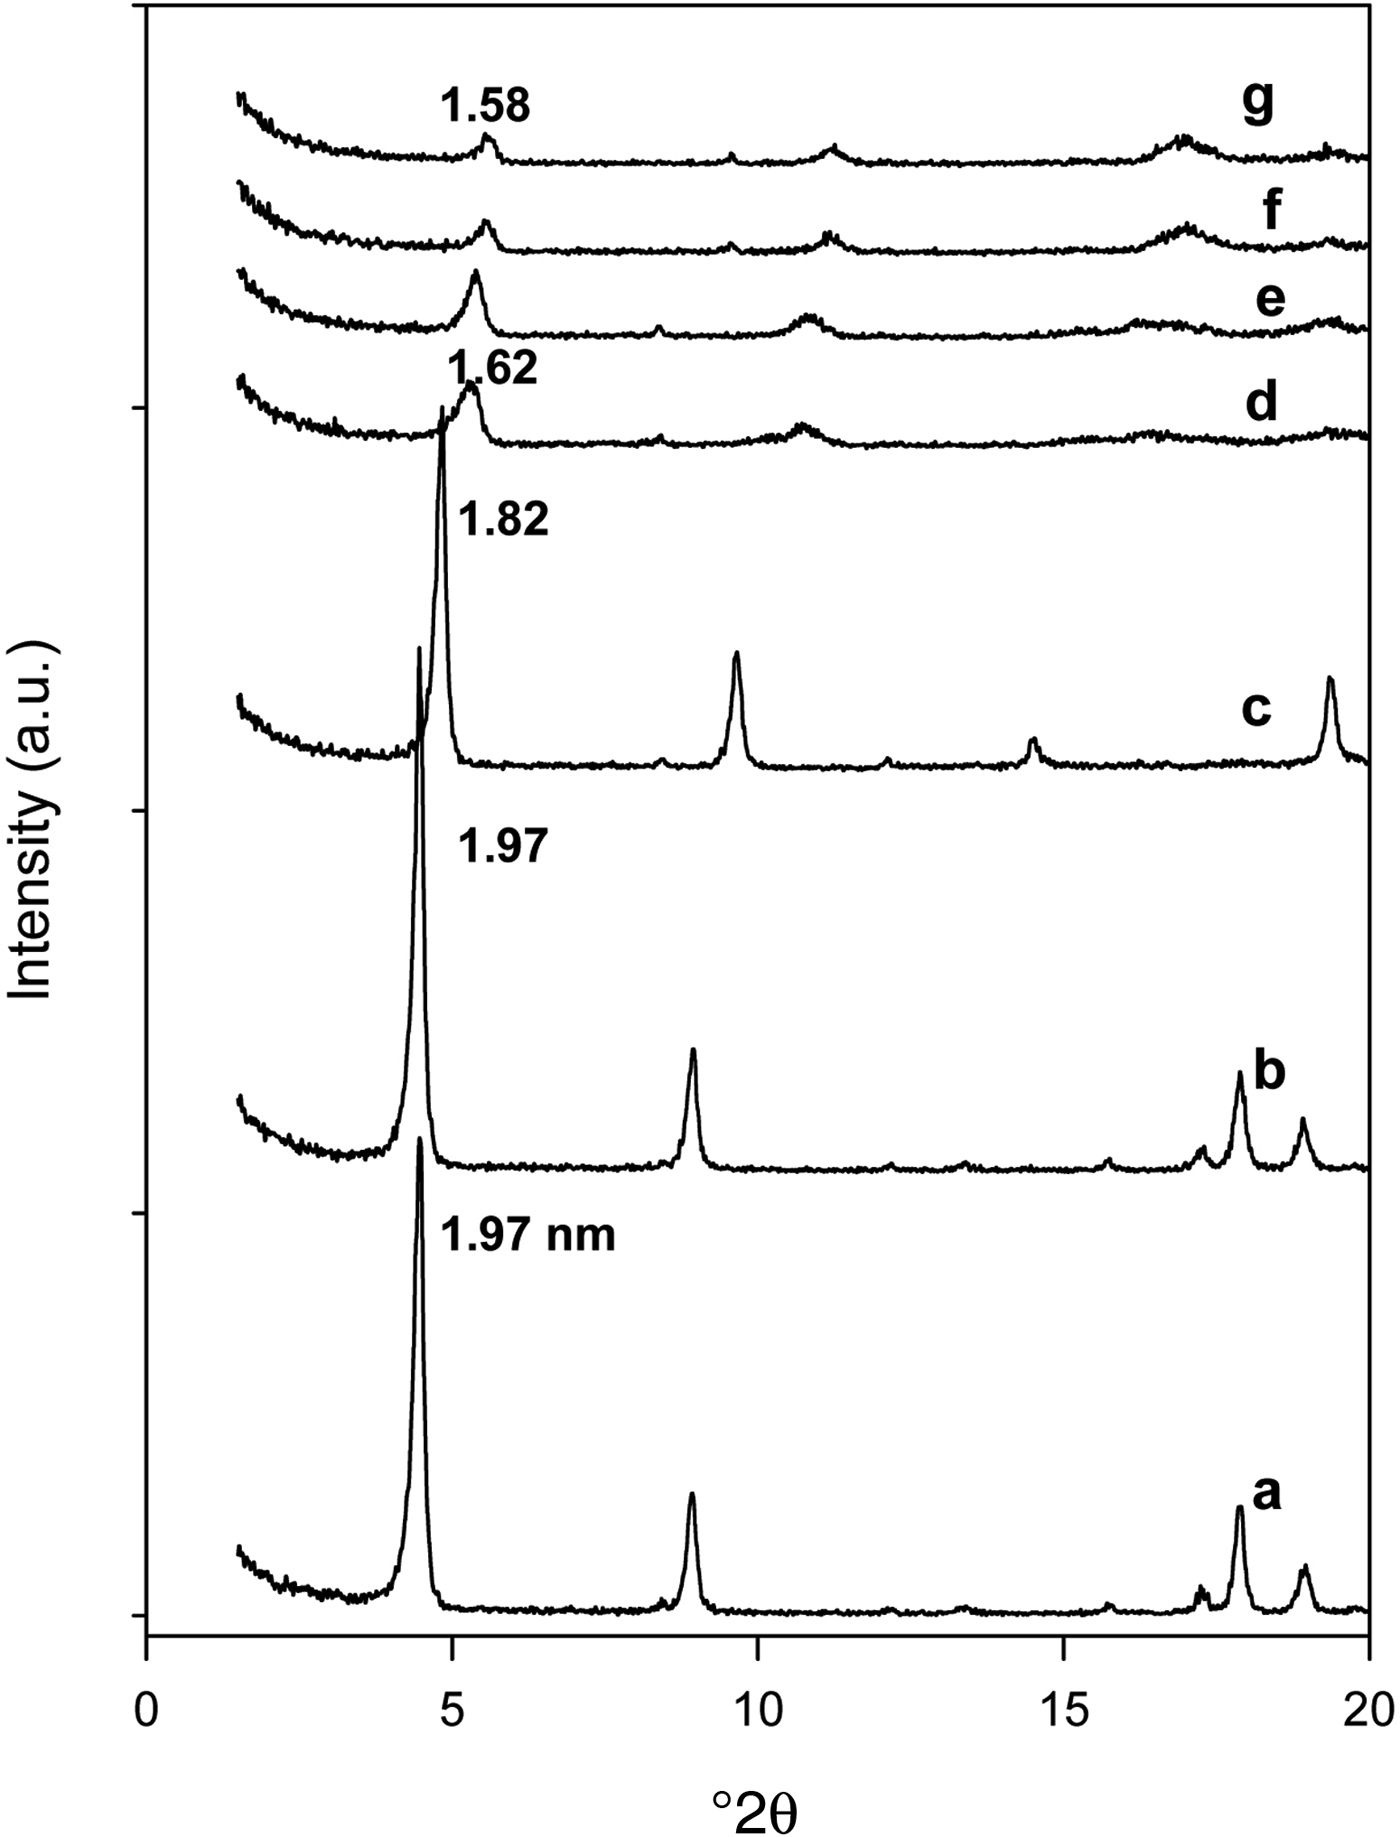
Fig. 6. In situ powder XRD pattern of Na-kenyaite (a) heated at various temperatures: (b) 50°C, (c) 100°C, (d) 150°C, (e) 200°C, (f) 300°C and (g) 420°C.
The in situ XRD study indicated that the organo-kenyaites behave differently from the Na-kenyaite. The C16Ken-0.8 was selected as a representative sample. An increase of the basal spacing from 3.50 nm to 3.74 nm was observed at heating temperatures up to 150°C, followed by gradual decrease to 3.51 and 2.81 nm at 200 and 215°C, respectively. Above 215°C, an important decrease in basal spacing from 2.81 to 1.98 nm was observed. This value was greater than that of pure Na-kenyaite calcined at the same temperature (1.62 nm). A continuous decrease of this value was observed down to 1.90 nm at 420°C, accompanied by increasing width of the reflections, due to the loss of crystal order (Fig. 7).
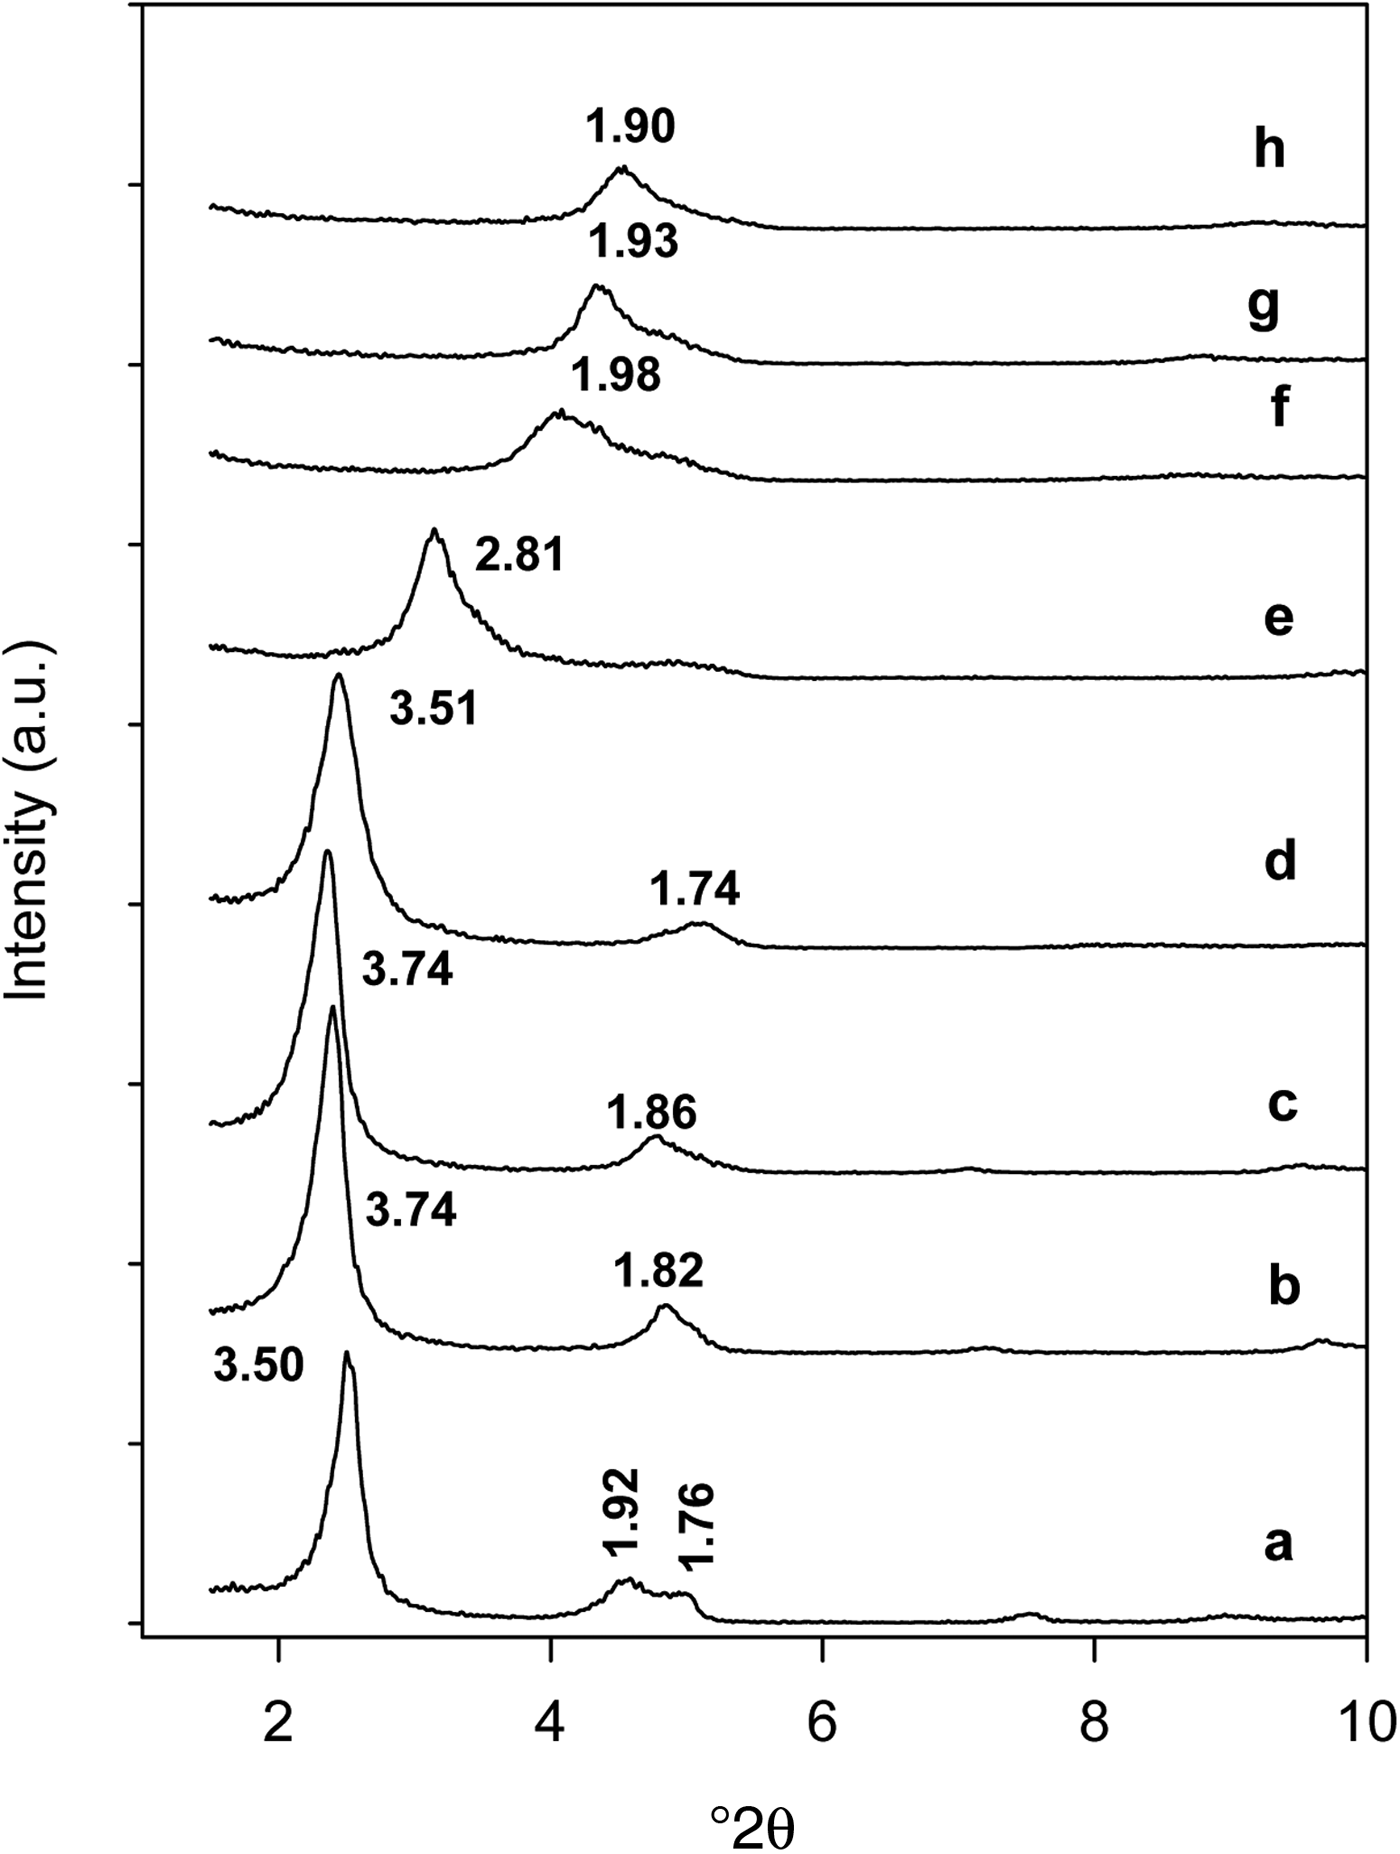
Fig. 7. In situ powder XRD pattern of organo-kenyaite (C16Ken-0.8) (a) heated at various temperatures: (b) 50°C, (c) 100°C, (d) 150°C, (e) 215°C, (f) 250°C, (g) 300°C and (h) 400°C.
The noted expansion of the basal spacing of organo-kenyaite at higher temperatures (150–200°C) was similar to that of the C16TMABr salt, indicating that intercalated cations behave in a similar manner to the neat C16TMABr salt, which could be attributed to the thermal expansion of C16TMA normal to the layers, as has been described for the pure C16TMABr. Previous studies related to alkylammonium smectites indicated an initial increase in the basal spacing during heating from 50 to 100°C when the surfactants adopted a disordered conformation (Vaia et al., Reference Vaia, Teukolsky and Giannelis1994; Wang et al., Reference Wang and Pinnavaia2003). In the present study, it was difficult to observe this expansion at this temperature range, as confirmed by in situ FTIR data, which would indicate a possible absence of disordered conformations of the intercalated surfactants at lower temperatures.
REMOVAL OF EOSIN
Effect of initial concentrations
The initial eosin concentration, Ci, plays a vital role in the uptake of dye by the adsorbents. C16Ken-0.8 was used as a model sample in this study. The percentage of eosin removed decreased with increasing Ci values, with a maximum of 99% for lower Ci values decreasing to ~40% at Ci values >700 ppm. On the other hand, an increase in removal capacity from 2.5 mg g−1 to 48 mg g−1 was achieved with increasing eosin concentrations (Supplementary information S5).
At lower Ci values, sufficient adsorption sites are available for the removal of dye ions. In contrast, at higher Ci values, the number of eosin ions was greater than the number of sites available (Mane et al., Reference Mane, Mall and Srivastava2004). The increase in the removal with the low initial eosin dye concentration indicates that the organo-kenyaite has potential for the removal of eosin dye.
In general, the modification process improved the removal of eosin compared to the Na-kenyaite, and the organo-kenyaites removed more eosin dye than the Na-kenyaite (Fig. 8). Similar results were obtained for organoclays when removing of the same dye (Al-Faze & Kooli, Reference Al-Faze and Kooli2014).
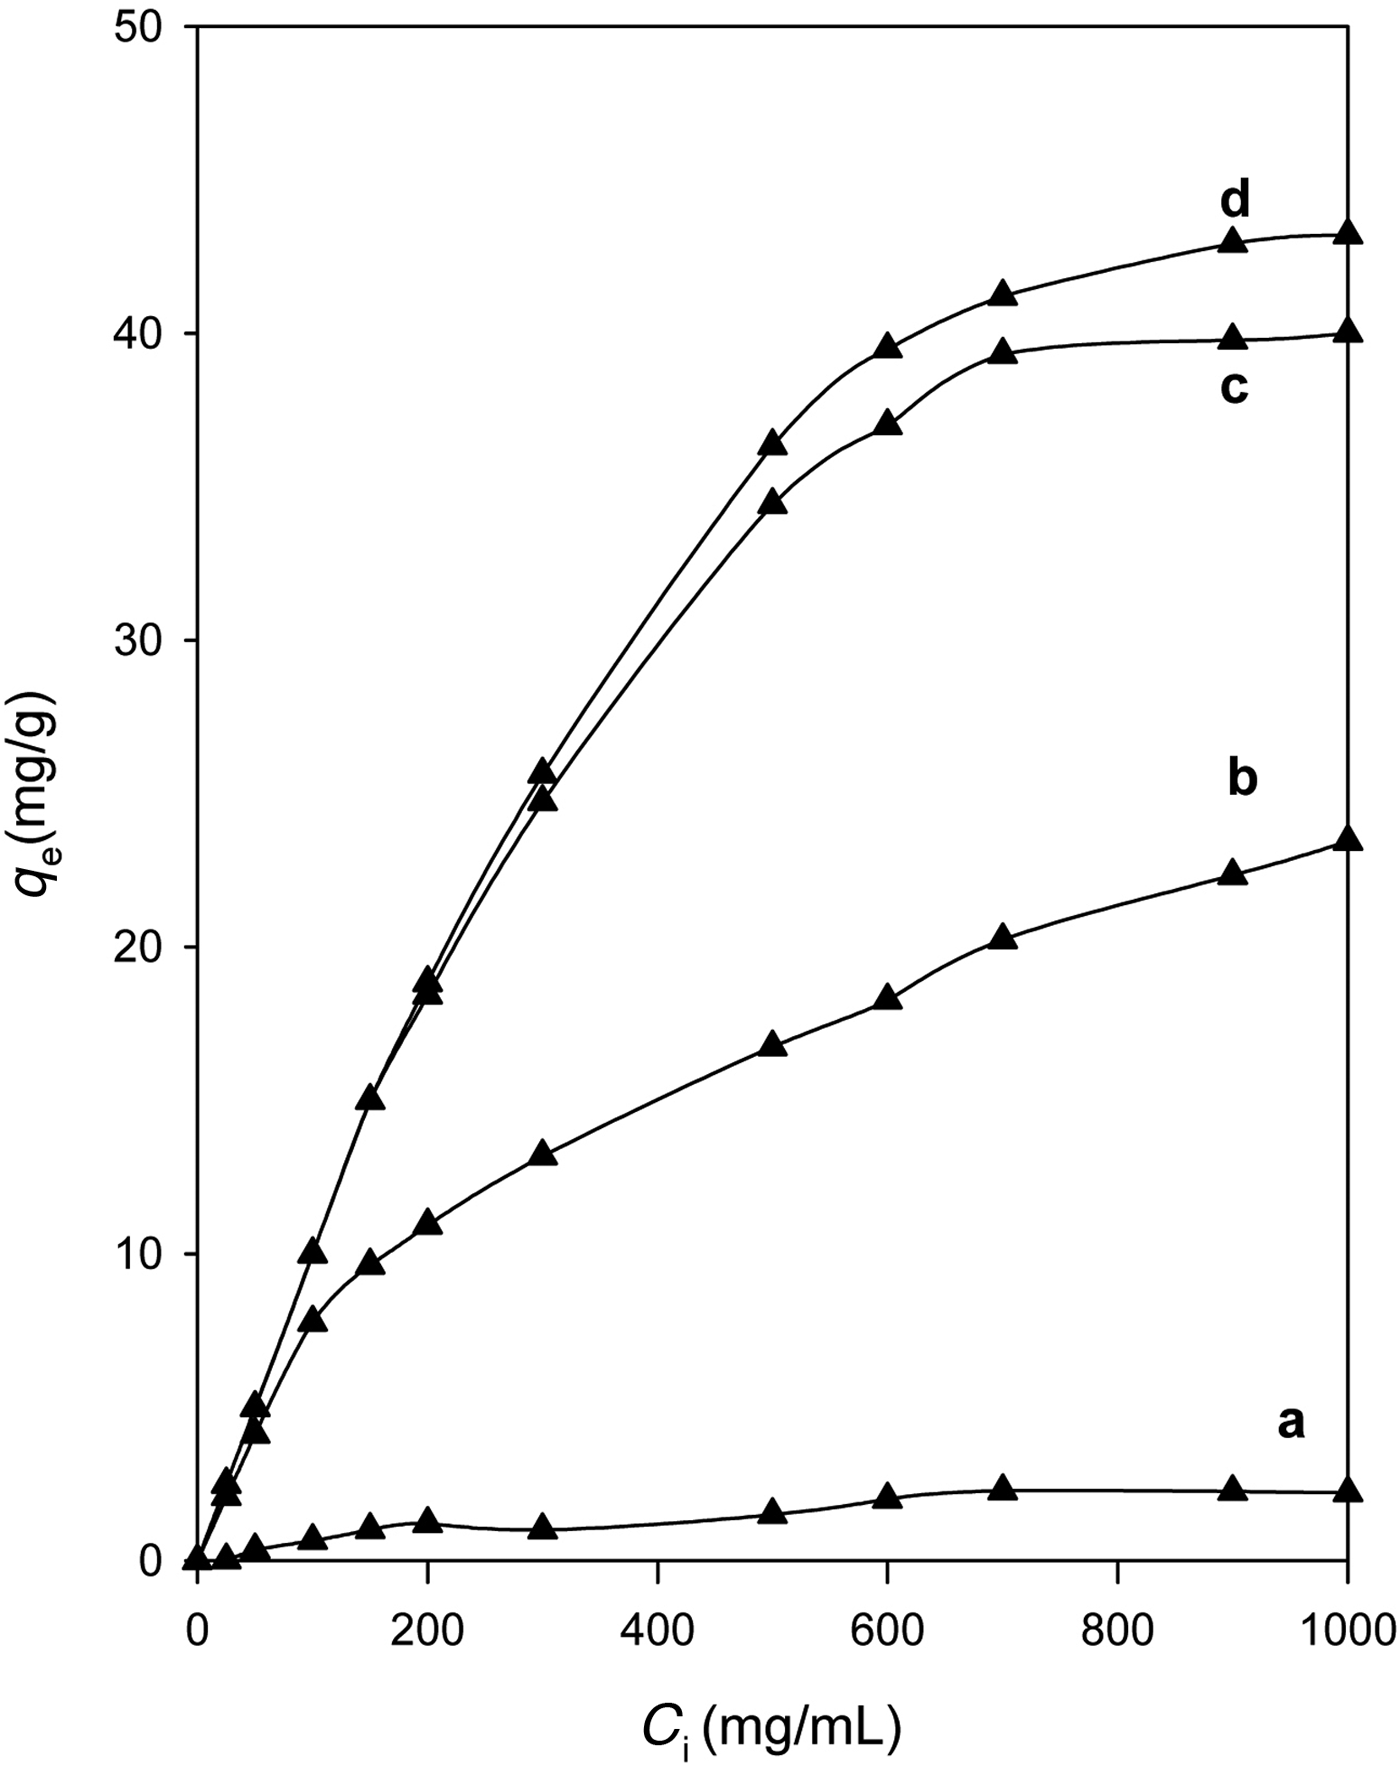
Fig. 8. Amount of eosin (mg/g) removed by: Na-kenyaite and its organo-derivatives (a) prepared with various concentrations: (b) 0.20 mM, (c) 0.40 mM, and (d) 0.80 mM.
The modification of silicate surfaces by organic cations and especially long ones such as C16TMAs rendered the kenyaite organophilic, similar to organoclays (Park et al., Reference Park, Ayoko and Frost2011). The negatively charged surface of the silicate adsorbed the C16TMA+ cations via ion exchange, which formed a monolayer of cationic surfactants. The positively charged ends of the cationic surfactants were exchanged with the interlayer exchangeable cations of the kenyaite (Na+) and the hydrophobic head of the cationic surfactants was arranged outward (Ahmadishoar et al., Reference Ahmadishoar, Bahrami, Movassagh, Hosein and Arami2017). The C16TMA+ cations generated an organophilic phase partition in the interlayer spacing, through interaction of the dyes with the cationic C16TMA+ cations (Bergaya & Lagaly, Reference Bergaya and Lagaly2001; Park et al., Reference Park, Jeong and Kwon2004; Onal, Reference Onal2007; Vidal & Volzone, Reference Vidal and Volzone2012).
Effect of removal temperature
The effect of temperature on the removal of eosin dye was studied in the range of 30–50°C and at a natural pH value. At low initial concentrations (25–200 ppm), the percentage removal of eosin reached 98% and the influence of temperature was not noticeable, due to the fact that almost all the initial eosin was fixed by the available active site on the adsorbent, indicating a process that is not temperature-dependent. With increasing temperature from 30 to 50°C, the percentage removal of eosin increased to a maximum of 95% at 50°C, for initial concentrations of >600 ppm (Özcan & Özcan, Reference Özcan and Özcan2004), accompanied by an increase the amount of dye removed. This might be due to a higher partitioning rate of dye molecules in organophilic kenyaites, similar to organoclays (Bhatt et al., Reference Bhatt, Praful, Sakaria, Vasudevan, Pawar, Sudheesh, Bajaj and Mody2012). The increase in the amount adsorbed with temperature indicated that the removal of the dye is an endothermic process.
Effect of calcination temperature
The removal of eosin was examined for one selected organo-kenyaite (C16Ken-0.8) treated at various temperatures. Thermal treatment was used to regenerate the spent clays or organoclays for further reuse (Lin & Cheng, Reference Lin and Cheng2002). For organo-kenyaite treated at temperatures of <150°C, slight variation in the amount of eosin removed was observed for initial concentrations of >200 ppm. However, a decrease in eosin removal was noted for organo-kenyaite treated at 200°C due to the starting decomposition of the intercalated C16TMA cations, as indicated by the in situ XRD study. A significant decrease in eosin removal was observed for samples treated at temperatures of >235°C (Fig. 9). This was due to the complete destruction of the intercalated organic cations. However, the amount of eosin removed was greater than the pure Na-kenyaite, probably due to the residual carbon materials in the treated samples. Similar observations were noted for organoclay minerals treated at different temperatures for the removal of nitrobenzene from aqueous solution (Borisover et al., Reference Borisover, Bukhanovsky, Lapides and Yariv.2010). However, the thermal treatment of the organoclay mineral did not affect significantly the amounts of nitrobenzene removed.
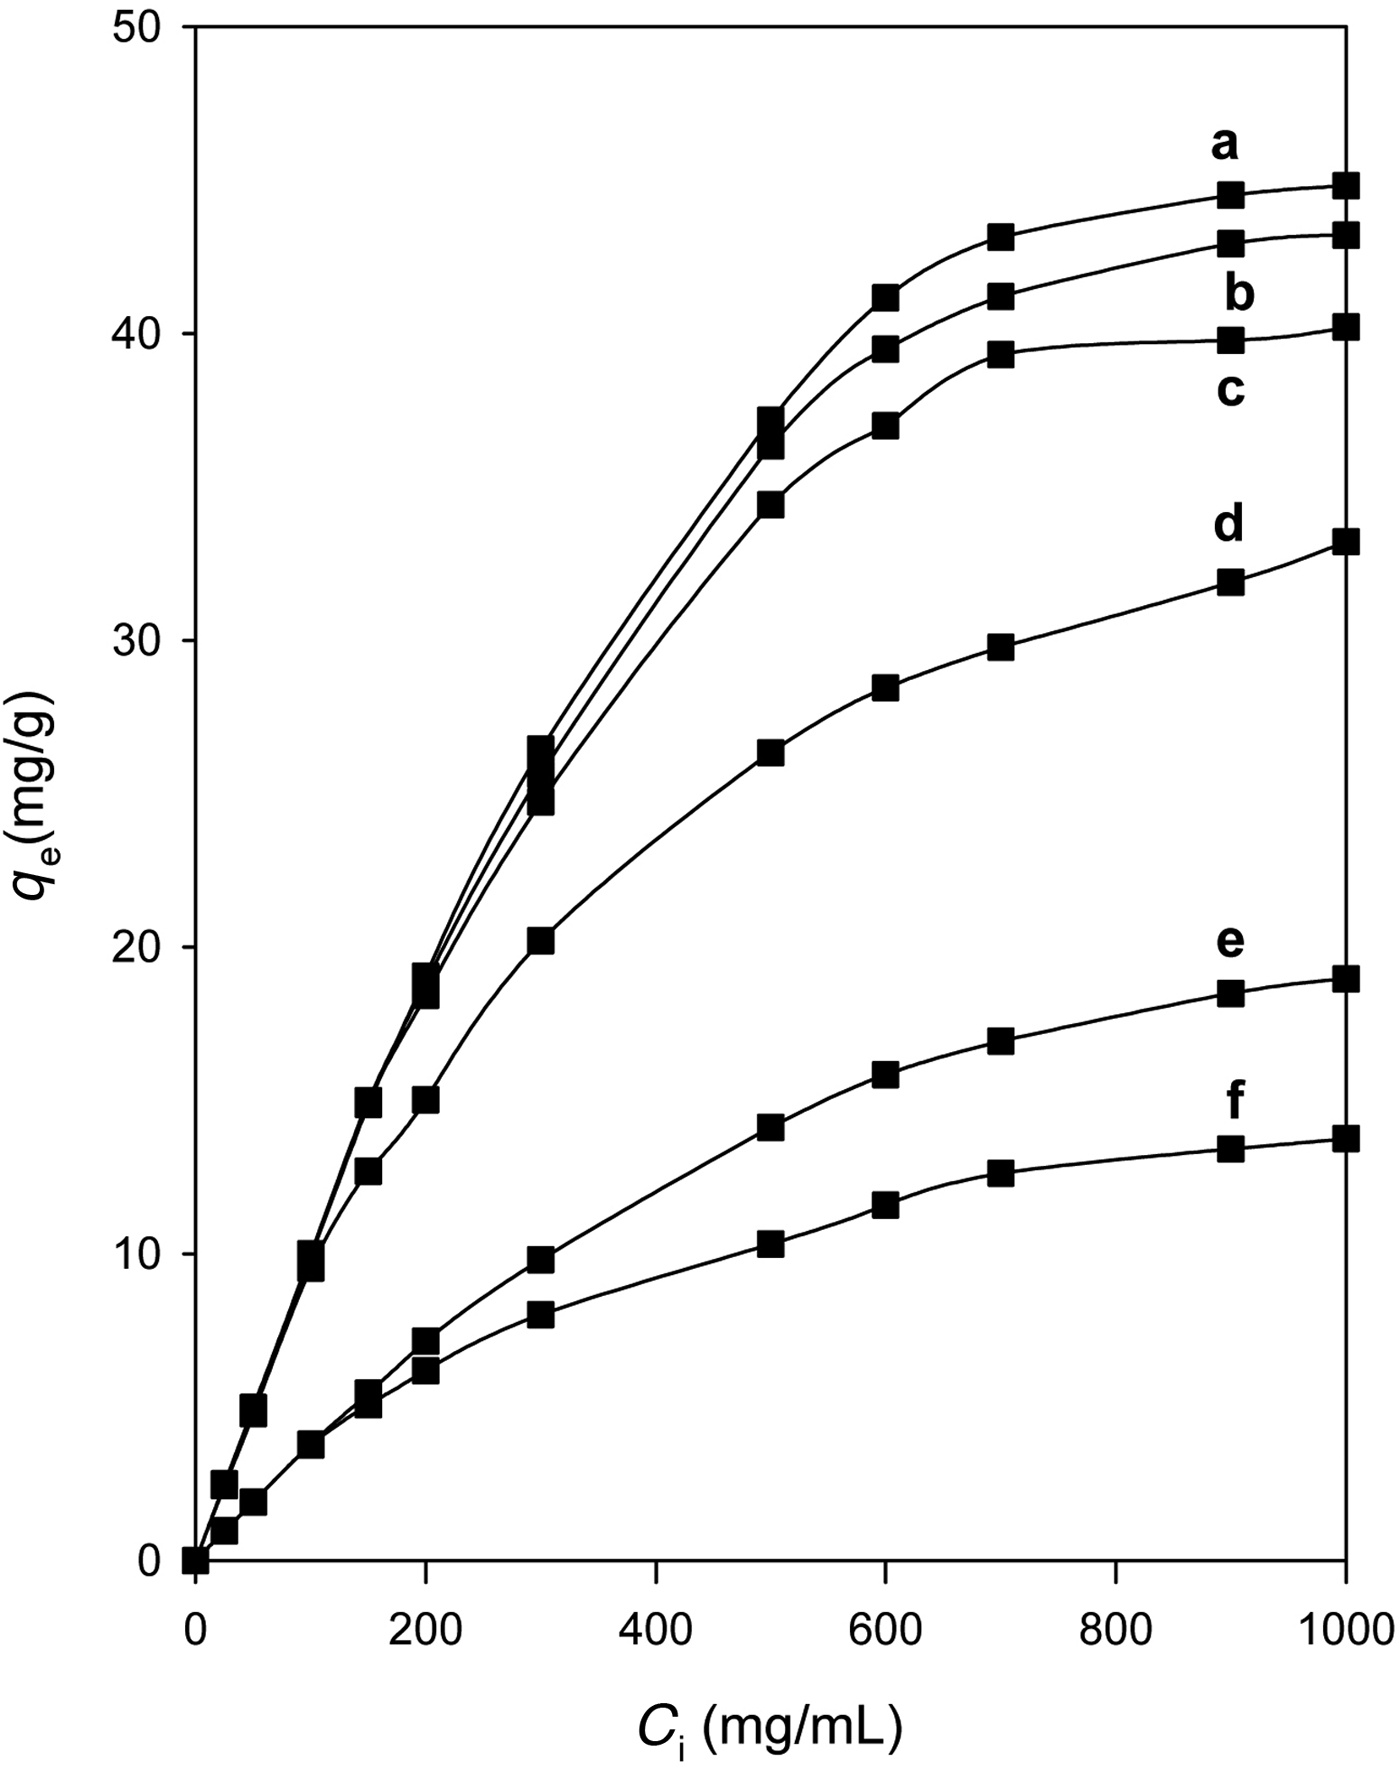
Fig. 9. Amount of eosin (mg/g) removed by selected organo-kenyaite (C16Ken-0.8) heated at various temperatures: (a) RT, (b) 100°C, (c) 150°C, (d) 200°C, (e) 215°C, and (f) 250°C.
Maximum removal amount
The Langmuir model was used to estimate the maximum amount of eosin removed. This model is based on the assumption that the maximum adsorption corresponds to a saturated monolayer of adsorbate molecules on the adsorbent surface, that the energy of adsorption is constant and that there is no transmigration of adsorbate across the plane of the surface (Langmuir, Reference Langmuir1916). The linearized Langmuir isotherm allows calculation of the adsorption capacities (q max) and the Langmuir constants (KL) according to the following equation:
where q e is the amount adsorbed at equilibrium (mg/g), C e is equilibrium concentration of the adsorbate (mg/L), q max is the adsorption capacity (mg/g), and KL is the Langmuir constant (L/mg). These constants can be evaluated from the intercept and slope of the linear plot for the experimental data of C e/q e vs. C e.
The experimental data fitted well with the Langmuir model with a linear coefficient of determination, R2, close to 0.998 (Table 3). The KL parameter of the Langmuir model represented the interaction energies between the eosin and adsorption sites of organo-kenyaite. In general, the modification of kenyaite improved the removal capacity of Na-kenyaite, with the organo-kenyaite exhibiting greater removal capacities than the Na-kenyaite. This capacity increased as the amount of organic cations was increased. The maximum amount removed was also dependent on the heat treatment of a selected organo-kenyaite.
Table 3. Langmuir equation parameters for the removal of eosin by various organo-kenyaites.
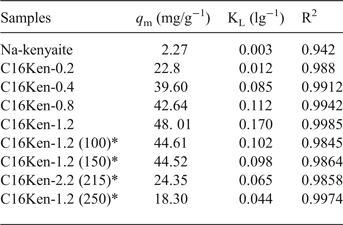
* corresponds to heating temperature value (°C) of the organo-silicate.
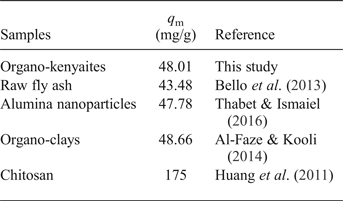
The KL parameter of the Langmuir model increased gradually when the amount removed increased, and it is a measure of the affinity between adsorbate and adsorbent. The organo-kenyaites exhibited values which were elose to or less than those of organoclay minerals. This difference was related to the contents in term of C16TMA+ cations in the organo-silicates (Al-Faze & Kooli, Reference Al-Faze and Kooli2014). On the other hand, the organo-kenyaites exhibited similar values to raw fly ash and alumina nanoparticles (Bello et al., Reference Bello, Olusegun and Njoku2013; Thabet & Ismaiel, Reference Thabet and Ismaiel2016; Table 4). The largest amount of eosin removed was reported for chitosan (175 mg/g, Huang et al., Reference Huang, Bin, Bu, Jiang and Zeng2011). This value was related to the number of removal sites and the structure of the chitosan.
Table 4. Removal capacities of various adsorbents for eosin.
Reuse test of organo-kenyaite
The reuse of the adsorbent is of prime economic interest because it reduces operating cost and solves problems related to the disposal of the spent adsorbent. C16Ken-0.8 can be regenerated and reused efficiently for the removal of eosin, without compromising the removal percentage and capacity for lower eosin concentrations of 50 ppm (Fig. 10). The removal percentage and capacity were maintained after five cycles of reuse. However, the removal efficiency decreased slightly in the first three cycles from 74 to 70% at higher eosin concentrations (500 mg/mL). At four recycles and above, the removal percentage decreased from 60% to 40%, probably due to the strong interactions between eosin molecules and the active sites on C16Ken-0.8 because of chemical interactions, which limited its desorption (Fig. 10).
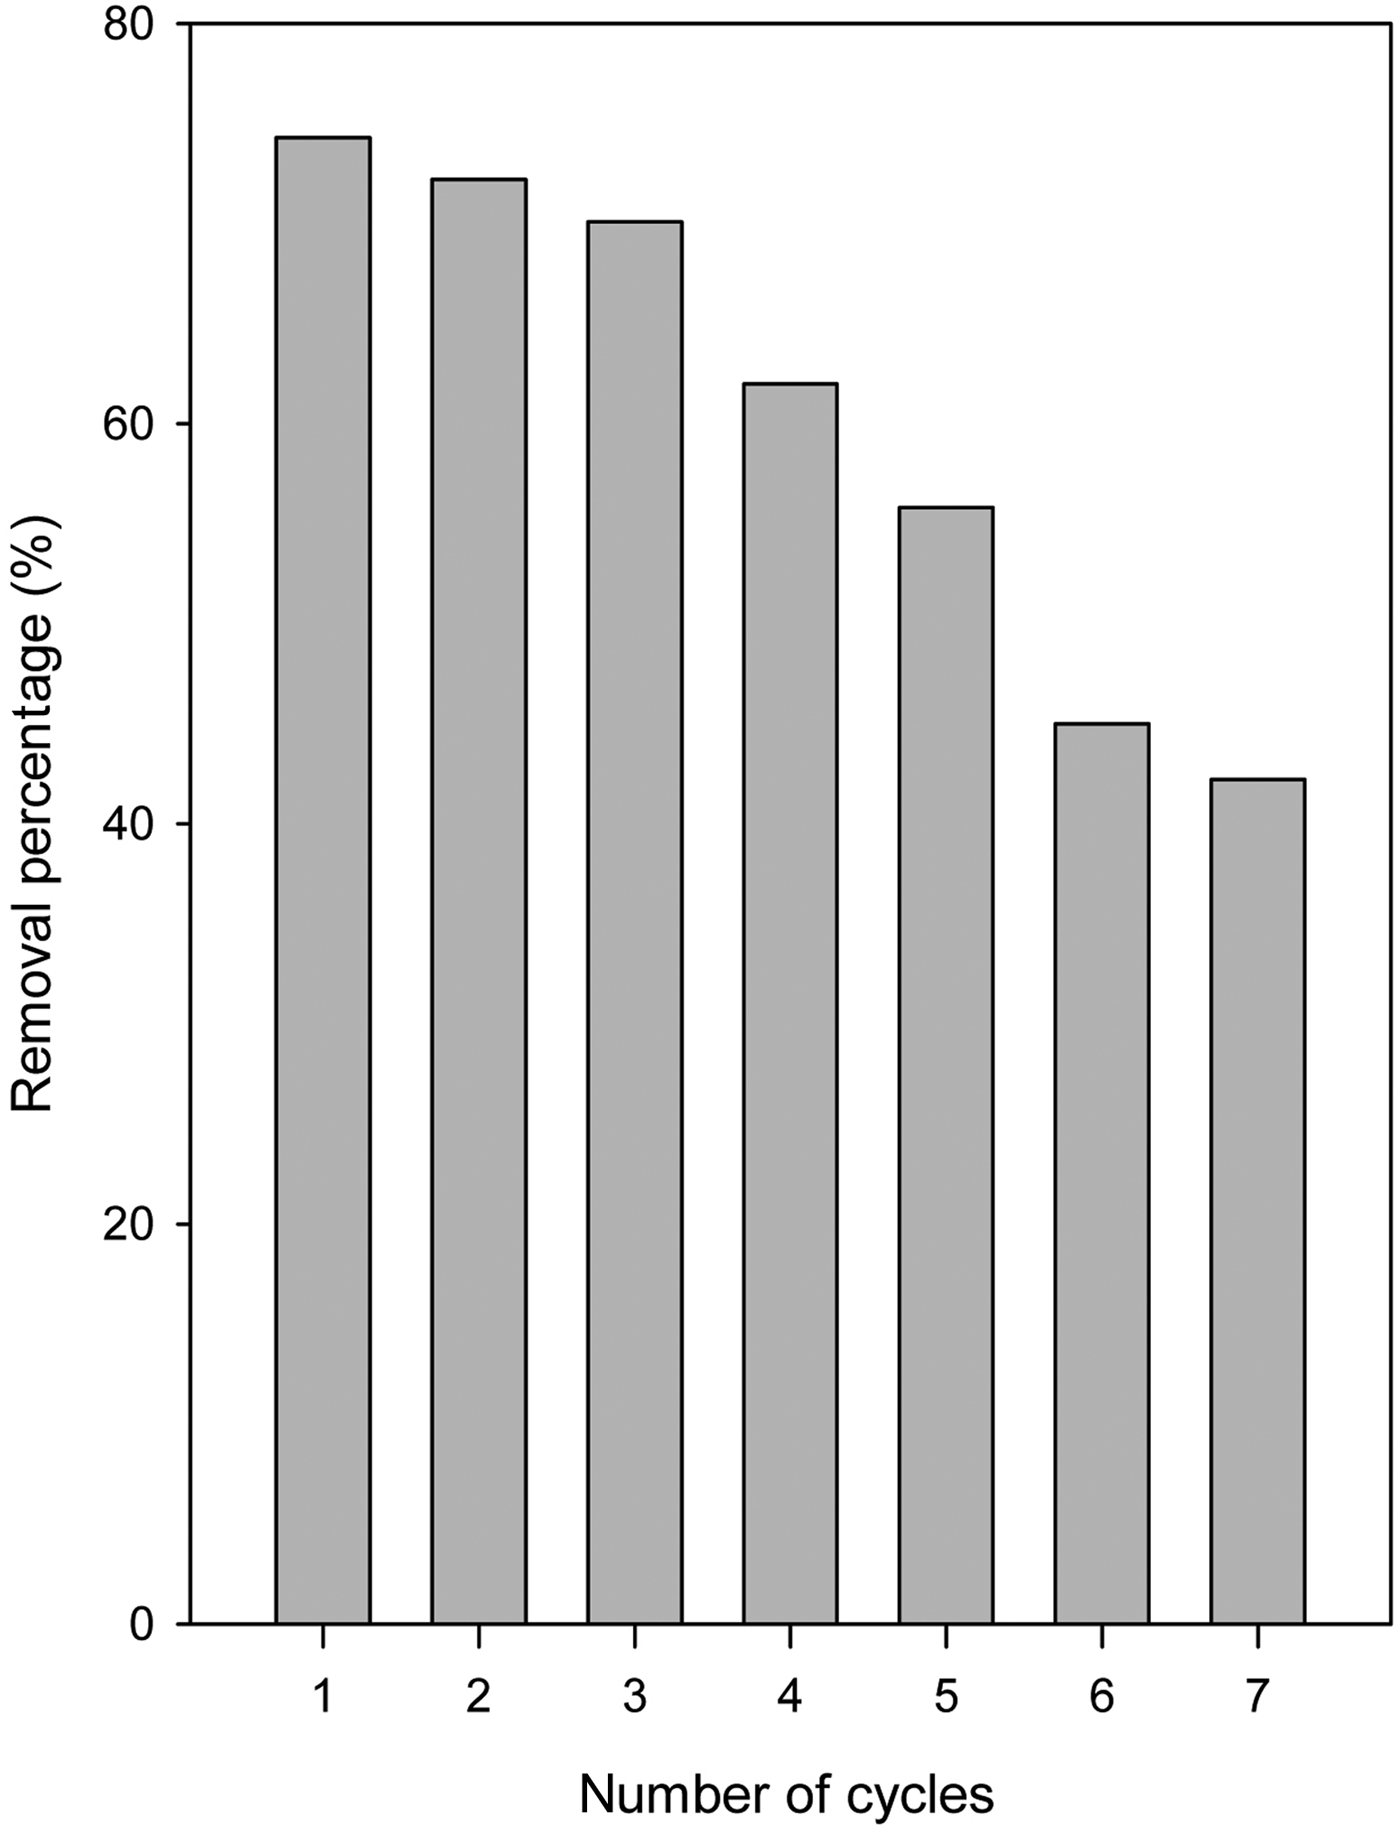
Fig. 10. Eosin removal percentage of a selected organo-kenyaite (C16Ken-0.8) after a number of regeneration cycles.
CONCLUSIONS
Na-kenyaite was modified successfully by C16TMA cations, and an exchange of 90% of CEC was achieved. The resulting materials were stable in basic (NaOH) solution, while an exchange of the intercalated C16TMA cations occurred in the acidic (HCl) solution. The intercalated cations have a similar structure to the neat C16TMABr salt with a mainly trans conformation, as indicated by 13C NMR. The thermogravimetric analysis (TGA) and in situ studies indicated that organo-kenyaites exhibited a certain degree of thermal stability, and the intercalated C16TMA cations started to decompose at temperatures of >200°C, accompanied by a shrinkage of the basal spacing from 3.50 nm to 2.00 nm. The removal of eosin was enhanced by the modification of Na-kenyaite by C16TMA cations, and a maximum value of 50 mg g−1 was achieved. The thermal treatment of the organo-silicates did not improve the removal properties of the organo-kenyaites, and a decrease of the maximum amount removed from 48 mg g−1 to 18 mg g−1 was observed for samples heated at temperatures of >215°C, due to the decomposition of the C16TMA cations. The thermal treatment helped to define the optimal temperature at which the modified kenyaite might be used. The organo-kenyaite showed a consistently high removal efficiency (up to 70%) when used repeatedly after three cycles, which reflected its reasonable regeneration capacity.


