Introduction
Many attempts have been made over the past two centuries to categorize human irrational fears and phobias (Marks, Reference Marks1987a , Reference Marks b ; Berrios, Reference Berrios1996). The past 40 years have seen a range of factor analyses of self-reported fears with varying results (Rothstein et al. Reference Rothstein, Holmes and Boblitt1972; Meikle & Mitchell, Reference Meikle and Mitchell1974; Hallam & Hafner, Reference Hallam and Hafner1978; Mellon, Reference Mellon2000; Muris & Ollendick, Reference Muris and Ollendick2002; Cox et al. Reference Cox, McWilliams, Clara and Stein2003; Fisher et al. Reference Fisher, Schaefer, Watkins, Worrell and Hall2006). For example, ‘The Phobia List’, available online, enumerates more than 500 individual phobias (Culberson, Reference Culberson2012). By contrast, the first widely influential set of operationalized diagnostic criteria, the Feighner criteria (Feighner et al. Reference Feighner, Robins, Guze, Woodruff, Winokur and Munoz1972; Kendler et al. Reference Kendler, Munoz and Murphy2010), contained a single category with no subtypes, simply called ‘Phobic Neurosis’. The Research Diagnostic Criteria published 6 years later contained a category of Phobic Disorder with three subtypes: agoraphobia, social phobia and simple phobia (Spitzer et al. Reference Spitzer, Endicott and Robins1978). The same typology for phobias was used by the DSM-III (APA, 1980) and DSM-III-R (APA, 1987). The DSM-IV described a more complex system that first divided the phobias into agoraphobia, social and specific phobias, further dividing the latter category into animal, situational, natural environment and blood-injection-injury subtypes (APA, 1994). The DSM-IV typology for phobias was adopted with little change in DSM-5 (APA, 2013).
In their landmark paper, Robins & Guze (Reference Robins and Guze1970) recommended several steps to establish diagnostic validity for psychiatric illness, the last of which was the study of genetic and familial factors. Twin studies have definitively shown that genetic factors contribute meaningfully to the risk of phobias (Torgersen Reference Torgersen1979; Kendler et al. Reference Kendler, Neale, Kessler, Heath and Eaves1992, Reference Kendler, Myers, Prescott and Neale2001; Czajkowski et al. Reference Czajkowski, Kendler, Tambs, Roysamb and Reichborn-Kjennerud2011). An early twin study with a relatively small sample size established that phobias are heritable with an additive genetic variance of around 0.5 for most phobias, but with agoraphobia having a lower heritance of 0.23 (Torgersen, Reference Torgersen1979). Phobias are highly co-morbid within individuals and in most (Kendler et al. Reference Kendler, Neale, Kessler, Heath and Eaves1992, Reference Kendler, Myers, Prescott and Neale2001), but not all (Fyer et al. Reference Fyer, Mannuzza, Gallops, Martin, Aaronson, Gorman, Liebowitz and Klein1990), studies across pairs of relatives. Larger and statistically more powerful twin studies of males and females using multivariate twin models have detected the presence of genetic and environmental factors common to the major classes of phobias (agora-, social, situational, animal, and blood-injury) in addition to the specific factors for each class (Kendler et al. Reference Kendler, Neale, Kessler, Heath and Eaves1992, Reference Kendler, Myers, Prescott and Neale2001). The common environment generally contributes minimally to the etiology of phobias with the possible exception of social phobia (Kendler et al. Reference Kendler, Myers, Prescott and Neale2001). Most recently, using clinical interviews in a large twin sample, Czajkowski et al. (Reference Czajkowski, Kendler, Tambs, Roysamb and Reichborn-Kjennerud2011) found that a more complicated model of two latent factors with genetic and individual-specific environmental contributions fit their data best.
Many genetically informative studies that have examined multiple phobia subtypes to date have used DSM-like categories that cluster the individual fears and phobias into broad groups. An example of the limiting factor in this approach is that a study participant reporting a fear of snakes will have the same effect on the analysis as one reporting a fear of mice. Similarly, two participants with traditionally agoraphobic fears, such as being in crowds or being too afraid to leave the house alone, will both be treated in the same way for the purposes of measuring the genetic and environmental components contributing to their phobias. By aggregating these individual phobic subtypes, prior analyses assumed rather than tested how these individual fears clustered empirically. Other genetically informative studies examining multiple phobia subtypes have used phenotypic factor analysis as a first step to form subtypes, followed by traditional twin models on the phenotypic factors (Rose & Ditto, Reference Rose and Ditto1983; Sundet et al. Reference Sundet, Skre, Okkenhaug and Tambs2003). Although this method validates these phenotypic factors as heritable, it does not reveal any of the underlying genetic risk factor architecture.
We conducted a multivariate twin study using 21 individual phobic stimuli to allow the genetic and environmental risk factor architecture of phobias to be examined in an unbiased way. We use the term ‘phobic stimuli’ to emphasize that our study is an analysis of the phobias at a more fundamental level than aggregated phobias. Instead of aggregating, we defined each phobia solely by its stimulus. We examined the structure of the genetic and environmental risk factors for 21 phobic stimuli in 4067 twins from the Virginia Adult Twin Study of Psychiatric and Substance Abuse Disorders (VATSPSUD). This approach allowed us to evaluate, from a familial and genetic perspective (as recommended by Robins & Guze, Reference Robins and Guze1970), the validity of the proposed DSM phobia typologies.
Method
Sample
Participants in this study derive from two inter-related studies in Caucasian same-sex twin pairs who participated in the VATSPSUD (Kendler & Prescott, Reference Kendler and Prescott2006). All subjects for the VATSPSUD were ascertained from the Virginia Twin Registry, a population-based register formed from a systematic review of birth certificates in the Commonwealth of Virginia. Female–female (FF) twin pairs, from birth years 1934–1974, became eligible if both members previously responded to a mailed questionnaire in 1987–1988, the response rate to which was approximately 64%. Data on fears and phobias used in this report were collected at the fourth wave of interviews (FF4), conducted in 1995–1997. For this wave, we interviewed 85% of the eligible subjects. Data on the male–male (MM) pairs came from a sample (birth years 1940–1974) initially ascertained directly from registry records, which contained all twin births, by a telephone interview to which the response rate was 72%. Data on fears and phobias were collected at the second wave of interviews (MM2), conducted in 1994–1998 with a response rate of 83%. Zygosity was determined by discriminant function analyses using standard twin questions validated against DNA genotyping in 269 FF and 227 MM pairs. The mean (s.d.) age and years of education respectively of the twins were 36.3 (8.2) and 14.3 (2.2) at the FF4 interview, and 37.0 (9.1) and 13.6 (2.6) at the MM2 interview. These analyses involved a total of 3642 twins including both members of 1195 monozygotic (MZ; 499 female and 696 male) and 626 same-sex dizygotic (DZ; 327 female and 299 male) pairs. In addition to the twin pairs, we included 201 female singletons and 224 male singletons to provide additional information to the model.
Clinical assessment
The lifetime prevalence of irrational fears and phobias was assessed at personal interview by trained mental health professionals who were blind to the status of the co-twin. The interview section that evaluated fears and phobias was based on the Diagnostic Interview Schedule (DIS; Robins & Helzer, Reference Robins and Helzer1985) and began:
Next I want to ask you about phobias, which are fears of particular things or situations that are so strong a person avoids them even though there is no real danger. I'm going to describe some of the most common kinds of phobias and ask if you have had any of these at any time in your life.
For each item, the interviewer then asked ‘Have you ever had an unreasonable fear of …?’ If the respondent answered positively to the presence of an unreasonable fear, the interviewer then inquired whether the fear ever interfered with their life or activities. Interference was here defined ‘objectively’ as some practical way in which the fear or the avoidance of the phobic stimulus impacted on their life functions. If the interviewee volunteered that they had exhibited avoidance behavior in response to the fear, the interviewer recorded that the fear interfered with the interviewee's life or activities. The interviewer did not interpret the mere experience of fear in the presence of the stimulus as interference.
For each specific phobic stimulus, twins were divided into three groups: (i) those who reported no fear, (ii) those who reported the presence of an irrational fear with no interference (here called ‘fear’), and (iii) those who reported both the irrational fear and objective interference associated with the fear (here called ‘phobia’). We treated these as three groups with values of zero, one and two for the polychoric correlations outlined in the Statistical Methods section. This approach to the diagnosis of phobias represents a modification of the DSM-III criteria (APA, 1980) on which this DIS was based. We tested, for each of the individual stimuli, whether these three categories reflected differing points on a single continuum of liability by fitting a multiple threshold model in the program PRELIS (Joreskog & Sorbom, Reference Joreskog and Sorbom1996). Using as our guide the root mean square error of approximation (RMSEA; Steiger, Reference Steiger1990), the multiple threshold model fit well for every variable. This supports the assumption in our modeling that individuals with no fear, fear and phobia reflects differing points on a single dimension of liability.
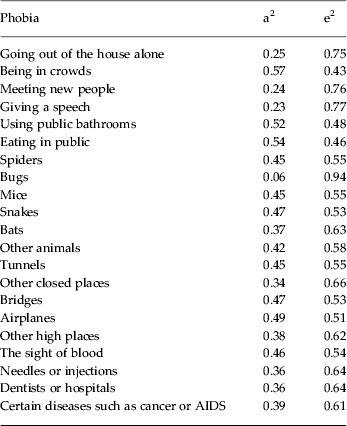
We assessed the presence or absence of fears or phobias in response to 22 phobic stimuli. Fears and phobias in response to one stimulus (being in open spaces) were too rare to analyze. Table 1 provides an abbreviated description of the 21 stimuli we analyzed.
Table 1. Heritability (a2) and the role of unique environmental effects (e2) for the individual fears/phobias estimated from our multivariate model

Statistical methods
The number of variables we needed to examine substantially exceeded the current limit (∼10) that can be fitted by standard multivariate twin modeling methods in Mx (Neale et al. Reference Neale, Boker, Xie and Maes2003). Therefore, as outlined in detail elsewhere (Kendler et al. Reference Kendler, Aggen, Knudsen, Roysamb, Neale and Reichborn-Kjennerud2011), we needed to use modified procedures. Specifically, our analytic approach involved three major steps: (1) estimating polychoric correlations for 42 (2 × 21) variables, including within-twin cross-disorder, cross-twin within-disorder, and cross-twin cross-disorder correlations for MZ and DZ twins separately; (2) estimating genetic and environmental correlations between all 21 phobic stimuli based on multivariate biometric modeling; and (3) applying exploratory factor analysis (EFA) to the resulting genetic and environmental correlation matrices.
Mplus 5.21 (Muthén & Muthén, Reference Muthén and Muthén2007) was used to estimate MZ and DZ polychoric correlations with corresponding asymptotic weights for the MZ and same-sex DZ twin pair data. The robust weighted least squares (WLS) mean and variance estimator was used. This method uses all available ordinal raw data for each combination of variables to estimate pairwise twin correlations for all disorder variables. The weights are the inverse of estimated variances of these correlation parameters. The Mplus TECH3 output and savedata options were used to obtain the weights. The asymptotic variances adjust the contribution of each of the polychoric correlations.
A saturated Cholesky decomposition of the MZ and DZ twin correlations among the 21 phobic stimuli was performed in Mx (Neale et al. Reference Neale, Boker, Xie and Maes2003). Prior multivariate analyses of fears and phobias in both this twin sample and others (Kendler et al. Reference Kendler, Neale, Kessler, Heath and Eaves1992, Reference Kendler, Myers, Prescott and Neale2001; Neale et al. Reference Neale, Walters, Eaves, Maes and Kendler1994; Czajkowski et al. Reference Czajkowski, Kendler, Tambs, Roysamb and Reichborn-Kjennerud2011) have consistently shown positive inter-fear/phobia genetic and individual specific environmental correlations (Kendler et al. Reference Kendler, Neale, Kessler, Heath and Eaves1992, Reference Kendler, Myers, Prescott and Neale2001; Neale et al. Reference Neale, Walters, Eaves, Maes and Kendler1994). We constrained genetic and environmental correlations to be ⩾0.00. We did this to help stabilize the analysis and prevent the model from explaining covariance through statistically and clinically unrealistic negative correlations. A diagonally WLS fit function was implemented in Mx to maximize the agreement between observed statistics and those predicted by the model. Squared deviations between observed and expected correlations computed in Mplus were weighted by the inverse of the asymptotic covariance of each statistic. The large number of variables in the model required us to use only the diagonally WLS instead of a more desirable maximum-likelihood approach. A diagonally WLS fit function was implemented in Mx to fit a two-group Cholesky model including additive genetic (A) and unique environmental (E) parameters to these estimated polychoric correlations and asymptotic weights. Because standard-estimating functions could not be used, ordinary statistical indices were not available to evaluate model-data fit and to compare nested models. An AE model was chosen over an ACE model because of prior evidence from standard twin model fitting that the common environment (C) does not have any substantial influence on the fears and phobias, with the possible exception of social phobia (Kendler & Prescott, Reference Kendler and Prescott2006). Furthermore, we compared the fit of the AE and CE models in Mx when the data were treated as continuous variables. The AE model had a better fit than the CE model, providing further justification for our decision to drop C from our model fitting.
After obtaining estimates of the A and E parameters of the Cholesky decomposition model, the estimated Cholesky path coefficients were converted and rescaled into A and E correlation matrices for the 21 phobic stimuli. These correlations matrices were used as input to EFAs in Mplus 5.21. The non-positive definite properties of the A and E correlation structures caused the EFA to be conducted using an unweighted least squares estimator. The promax rotation method in Mplus was used to obtain the oblique rotation of the chosen EFA solution. Oblique rotations allowed us to examine the magnitude of the relationship between the resulting genetic and environmental factors. Tables 1 and 2 show the complete factor loadings for the A and E EFA solutions. Figs 1 and 2 show graphical representations for these solutions.
The EFA of the genetic correlation matrix produced six eigenvalues above unity: 7.53, 2.56, 2.43, 1.57, 1.30 and 1.20. We carefully examined these factor analytic results and the resulting scree plot. The four-factor solution was the most interpretable and was also consistent with an inflection break in the scree plot (Fig. 3).
The EFA of the specific environmental correlation matrix produced eight eigenvalues above unity: 6.31, 2.18, 1.64, 1.38, 1.23, 1.11, 1.03 and 1.01. We examined in detail these factor analytic results and the observed scree plot. The three-factor solution was most interpretable and was consistent with a small inflection break in the scree plot (Fig. 4).
Results
The estimated genetic and environmental correlation matrices for the 21 phobic stimuli are presented in online Supplementary Tables A1 and A2. Table 1 presents the heritability of the individual fears/phobias as estimated from our multivariate model. Heritabilities range from a low of 6% for bugs to a high of 57% for being in crowds. Of the 21 individual fears/phobias, 14 (67%) had an estimated heritability of 30–50%.
Genetic factors
The parameter estimates from the four genetic factors are presented in Table 2 and in Fig. 1. We highlight loadings that explain more than 10% of the total variance (i.e. ⩾0.32).

Fig. 1. Parameter estimates from the best overall model for genetic factors. Four factors were identified using an oblique promax rotation. Only those paths are depicted that account for more than 10% of the genetic variance in liability to the fear/phobia; that is, have a path estimate of ⩾0.316. For all path estimates in the model, see Table 2.
Table 2. Additive genetic factors (factor loadings of ⩾0.32 in bold)

Factor 1 has strong loadings on agoraphobic (going out of the house alone and being in crowds), social phobic (meeting new people, giving a speech, using public bathrooms, and eating in public) and acrophobic stimuli (bridges, airplanes and other high places). Factor 1 reflects the genetic risk to agora-social-acrophobia.
Factor 2 has substantial positive loadings on blood-injury-injection phobic stimuli (blood, needles, hospitals, and diseases). Factor 2 also has significant loadings on snakes, airplanes, public bathrooms, and, marginally, on giving a speech. Although primarily a blood-injection-injury genetic factor, this factor also increases risks for other phobic fears.
Factor 3 has high loadings on animal phobic stimuli (spiders, bugs, mice, bats, and other animals) and also on three social-agoraphobic stimuli (going out of the house alone, being in crowds and meeting new people). This factor also contains a negative loading on fear of airplanes, the only negative loading in our model. Factor 3 best reflects the genetic risk to animal phobia but also less prominently indexes risk to social-agoraphobic stimuli.
Factor 4's strongest positive loadings are for three phobic stimuli associated with closed-in places (tunnels, airplanes and other closed-in places), in addition to bats and hospitals. This factor best reflects the genetic risk to claustrophobia.
Three of the inter-factor correlations are more than 0.30: blood-injection-injury (Factor 2) and claustrophobia (Factor 4) (0.45), animal phobia (Factor 3) and claustrophobia (Factor 4) (0.43), and agora-social-acrophobia (Factor 1) and claustrophobia (Factor 4) (0.35). The three other correlations are all < 0.30.
Environmental factors
The environmental factor loadings differ meaningfully from those seen in the genetic factors (Tables 3 & 4).
Table 3. Unique environmental factors (factor loadings of ⩾0.32 in bold)

Factor 1 has strong loadings on four out of five social and agoraphobic stimuli (all but speaking in public), along with two blood-injury stimuli (hospitals and diseases). The loading on fear of needles (0.30) is moderate. Factor 1 best reflects fear of agora/social and most blood-injury stimuli.
Factor 2 loads most strongly on the animal phobic stimuli (spiders, bugs, mice, snakes, bats, and other animals). It also has prominent but much lower loadings on bridges and other high places. Factor 2 best reflects fear of animals.
Factor 3 has substantial loadings on four acro- and claustrophobic stimuli (tunnels, other closed spaces, bridges and other high places) and fear of crowds. We interpret Factor 3 as reflecting fear of situational phobic stimuli.
The inter-factor correlations between the environmental common factors are: agora-social-injection-hospital phobia (Factor 1) and animal phobia (Factor 2) 0.47, agora-social-injection-hospital phobia (Factors 1) and situational phobia (Factor 3) 0.43, and animal phobia (Factor 2) and situational phobia (Factor 3) 0.52. The correlations between the environmental common factors are generally higher than those between the genetic factors.
Discussion
Our aim was to examine the architecture of genetic and environmental risk factors for individual phobic stimuli. Using multivariate twin analyses of 21 phobic stimuli, we identified four genetic factors (agora-social-acrophobia, blood-injection-injury phobia, animal phobia and claustrophobia) and three environmental factors (agora-social-injection-hospital phobia, animal phobia and situational phobia). To the best of our knowledge, these findings provide the first empirical view of the genetic architecture of human fears/phobias based on a relatively wide range of individual phobic stimuli assessed at clinical interview. We highlight nine important aspects of our findings.
First, our findings suggest that we can reject two extreme etiological models for fears/phobias. Our findings are inconsistent with the hypothesis that fears/phobias of individual stimuli result from genetic and environmental factors unique to that stimulus. Instead, we observed substantial sharing of risk factors across individual fears. Our findings also do not support the approach to phobias in the Feighner criteria (Feighner et al. Reference Feighner, Robins, Guze, Woodruff, Winokur and Munoz1972), which uses a single category of ‘phobic neurosis’. Instead, we observed that not all fears/phobias result from one underlying vulnerability to ‘phobia proneness’.
Second, the genetic and environmental factors we discovered were, by and large, clinically sensible and interpretable. Individual phobic stimuli tend to load together in a manner that shares similarities with the phobia groups that clinicians encounter. However, there are some notable differences from the traditional groups articulated in various versions of the DSM including DSM-5 (APA, 2013). Although our results do not entirely agree with the traditional classifications, they will not be unfamiliar to clinicians.
Third, our results show that the patterns of co-morbidity produced by genetic versus environmental risk factors differ appreciably. This is consistent with prior multivariate genetic analyses of broad areas of psychopathology (Kendler et al. Reference Kendler, Prescott, Myers and Neale2003, Reference Kendler, Aggen, Knudsen, Roysamb, Neale and Reichborn-Kjennerud2011). For example, injection and hospital phobic stimuli cluster with social and agoraphobic stimuli in the unique environmental structure (Fig. 2) but separately in the additive genetic structure (Fig. 1). Similarly, the acrophobic and claustrophobic stimuli cluster together in the unique environmental factors but the claustrophobic stimuli have their own genetic factor. By contrast, the animal phobic stimuli cluster together in both the unique environmental and additive genetic factors.

Fig. 2. Parameter estimates from the best overall model for individual-specific environmental factors. Three factors were identified using an oblique promax rotation. Only those paths are depicted that account for more than 10% of the individual-specific environmental variance in liability to the fear/phobia; that is, have a path estimate of ⩾0.316. For all path estimates in the model, see Table 3. Fear/phobia of needles/injections, giving a speech and blood did not have a substantial loading on any factor and are not shown in the figure.

Fig. 3. Scree plot for genetic factor eigenvalues. There is an inflection point at the third eigenvalue.

Fig. 4. Scree plot for environmental factor eigenvalues. There is an inflection point at the fourth eigenvalue.
Fourth, the genetic risk factors we identified differed in important ways from the phobia typologies proposed in DSM-III, DSM-III-R, DSM-IV and DSM-5. The phobic stimuli associated with agoraphobia, social phobia and acrophobia all loaded together on a single genetic factor. This finding is not without precedent. For example, the DSM-IV criterion A for agoraphobia lists ‘being on a bridge’ as a typical agoraphobic stimulus along with, more broadly, ‘places or situations from which escape might be difficult’, which would probably apply to airplanes, the fear of which also loaded on this factor, and at least some high places. Mellon (Reference Mellon2000) found that fear of heights and tall buildings loaded on the agoraphobia factor in an adult community sample. Marks (Reference Marks1987a , p. 335) reported data on 477 agoraphobics and noted that airplanes are the second, and bridges the eighth, most feared situation. In another sample of 900 agoraphobic women, ‘heights’ was the sixth most commonly listed fear (Marks, Reference Marks1987a , p. 334).
Fifth, our findings do not support the DSM-IV concept of situational phobia. Genetic risk factors for reactions to acrophobic stimuli loaded on genetic Factor 1 and claustrophobic stimuli loaded on genetic Factor 4.
Sixth, our results support the genetic validity of the blood-injection-injury phobia subtype and support the position of Marks (Reference Marks1988) that fear of illnesses is closely linked etiologically to blood-injury fears. Genetic Factor 2 loaded on four other phobic stimuli, at least two of which (fear of public restrooms and snakes) might have a psychologically understandable connection to blood-injury phobias. Anecdotally, fears of using public restrooms are associated with fears of catching a disease, often from ‘dirty toilets’ (Brently, Reference Brently2012). Similarly, it may be plausible to explain that a fear of snakes shares genetic risks for blood-injury fears because the bite of a snake resembles an injection.
Seventh, our findings support an animal phobia subtype. Fear of snakes was the only animal phobic stimulus that did not load on genetic Factor 3. Of interest, our results show a high loading on this factor for fear of going out of the house alone, fear of crowds and fear of meeting new people. Mellon (Reference Mellon2000) also found that fears of strangers loaded on an animal phobia factor.
Eighth, our results show only modest correlation between the four genetic factors. This suggests that only a moderate proportion of the total genetic risk for phobias is non-specific and this proportion of the risk only sets a generally low versus high liability to any form of phobia. Our findings suggest that most of the genetic risk factors for phobias have some specificity for particular phobic stimuli. Although speculative, these results might reflect prior evolutionary pressures; alleles that predisposed carriers to have fearful reactions to particular stimuli might have evolved independently under distinct forms of selective pressure. Although the correlation between the four genetic factors is only moderate, our results are consistent with a background level of genetic predisposition to fearfulness, perhaps under stabilizing selection, that would be likely to influence a much more general vulnerability to fearfulness, as is, for example, captured by the personality trait of neuroticism (Eysenck, Reference Eysenck1962).
Ninth, our analyses provide insight into the structure of environmental risk factors for individual fears/phobias. Some sets of environmental experiences unique to one twin predisposed the twin to having phobic reactions to all animal phobic stimuli (including snakes). We also found that a common set of environmental exposures predisposed individuals to fearfulness of both acro- and claustrophobic stimuli with the exception of fear of airplanes. Acro- and claustrophobic stimuli are on separate genetic factors so this is a clear example of the differential impact of genetic and environmental factors. Our results also show weaker evidence that some kinds of environmental experiences predispose individuals to fearful reactions to most social and agoraphobic stimuli, in addition to fears of hospitals and diseases. This specific pattern was seen in phenotypic analyses of adolescent fears (Muris & Ollendick, Reference Muris and Ollendick2002). It is also noteworthy that our environmental factors had fairly high inter-correlations, suggesting that some kinds of experiences exist that are relatively non-specific, predisposing individuals to a broad array of phobic fears.
Our results may have implications for molecular genetic studies of phobias. We observe modest to moderate correlations between the four genetic factors for fears/phobias. Molecular genetic studies targeting these individual factors should uncover processes contributing to these specific classes of phobias. Studies that examine all phobias as a group will have greater likelihood of uncovering those sets of genes that have a non-specific impact on developing all phobias.
We are unaware of prior studies with a similar methodology to ours. Most similar is a study of twins and their parents by Phillips et al. (Reference Phillips, Fulker and Rose1987) that used factor analysis of phenotypic data to analyze the genetic and environmental contribution to seven fear factors: social criticism, water, dangerous places and organisms, health of self and relatives, social responsibility, heights, and morbid settings. These fear factors are very different from the classification in the DSM-IV and supported a distinct nosology for the phobias. This study analyzed the genetic and environmental contributions to unbiased phenotypes derived from factor analysis of phobic stimuli. Our study analyzes the genetic and environmental factors of unaggregated phobic stimuli. Also in contrast to our study, Phillips et al. (Reference Phillips, Fulker and Rose1987) used self-report questionnaire data on fears rather than a clinical interview and clinical diagnosis of fears and phobias.
Limitations
Our results should be interpreted in the context of 10 potentially significant limitations. First, our sample is limited to adult Caucasian Virginians and may not generalize to other age groups or ethnicities.
Second, although the included phobia subtypes represent many of the common fears/phobias, our list was far from complete. For example, we did not include natural environment types of fears/phobias such as storms, heights, water and other specific fears/phobias included in other studies such as cemeteries, desolate highways, pain, traffic and auto accidents (Phillips et al. Reference Phillips, Fulker and Rose1987; Torgersen, Reference Torgersen1979). The factor structure in this study is dependent on the phobias we analyzed and could be different if we measured additional phobias.
Third, we were unable to formally test, using standard twin model fitting, whether the addition of shared environmental factors would improve the fit of this large multivariate model. Treating the criterion counts and subthreshold and threshold diagnoses as normally distributed, we compared the full model with a model that dropped C and the full model with a model that dropped A. The model dropping C fit much better than the model dropping A. We are assuming that the common environment does not have a substantial impact on the individual phobic stimuli as observed previously with aggregated phobia categories (Kendler & Prescott, Reference Kendler and Prescott2006). Although we cannot rule out a modest degree of confounding of genetic with shared environmental effects, it is unlikely that this confounding is substantial.
Fourth, we determined the number of genetic and environmental factors using the scree plot and clinical interpretation. We could not formally test the number of factors.
Fifth, we were unable to calculate confidence intervals for the individual parameter estimates. In general, our individual parameters are known with only moderate accuracy, with the specific degree of accuracy closely tied to the prevalence rate of the particular fear/phobia.
Sixth, a promax factor rotation was used because the factor structure seemed to visually fit the data best. In addition to the oblique promax rotations, we examined orthogonal varimax and oblique geomin solutions. The main pattern of findings was stable across rotational methods.
Seventh, some of the genetic and environmental factor loadings in our model are greater than one; these result from the additive genetic and unique environmental correlation matrices being non-positive definite. However, the items with these anomalous loadings do load on sensible factors: bugs with animal phobias and tunnels with claustrophobia and situational phobia.
Eighth, we do not take attribution of the phobia into account. Fears that seem to be the same can have different attributions; for example, a fear of airplanes because of a fear of high altitudes, agoraphobic or claustrophobic concerns. Attributions for fears/phobias could have varying genetic and environmental structures that could cause more loadings for each individual fear/phobia or more loadings for each factor. It is possible that attributions have contributed to the genetic and environmental factors but we have no data to address these possibilities.
Ninth, because of the limited power for rarely endorsed fears and phobias, we were unable to estimate results separately in male and female participants. We cannot rule out the possibility that we have averaged results of the two sexes that might meaningfully differ from one another.
Tenth, measurement error is present in the unique environment of twin models. We consider, however, that the environmental factor structure in this model is interpretable and unlikely to be made up entirely of correlated measurement error.
Conclusions
To our knowledge this is the first study to provide a view of the architecture of genetic and environmental risk factors for phobic disorders and their subtypes. The genetic structure of the phobias supported the DSM-IV constructs of animal and blood-injury phobias. However, the data did not support the separation of agoraphobia from social phobia, nor did a coherent situational type of phobia emerge. The patterns of co-morbidity across individual fears and phobias produced by genetic and environmental influences differed appreciably.
Supplementary material
For supplementary material accompanying this paper visit http://dx.doi.org/10.1017/S0033291713003012.
Acknowledgments
This study was supported in part by National Institutes of Health (NIH) grants MH-80828, MH/AA/DA-49492 (UL1TR000058), MH-20030 and MH099785A. The Mid-Atlantic Twin Registry is supported by NIH grant UL1RR031990.
Declaration of Interest
None.