


Introduction
Research into the relationship between leaf form (e.g., leaf size, leaf outline shape, presence or absence of marginal teeth, degree of lobing, leaf apex and base morphology) and climate (e.g., mean annual temperature, precipitation) over the last century has revealed that, for many plant species, physical characteristics vary predictably in response to local environmental variation. Owing to this covariation, there is a physiognomic aspect to the morphological variation in plants that can be exploited to provide information about the environments in which plants grow. This discovery has led, in turn, to the development of a number of proxy-based methods for estimating climate parameters from leaf character-state data (e.g., Bailey and Sinnott Reference Bailey and Sinnott1915, Reference Bailey and Sinnott1916; Wolfe 1993, Reference Wolfe1995; Wilf Reference Wilf1997; Wilf et al. 1998; Spicer et al. 2000; Spicer Reference Spicer2008; Peppe et al. 2011; Royer et al. 2012). The principal application of these approaches has been in paleoclimatology, where the forms of fossil leaves are scored and then used to infer aspects of the regional paleoclimate at known intervals in earth history. In addition to contributing to the documentation of past climate change, such data play important roles in testing the simulation-based climate models used for predicting future patterns of climate change.
All current leaf-based climate inference techniques exploit relationships between leaf morphology and climate variables. One of the most widely used of these is the Climate Leaf Analysis Multivariate Program (CLAMP, see Wolfe 1993 and http://clamp.ibcas.ac.cn/CLAMP_Home.html). The CLAMP method links 31 woody dicotyledonous plant leaf character states to 11 climate variables such as length of growing season, mean annual temperature, growing season precipitation and warm month mean temperature (Wolfe 1993, Reference Wolfe1995; Kovach and Spicer 1996; Gregory-Wodzicki Reference Gregory-Wodzicki2000; Spicer Reference Spicer2000, Reference Spicer2008; Spicer et al. Reference Spicer, Valdes, Spicer, Craggs, Srivastava, Mehrotra and Yang2009; Spicer and Yang Reference Spicer, Valdes, Spicer, Craggs, Srivastava, Mehrotra and Yang2010; Su et al. Reference Su, Xing, Liu, Jacques, Chen, Huang and Zhou2010; Steart et al. Reference Steart, Spicer and Bamford2010; Jacques et al. Reference Jacques, Sub, Spicer, Xing, Huang, Wanga and Zhoub2011; Spicer et al. Reference Spicer, Bera, De Bera, Spicer, Srivastava, Mehrotra, Mehrotra and Yang2011; Yang et al. 2011). All CLAMP leaf character states are based on characteristics of the leaf outline. Since leaf outlines are highly suitable for analysis by standard image-processing and pattern-recognition techniques there has been a long-standing interest in the use of morphometric methods to inform and augment traditional inspection-based leaf character-identification techniques (Reference MacLeodMacLeodReference MacLeod2002aReference MacLeod2005; Clark et al. Reference Clark, Corney and Tang2012; Cope et al. Reference Cope, Corney, Clark, Remagnino and Wilkin2012; Corney et al. Reference Corney, Tang, Clark, Hu and Jin2012a,Reference Corney, Clark, Tang and Wilkinb).
A number of previous reports have demonstrated the feasibility of automated image recognition and processing systems to detect simple presence/absence leaf characters (e.g., presence or absence of leaf teeth; see Cope et al. Reference Cope, Corney, Clark, Remagnino and Wilkin2012; Corney et al. Reference Corney, Tang, Clark, Hu and Jin2012a,Reference Corney, Clark, Tang and Wilkinb and references therein). However, to date, no automated system has proven successful in identifying any of the standard set of leaf physiognomic characters used in routine CLAMP analyses.
The goal of automating the assessment of leaf morphology is not an idle or abstract exercise in delivering information that can already be delivered by traditional means. For the CLAMP method to result in accurate (paleo)climate inferences, correct and consistently scored leaf character-state data are required. At present a major rate-limiting factor in the generation of CLAMP calibration data sets is the time taken to manually process, analyze, identify, score, and record the character states of the leaf specimens collected. In addition, a related issue of particular recent concern is the apparent lack of repeatability and verification of manually scored results due to investigator time and effort constraints (Wilf Reference Wilf1997; Wieman et al. Reference Weimann, Manchester, Dilcher, Hinojosa and Wheeler1998; Green 2006). Few, if any, CLAMP researchers ever re-score their calibration data sets, either to verify their own accuracy, or check the accuracy of previously published calibration data sets against the photo or herbarium sheet records of the original leaf specimens, in spite of concerns raised about some of character states potentially being defined in an ambiguous manner (see Peppe et al. 2010 and references therein). This approach to CLAMP leaf-character scorning has become established not because CLAMP practitioners believe such verification is unwarranted, but because doing so would make CLAMP analyses (and its equivalents) impractically time consuming and labor intensive to perform. As a result, the number of scoring errors, and the affect of these errors on the results of virtually all CLAMP analysis published to date (incl. CLAMP calibration datasets) are unknown.
Spicer and Yang (Reference Spicer, Valdes, Spicer, Craggs, Srivastava, Mehrotra and Yang2010) touched upon this issue, when they compared differences in CLAMP leaf-character scoring from the same floral locality by eight pairs of novice users during a summer school training activity. The method used by Spicer and Yang is unclear, but so far as can be inferred from their description they compared the standard deviation(s) of the CLAMP estimates for climate variables such as mean annual temperature and enthalpy for the eight sets of student results to the standard deviation of the regression residuals for the CLAMP Phys3GBR calibration dataset. This exercise concluded that the variation measured “was less than that inherent to the CLAMP statistical methodology”. While this result is encouraging, it only addresses levels of inferential precision achieved in character identification for a particular CLAMP dataset. However, it should be noted that the few well-designed and managed genuine blind test trials of expert morphological identifications for other organismal groups have not returned such encouraging results (e.g., Zachariasse et al. Reference Zachariasse, Riedel, Sanfilippo, Schmidt, Brolsma, Schrader, Gersonde, Drooger and Brokeman1978; Ginsberg Reference Ginsburg1997a,Reference Ginsburgb and references therein).
The issue of repeatability is also of particular concern as being able to repeat an experiment and obtain consistent results is a core principle of all scientific investigation (e.g., Godfrey-Smith Reference Godfrey-Smith2003). Efforts to minimize observer errors often constitute an important incentive for improving scientific technique. Indeed, institution of new error-minimization strategies often leads to new discoveries (ibid). The advent of rapid, accurate, and automatic image processing/identification systems that can operate under real-world conditions has the potential to enable a rapid expansion in the size and scope of CLAMP data sets, thus improving our understanding of how different vegetation types respond to climate as well as improving the accuracy of paleoclimate inferences and reconstructions.
With regard to this concern, it is widely assumed that specimen character scoring by experienced practitioners is accurate. Experts in the identification of biological species often claim accuracies of greater than 90 percent (Culverhouse et al. Reference Culverhouse, MacLeod, Williams, Benfield, Lopes and Picheral2013). Nonetheless, it is clear from the human cognition literature this level of performance is unlikely, either in principle or in practice (see Culverhouse et al. Reference Culverhouse, Williams, Reguera, Herry and González-Gil2003; Reference Culverhouse, MacLeod, Williams, Benfield, Lopes and Picheral2013). For example, Sokal (Reference Sokal1974) showed that experts usually make up their own rules for placing specimens into groups, leading inevitably to inconsistencies in identification assignments. Within the taxonomic and ecological communities it is acknowledged widely that expert taxonomists are either 'lumpers' or 'splitters' and will preferentially place an unknown specimen either in an existing group known to be present in the sample, or in a new group based on personal preferences. This well-known and constantly remarked upon dichotomy, by itself, leads to inconsistencies between the identifications made by investigators of different philosophical persuasions.
Psychophysical studies also provide the empirical and mechanistic background for suspecting that human visual and cognition systems will always struggle to provide consistent, high-quality, taxonomic identifications. Human performance in sorting objects into groups is known to be affected by several well-understood psychological factors (Evans, Reference Evans1987), including (1) short-term memory, which has a limit of 5–9 items, (2) fatigue and boredom, (3) recency effects whereby a new classification is biased toward those in the set of most recently used labels and (4) positivity bias, whereby a specimen’s identification is biased by expectations of the object categories likely to be present in the sample. It is also widely appreciated that fatigue sets in quickly during work that involves highly repetitive tasks (Coquhoun Reference Colquhoun1982) and is enhanced by fluctuations in ambient temperature, ambient noise, difficulty of signal detection and loss of sleep (see Colquhoun Reference Colquhoun1959). As a result of these factors, very high levels of identification mistakes can arise in quite short periods of time, even among experts (e.g., Fox Reference Fox1971).
In principle all the aforementioned phenomena can, and do, lead to error and inconsistency in both specimen and character-state identifications. Culverhouse et al. (Reference Culverhouse, Williams, Reguera, Herry and González-Gil2003) explored the consensus of expert identifications of a phytoplankton sample empirically. Out of 210 specimens, participants could only return a 100 percent agreement on the species’ identity in 66 percent of the samples. Indeed, in the most recent study focusing on biological identifications by experienced taxonomic experts, variation in self-consistency ranged from 4–98 percent (averaging 75.14%; SD±32.80%; Culverhouse et al. 2014; see also Reference MacLeodMacLeod et al. Reference MacLeod, Benfield and Culverhouse2010). Culverhouse et al. (Reference Culverhouse, Williams, Reguera, Herry and González-Gil2003) go so far as to state that human performance in taxonomic identifications of well below 100 percent must be acknowledged as normal in scientific enquiry. More to the point, a survey of the recent CLAMP literature reveals recurrent concerns regarding inconsistencies in character scoring (see Wilf Reference Wilf1997; Wiemann et al. Reference Weimann, Manchester, Dilcher, Hinojosa and Wheeler1998; Green 2006; Peppe et al. 2010, 2011 and references therein). Use of automation to support – or possibly to replace – manual leaf-scoring systems represents a highly constructive method of addressing these concerns, provided such systems can return accurate results.
Below we report results of a performance tests for a simple, image-based, morphometric system designed to assess five standard CLAMP leaf character states: leaf apex type, leaf base type, leaf shape leaf lobing type, and leaf length/width ratio. Our primary goal was to determine whether a generalized, computer vision-based system using “off-the-shelf” technology can be used to automate the scoring of CLAMP characters. In addition, this investigation addresses the following issues.
1. The extent to which digital images (as opposed to sets of morphometric variables such as linear distances or landmark locations) can be used directly as a basis for quantitative leaf-character analysis.
2. The degree to which CLAMP characters can be regarded as being composed of a discrete assemblage of geometrically unified states.
3. The degree to which CLAMP characters defined currently are confounded with other geometric aspects of leaf form.
4. The appropriateness of linear discriminant analysis as a means of (a) defining the states of CLAMP characters and (b) placing images of unknown specimens in their correct CLAMP character-state categories.
Materials and Methods
The leaves used for this study were collected mostly at Karee Kranz, South Africa, elevation, 1,270 m; location, −25.57° Lat., 26.88° Long. A total of c. 20 leaves from 22 native plant species growing in undisturbed vegetation were collected from low stature woodland, classed as SVcb4 under the system of Murcina and Rutherford (2006). These plants grew on a sunny, north-facing slope in the Dwarsberg-Swartruggens Mountain Bushveld. All leaves were collected following protocols described by Wolfe (1993) and detailed on the CLAMP website (http://clamp.ibcas.ac.cn/CLAMP_Home.html). All leaf specimens were pressed, vouchered, identified to species level and photographed. Depending on size, up to 20 leaves were imaged per photo with each photo including only the leaves of a single species.
Various levels of damage are present in some leaves. This damage arose from a variety of causes (e.g., insect grazing, disease, developmental malformation) and undoubtedly are a factor that needs to be dealt with when scoring leaves for CLAMP characters. Accordingly, no attempt was made to correct training sets for minor to moderate amounts of leaf damage. This allowed training set sample sizes to be maximized and served to ensure our training set was fully representative of training sets that could be assembled at other CLAMP validation localities. Steart et al. (Reference Steart, Spicer and Bamford2010) provides other details regarding these leaves and their collection localities.
Digital images of each leaf were split into their separate RGB color channels and each channel thresholded to remove as much background pixel variation as possible. Each digital leaf image was then edited manually to remove any remaining background variation. Shadows surrounding the leaf margins were also removed.
Digital images of individual leaves were then segmented from the background, adjusted to a constant spatial resolution, converted to 8-bit binary greyscale bitmaps, and written to an image file in the tagged image file format (TIFF) without compression. This set of processed images (all of which can be accessed at: http://datadryad.org/resource/doi:10.5061/dryad.mk4f8) constitutes a library from which all training sets used for this investigation were assembled. Whole-leaf images were used for the leaf shape, lobing, and aspect ratio characters. In the case of leaf apex and leaf base an automated feature-extraction procedure was developed to extract these parts of the leaves that in a standardized manner (see below).
Specific image resolutions required for each character were determined by a series of experiments that were performed for each leaf character. These experiments estimated the resolution needed to represent the geometry of the character state accurately with the minimum number of total image pixels. Once this resolution estimate was obtained all leaf images (whole or segmented) were (1) trimmed to remove any unnecessary background, (2) scaled to a constant size (=length), (3) aligned to the training set grand mean image to standardize their orientation, and (4) down-sampled to the required spatial resolution using automated image processing algorithms (see Appendix 1 and supplemental files). Following this procedure each image was reformatted to represent the leaf image as a column vector of 8-bit monochrome brightness values and exported as an ASCII text file. Each position in this vector corresponded to the same pixel across the image frame for all images comprizing the training set for that character, enabling the outline geometry of each leaf to be compared. The result of these image-processing operations was to standardized the image sizes, image resolutions, image orientations, frame (=image matrix) sizes and reduce the spatial autocorrelation of the leaf-image data.
Once these datasets had been assembled an image covariance matrix was calculated for each training set based on a comparison of greyscale brightness values for each pixel location across all members of the character-state training set. This matrix was then decomposed into eigenvectors and the projected positions of each image on the first n eigenvectors — with n being the number required to represent 95 percent of the observed shape variation within the training set — recorded. The purpose of this step was to reduce the dimensionality of the leaf image data and ensure the statistical independence of the resultant set of (latent) shape variables.
Following projection of these leaf image data into the reduced image space canonical variates analysis (CVA) was used to optimize a priori character-group distinctions within the training set and to serve as a basis for testing hypotheses related to the statistical significance of character-group separations. This was achieved by comparing projected positions of individual training set leaf images in the discriminant space with the positions of a priori-defined character-state group centroids and noting which centroid (=group) the projected image’s position was closest to. Note that, for those characters in which many states have been defined, the dimensionality of the discriminant space may exceed three in which case it was not possible to illustrate the complete geometry of the space in a set of two-dimensional scatterplots. In such cases tabulated results of image proximity values are a more reliable guide to overall group distinctiveness (and discriminate system performance) than scatterplots of canonical variate scores.
Mitteröcker and Bookstein (Reference Mitteröcker and Bookstein2011) have noted recently that, for datasets whose dimensionality exceeds the number of specimens used to define the discriminant space (= underdetermined data matrices), CVA may be able to separate any set of a priori-defined groups into mutually exclusive regions within the discriminant space, even those composed of values drawn randomly from a single statistical population. This phenomenon results from the fact that within any high-dimensional space defined on the basis of a comparatively small number of data points there will usually be a set of axis orientations that will appear to separate the groups cleanly. If such results are accepted naïvely this is indeed a matter of concern when using CVA to assess group distinctiveness with morphometric data where it is often the case that the number of specimens in a dataset is much smaller than the number of variables used to characterize those specimens. However, in their 2011 article Mitteröcker and Bookstein neglected to mention that both parametric and non-parametric data analysis strategies exist whereby the expected degree of between-groups separation in the CVA space can be assessed empirically for any dataset using either Monte Carlo simulations or bootstrap-resampled data. Either of these strategies will enable the distribution of any between-groups separation statistic to be compared to expectations both of random sampling error and/or of introduced CVA artefacts (see Manley Reference Manly1997; MacLeod 2015). In our investigation both Monte Carlo simulation and bootstrapping tests were employed to assess the significance of observed leaf character-state group separations against these null models. The PCA-based dimensionality-reduction step in our procedure also mitigates against problems that might arise in the interpretation of CVA results due to dataset dimensionality issues. Tests of this procedure indicate a combined PCA-CVA data analysis strategy performs better in separating groups defined by morphometric data than Mitteröcker and Bookstein’s (Reference Mitteröcker and Bookstein2011) suggested alternative, between-groups PCA (MacLeod 2015). Finally, the robustness of post hoc identification results obtained via discriminant analyses of our leaf-character state training sets was assessed empirically using a ‘leave-one-out’ jackknife resampling procedure (Manley Reference Manly1997).
Throughout our analysis we employed an identification accuracy of 90 percent as the level regarded as comparable to accuracies that might be obtained by human experts working under optimal conditions. This represents quite a stringent test criterion as few blind tests have recorded expert identification accuracies this high (see Culverhouse 2003; Culverhouse et al. 2014 and references therein).
Results
Leaf Base
The leaf base training set consisted of 325 leaves in total, of which 176 exhibited the acute morphotype, 59 the cordate morphotype, and 90 the round morphotype (Fig. 1). In order to focus the analysis on the basal region an automated image-processing algorithm was developed that cropped the leaf silhouette image to the lower 15 percent on the leaf blade. This algorithm also aligned the leaf images relative to each other, down-sampled the scaled images to a constant resolution, and fit them to a 15×50 pixel grid. After processing, each leaf base image was represented by a column vector consisting of 750 discrete brightness values. As the same processing procedure was applied to all leaves in the sample each brightness value can be regarded, effectively, as a complex semilandmark incorporating information on the distribution of brightness values at topologically homologous positions across the image frame.

Figure 1 CLAMP leaf physiognomic characters and character states from the Karee Kranz area, South Africa illustrated with representative leaf silhouettes. Numbers in parentheses are sample sizes.
After alignment, the structure of leaf base shape variation across the training set was summarized via calculation of a pairwise shape covariance matrix which was then decomposed into a series of eigenvectors (=latent shape variables). Since the lengths of these eigenvectors (=eigenvalues) form a monotonically decreasing function that expresses the total amount of shape variation observed across all training-set images, the projected positions of individual leaf base images onto them can be used to re-express the structure of shape variation in the training set using a smaller number of variance-optimized, geometrically independent shape variables than the 750 image frame variables. For this character it was possible to reduce the dimensionality of the dataset to 28 latent image frame variables while preserving 95 percent of the structure of the original data, a dimensionality reduction ratio of over 96 percent. These 28 latent variables served as the basis for the leaf base discriminant analysis.
The leaf base dataset was subdivided initially into three groups (acute, cordate, round) to reflect the standard CLAMP character states. Results for the CVA of these leaf base images are shown in Figure 2 which, represents the complete leaf base discriminant space. This three-group partition achieved good results insofar as group centroids are well separated with the majority of data points occupying unique fields within the space. Notably, cordate leaf bases appear to occupy a considerably larger area (=range of morphologies) within the discriminant space than either the acute or round groups. All shape-variation fields within this space exhibit a comparatively small region of overlap in the middle portion of the space. However, when inferred group membership was assessed post hoc as it would be if these training set leaves were submitted as unknowns (via proximity to group centroids), this overlap region compromised the identification of only 45 (13.85%) of the training-set leaves.

Figure 2 Discriminant space for the leaf base image training set formed from the canonical variates of the reduced set of the pooled sample image eigenvectors partitioned a priori into states based on traditional CLAMP character-state definitions (see Fig. 1). Individual points represent positions of each training set image projected onto the two orthogonal discriminant functions.
If the full 750-variable image frame dataset had been used as the basis for the CVA there would be ample reason to regard this result as suspect, a by-product of the well-known “curse of dimensionality” (Belman Reference Belman1961; Zimek et al. Reference Zimek, Schubert and Kriegel2012). Use of eigenanalysis as a mathematical transform to pack the geometric information content of the leaf base images into a smaller number of variables greatly mitigates this effect, but does not eliminate it entirely. As a result, additional steps must be taken to assess this CVA result for artefacts of interactions between the number of variables, the total number of specimens in the training set, and the number of specimens in each group.
The log-likelihood ratio (LLR) provides a standard statistical index of separation between group centroids relative to their dispersions (Manley Reference Manly1994). For the leaf base training set the LLR value (ϕ) is 626.40. In order to determine whether this value is higher than would be expected for a sample drawn randomly from a single distribution a Monte Carlo simulation strategy was employed (see Manley Reference Manly1997) by drawing values randomly from a set of normal distributions with identical ranges, means and standard deviations as the pooled leaf base PC variables and subjecting this random dataset to a CVA-LLR analysis identical to that used in the analysis of the actual leaf-base data. This simulation was repeated 1,000 times and the resulting distribution of ϕ values used as a basis of comparison to evaluate the (null) hypothesis that the observed ϕ value for the leaf-base data falls within the range expected for a random sample drawn from a single population. Results of this test indicate there is a very small (α<<0.0001) probability that group separations of the magnitude observed for this training set could arise as an artefact of the discriminant analysis procedure.
In addition to Monte Carlo simulation analysis, a bootstrap test of these same data was performed to determine whether relaxation of the assumption of data normality would alter the result. Accordingly, 1,000 bootstrap pseudoreplicate datasets were assembled via random selection of individual PCA score sets from the pooled dataset (irrespective of the actual group assignment) and each of these subjected to an identical CVA-LLR analysis. Again comparison of the observed ϕ value for this training set with the distribution of 1,000 bootstrap-pesudoreplicate ϕ values indicated there is a less than a 1 in 10,000 chance that group separations of the magnitude observed for this training set could arise as an artefact of the CVA procedure.
An identification accuracy ratio of 84.92 percent was obtained for this dataset using the standard, post hoc, proximity-to-the-group- centroid index. While this estimate is encouraging, the fact that this test essentially measures the degree to which the training set can be used to identify itself suggests this figure should be treated with a fair degree of skepticism. As it was not possible to collect a new test set of leaves from this locality, a more robust estimate of the stability and accuracy of these discriminant functions can be obtained through use of a “leave-one-out” jackknife analysis (Manley Reference Manly1997). When this test was applied to the Karee Kranz leaf-base data the correct post hoc identification ratio fell to 81.85 percent. This decrease indicates that the discriminant functions calculated on the basis of the three-group leaf-base model, while adequate for demonstrating the extent and character of group-separation between these three character-state groups, are somewhat unstable in the face of elimination of even a single specimen from the training set.
The decline in generalized identification performance probably reflects heterogeneities in the leaf-base group sizes and/or the wide range of leaf base morphologies included in the sample. Human experts can readily pick out the subset of characters that define acute, cordate, and rounded leaf base morphotypes from the other types of shape-based information found in individual leaf geometries (e.g., breadth/narrowness, symmetry) simply by ignoring these extraneous geometric factors. Lacking the critical components of experience, training, and intelligence, computer algorithms have a much more difficult time separating the taxonomic signal-of-interest from other geometric ‘noise’ in their calculations. Consequently, lack of stability in the three-group discriminant result may, in a general sense, reflect nothing more than the fact that the CVA procedure was asked to work against the natural range of geometries present in the dataset by attempting to find a linear function that separated shapes united by the ‘extraneous’ factors of broadness, narrowness, and symmetry into the different leaf base character-state groups over spatially contiguous, but geometrically disjunct, domains within the discriminant space.
An alternative training-set specification strategy that corrects this experiment-design problem can be formulated by recognizing that there is no reason why acute, cordate, and rounded morphologies must be gathered together into contiguous domains in order to be identified. Broad leaves can exhibit acute, cordate, or rounded bases as can narrow leaves, symmetrical leaves, and/or asymmetrical leaves. So long as a set of shape-space regions can be associated with acute, cordate, and rounded morphologies there is no need for any regions so designated to be contiguous with one another in order to be useful for character-state identification. Indeed, relaxing this contiguity requirement may serve not only to improve the discrimination accuracy and the robustness of the result, but also enable construction of a space whereby a greater variety of leaf base characters can be identified accurately.
The most straightforward manner of implementing this alternative view of the leaf-base character-state identification problem involves subdivision of the leaf-base training set groups into a subsets of mutually exclusive multi-state groupings (Fig. 3) and then submitting this regrouped set to CVA. Results of a CVA for this a set of ten character-state groupings formulated in the manner described above are shown in Figure 4.

Figure 3 Expanded set of CLAMP leaf base character states used in this analysis with examples illustrating these categories drawn from the training set. This expanded character subdivision allows aspects of leaf breadth and leaf symmetry to participate in placement of shape groups within the discriminant space while still retaining the ability to associate disjunct regions of that space with character states of interest uniquely.

Figure 4 Discriminant space for the leaf base image training set formed from the canonical variates of the reduced set of the pooled sample image eigenvectors partitioned a priori into states based on the expanded set of CLAMP character-state definitions (see Fig. 3). Individual points represent positions of each training-set image projected onto two orthogonal discriminant functions. As the four figures illustrated here represent arbitrary slices through a 9-dimensional discriminant space (36 unique slices in total) character-state groups that appear to overlap in these plots may be separable along other discriminant axes. Nevertheless, note the disjunct distribution of subdomains associated with the acute (red, pink, magenta, purple), cordate (blue, light blue, cyan) and round (green, yellow, orange) leaf base morphologies. These distributions are the result of non-CLAMP morphological attributes (leaf breadth, leaf symmetry) that are associated with, but not part of, the CLAMP leaf base character. Discrimination between traditional CLAMP leaf base character groups can be improved by recognizing the need to incorporate disjunct character-state distributions into the automated identification strategy.
This figure shows how serious a challenge interference between leaf physiographic characters can be for linear automated character identification strategies as well as explaining the poor results achieved by the original analysis. Although the plots in Figure 4 appear to show broad areas of overlap between many shape groups, it must be remembered that this expanded character state dataset specifies a nine-dimensional discriminant space, only a few example pairwise comparisons of which are illustrated in Figure 4. While these plots do not represent the full range of specimen ordinations within this nine-dimensional space, they do show strong and consistent segregation between many character states along the axes chosen for representation (e.g., cordate-broad-symmetrical, cordate-broad-symmetrical, cordate-narrow-symmetrical). A comprehensive assessment of group separations in this nine-dimensional discriminate space can be made by re-classifying the training set retrospectively via linear proximity of projected locations within the space to the location of each expanded character-state centroid and comparing those retrospective identifications to the original expert-determined identifications.
When the expanded coding scheme is employed the statistical significance of group separations (as indicated by Monte Carlo and bootstrap simulations) was not only retained, it was improved. Under the ten-group partition scheme the observed leaf base ϕ index rose to 2,963.00; almost an order of magnitude larger than the largest ϕ-value obtained from either the Monte Carlo or bootstrapped simulation analyses. The raw accuracy of post hoc leaf base character state group identifications declined from 84.92 percent to 72.62 percent. However, these results are, strictly speaking, not comparable as the latter includes misidentifications of non-leaf-base characteristics. When the discriminant space is partitioned into non-contiguous regions based on the three traditional CLAMP leaf-base character states a greatly improved correct identification ratio of 87.38 percent was obtained. This result takes advantage of the fact that the expanded leaf-base character categories (i.e. broad acute versus narrow acute etc.) have well-defined and discreet, but non-contiguous distributions within this discriminant space. There is little overlap between the point clouds associated with each of these new and more geometrically nuanced character states, even though they are closely packed within that space. This enables the discriminant functions to partition the traditional CLAMP leaf base character states in a more effective manner than was possible under the traditional CLAMP three-state character model. More importantly, the stability of the discriminant functions, as indicated by the results of jackknife tests of identification accuracy, rose to 83.69 percent.
To be sure, this remains a preliminary result. Sample sizes of the cordate and round character-state groups should, ideally, be increased. Identification accuracy tests should also be performed on additional leaf morphologies before these discriminant functions can be used to place leaf base morphologies into CLAMP character groups with confidence on a routine basis. Nonetheless, these results provide strong support for the proposition that automated data analysis strategies based on the information provided by leaf images themselves can deliver both very high and stable levels of character-state identification accuracy; perhaps only marginally less accurate than results that could, in principle, be delivered by human experts working under optimal conditions. In addition, these results suggest that situations involving complex patterns of morphological interference between distinct leaf physiognomic characters can be handled successfully within the context of a strictly linear discriminant analysis strategy by relaxing the implicit requirement of discriminant group contiguity.
Leaf Apex
The leaf apex analysis was, in many ways, the mirror of the leaf base analysis. The training set was smaller (n=37) and comprised only the two standard CLAMP character states: acute-tipped leaves (19) and attenuate-tipped leaves (18). As above, an image processing algorithm was created to crop (upper 15%), down-sample, scale, and align the cropped images to fit a standard 18×50 pixel grid. This resulted in the shape of each leaf tip being represented by a column vector containing 900 discrete pixel brightness values representing the entire image frame. A covariance-based eigenanalysis of this data matrix was used to reduce the dimensionality of this dataset to 11 latent variables which together represented over 95 percent of the shape variance; a data dimensionality reduction of over 98 percent. These 11 latent variables then served as the basis for the leaf apex discriminant analysis.
When grouped into the two traditional CLAMP leaf apex character states a single discriminant function was defined which, for this dataset resulted in a 100 percent accurate post hoc discrimination (Fig. 5A) along with favourable probability estimates that the observed ϕ value (83.06) could be generated by random sampling either from a normal distribution with mean and variance identical to the pooled training set (Monte Carlo simulation test, α<<0.0001) or from the training set data itself (bootstrap test, α<<0.0001). Application of the leave-one-out jackknife test resulted in a reassuring maintenance of the 100 percent post-hoc discrimination indicating that the discriminant function is stable. Such a high performance result is no means unusual in discriminant analyses undertaken on small samples. While these samples might be representative of local floral conditions, there are grounds to suspect situations at other localities may be more complicated. For this reason, and to explore the capabilities of the extended character subdivision strategy, it was decided to subject this character complex to additional analysis.

Figure 5 Discriminant plots for the leaf apex image training set formed from the canonical variates of the reduced set of the pooled sample image eigenvectors partitioned a priori into states based on traditional CLAMP (A) and expanded CLAMP (B) character-state definitions (see Fig. 1). Bar heights in the traditional CLAMP leaf apex character discrimination result (A) represent frequencies of points falling into bin intervals along the single discriminant function. In B the positions of each training-set image projected onto the two orthogonal discriminant functions are shown. Note the disjunct nature of the attenuate-tipped leaves in the expanded discriminant analysis result (B) depending on whether the overall leaf breadth was broad or narrow. This geometric distinction is not present in the CVA of the traditional CLAMP leaf-apex discriminant result (A) because the CVA technique attempts to render all groups contiguous. This by-product of the linear discriminant analysis is also responsible (in part) for instabilities in discriminant function orientation.
Because of the limited sample used for this investigation it was only possible to subdivide the attenuate group into narrow and broad morphotypes as all training set leaves designated acute were narrow in overall aspect. The distribution of these three groups into a discriminant space calculated on the basis of these three groups is shown in Figure 5B.
As a consequence of this minor extension of the character-state classification scheme the CVA maintained excellent results with clear separation between all three character subgroups. It is particularly noteworthy that this discriminant result distinguished between the two attenuate groupings cleanly, indicating that — for this training dataset at least — there is a clear and consistent morphological distinction between them. The strength of this separation was not apparent in the two-group leaf apex result based on traditional CLAMP morphometric groupings (see Fig. 5A).
Given the extent of the between-groups leaf apex differences shown in Figure 5B it should come as no surprise that 1,000 pseudoreplicate Monte Carlo and bootstrap tests of the leaf apex discriminant ordination based on the expanded groups dataset yielded favourable results (α<<0.0001 in both cases). This indicates there is little chance a ϕ value as large as the observed value of 197.7 could be obtained from this, or any similar, dataset via random sampling either from a normal distribution or via random selection from the pooled training-set data. When the stability of these discriminant functions was tested using the “leave one out” jackknife approach, the identification accuracy ratio of 100 percent was retained for these leaf apex image data — for all three expanded character state groups and, by extension, for the two standard CLAMP leaf apex character state groups.
While these results, like those for the leaf base images, are very encouraging with regard to the possibility of being able to construct an automated system that will deliver accurate, consistent, and reproducible leaf apex identifications from images, they should, nevertheless, be regarded as preliminary. The overall sample size for this character was decidedly small and all specimens were obtained from a single sampled locality. A larger sample might return a less-than-perfect result.
What can be stated unequivocally, however, is that assembling the leaf apex data into broad and narrow subgroupings enabled the linear CVA algorithm to achieve greater flexibility in defining regions of the leaf apex shape space characteristic of acute and attenuate morphologies than was possible used data grouped into the traditional CLAMP leaf apex character states. This expanded categorization in no way changes the definitions or the utility of the traditional CLAMP character states. It simply reflects a practical step that allows the linear discriminant algorithm to do what humans do subconsciously — group narrow attenuate-tipped leaves and broad attenuate-tipped leaves into a single group in the presence of (narrow) acute-tipped leaves, as opposed to (say) grouping all narrow leaves together irrespective of their tip geometries.
Leaf Shape
Unlike the previous two CLAMP characters, leaf shape takes the entire leaf into consideration subdividing the leaf population into three generalized states: ovate, elliptical and obovate. The Karee Kranz training set for this character consisted of 115 leaves: 92 elliptical, 14 obovate, and 9 ovate (see Fig. 1). While this might appear quite an unbalanced training set in terms of dominance relations, it is both characteristic of the relative abundance of leaf shape types at the Karee Kranz locality and representative of a large number of CLAMP reference localities generally.
No image cropping was necessary for this analysis. Otherwise, the automated image processing procedure used for this training set was the same as outlined above. All images were aligned, down-sampled, fit to a standardized 50×50 pixel image grid, and exported to a column vector containing 2,500 discrete pixel brightness values. Once again, an eigenanalysis of the resulting pixel-brightness covariance matrix reduced the dimensionality of these data to 29 latent variables which together represented over 95 percent of the information content of the image set. These 29 latent variables served as the basis for training the leaf shape discriminant system.
If the traditional three CLAMP leaf shape character states are used to formulate the leaf shape discriminant space two discriminant functions are defined (Fig. 6). These support a raw, post hoc training-set identification accuracy of 99.13 percent with a low probability that the observed ϕ value (415.90) could be generated by random sampling either from a normal distribution with mean and variance identical to the pooled training set (Monte Carlo simulation test) or from the training set data itself (bootstrap test; in both cases α<<0.00001). Nevertheless, as with the previous two CLAMP character analyses, when the stability of the single discriminant function was tested using a jackknife strategy a small accuracy decrease resulted, in this case to 93.04 percent.

Figure 6 Discriminant space for the leaf shape image training set formed from the canonical variates of the reduced set of the pooled sample image eigenvectors partitioned a priori into states based on traditional CLAMP character-state definitions (see Fig. 1). Individual points represent positions of each training set image projected onto the two orthogonal discriminant functions.
The traditional CLAMP leaf shape definition does not take leaf width into explicit consideration despite the fact that this is quite an important aspect of overall leaf shape. Leaf symmetry represents another leaf-shape factor ignored by the traditional CLAMP leaf-classification scheme. Since we wish to ensure our discriminant analysis results are not compromised by shape factors extraneous to the consideration of overall leaf shape in the CLAMP system it was necessary to define multiple subcategories of each leaf shape type in order to accommodate normal modes of leaf shape variation. The subcategorizations used for our analysis is illustrated in Figure 7. [Note: no narrow obovate leaves were included in our study set.]

Figure 7 Expanded set of CLAMP leaf shape character states used in this analysis with examples illustrating these categories drawn from the training set.
As before, this expanded character classification allowed us to define disjunct geometric regions of the leaf outline discriminant space that characterize each of the three primary CLAMP leaf shape characters. When the 115×29 matrix of eigenscores for these leaf shape images were coded for the expanded leaf-shape character group categories six discriminant axes were returned. A scatterplot of the leaf shape discriminant shape subspaces formed by these eigenvectors is shown in Figure 8.

Figure 8 Discriminant space for the leaf shape image training set formed from the canonical variates of the reduced set of the pooled sample image eigenvectors partitioned a priori into states based on the expanded set of CLAMP character-state definitions (see Fig. 7). Individual points represent positions of each training-set image projected onto two orthogonal discriminant functions. As the four figures illustrated here represent arbitrary slices through a 6-dimensional discriminant space (15 unique slices in total) character-state groups that appear to overlap in these plots may be separable along other discriminant axes. Nevertheless, note the disjunct distribution of subdomains associated with the elliptical (red, pink, magenta, purple), Ovate (blue, cyan) and obovate (yellow) leaf shape morphologies. These distributions are the result of additional morphological attributes (leaf width, leaf symmetry) that are associated with, but not part of, the traditional CLAMP leaf shape character. See text for discussion.
Group centroid separations for this seven-group solution are marked and, as assessed by the ϕ statistic (1,224.00), significantly greater than would be expected for a seven-group canonical variate result drawn randomly either from a single normal distribution or from the training set distribution itself as assessed by 1,000 pseudoreplicate simulations under both Monte Carlo and bootstrap sampling protocols (in both cases α<<0.00001). The raw character-state identification accuracy for this regrouped training set was 96.52 percent of specimens identified accurately post hoc. When these counts are amalgamated to reflect the three traditional CLAMP characters this accuracy rose to 99.13 percent. Even more importantly, the orientations of these between-groups discriminant functions are stable under modification of the training set. A jackknife assessment of this stability returned a raw accuracy ratio of 91.30 percent and an amalgamated accuracy ratio of 97.39 percent. These identification accuracies are at least as great as could be expected from human experts (based on published data) and in all likelihood far better than would be expected on average. Moreover, it should be noted that this leaf shape training set included specimens that exhibited typically variable states of preservation, damage, and inconsistency including variations in the orientation and completeness of petioles, presence of insect and disease damage, pressing artefacts, etc.
Leaf Lobing
As with leaf shape, leaf lobing requires analysis of the entire leaf margin. However, leaf lobing is the more generalized character and so does not require as highly structured a discriminant space to facilitate the separation of lobed from unlobed leaf outlines.
This training set consisted of 126 leaves, 18 exhibiting various states of lobing and 108 consisting of unlobed margins. Drawing on experience gained with the previous analyses, this leaf image set was divided into four character states: lobed, unlobed-narrow, unlobed-proportionate, and unlobed-broad (see Fig. 9). Since the master training set possessed limited numbers of lobed and unlobed-broad leaf silhouettes (18 and 15 silhouettes respectively), a subset of leaf shapes was selected randomly from the unlobed-proportionate and unlobed-narrow groups in order to ensure that group sample numbers were broadly comparable. These latter two groups contained 57 and 36 silhouette images respectively.
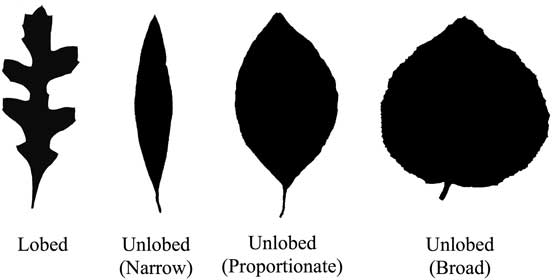
Figure 9 Expanded set of CLAMP leaf lobing character states used in this analysis with examples illustrating these categories drawn from the training set. This expanded character group subdivision allows various aspects of leaf geometry to participate in placement of shape groups within the discriminant space while still retaining the ability to associate distinct regions of that space with the character of interest uniquely.
As alluded to above, despite the fact that we were not interested particularly in the proportionate, narrow or broad aspects of the unlobed leaf morphologies for the purposes of the identification of the traditional CLAMP character state, the presence of these categories in the regrouped training set simply acknowledges the fact these aspects of leaf shape are present in the raw data. From a linear algorithmic point-of-view inclusion of these additional categories is useful insofar as it provides the discrimination algorithm with more information — and so more flexibility — in placing the unlobed leaves relative to the lobed group within the discriminant space. Moreover, partitioning of the resultant discriminant space can be adjusted post hoc to reflect the traditional CLAMP groups following creation of the appropriate (expanded groups) discriminant space.
All images within the leaf lobing training were processed as outlined above and adjusted to fit a standardized 32×32 pixel image grid, resulting in a column vector of 1,024 pixel brightness variables. The dimensionality of this data matrix was reduced subsequently to 32 latent vector axes following eigenanalysis of the image pixel covariance-matrix as this is the number of axes required to retain 95 percent of the observed variation among images. This variance-optimized dataset was then submitted to CVA in order to maximize between-groups shape discrimination and partition the resulting discriminant shape space into lobed and unlobed domains. Results of this procedure are illustrated graphically in Figure 10.

Figure 10 Discriminant space for the leaf lobing image training set formed from the canonical variates of the reduced set of the pooled sample image eigenvectors partitioned a priori into states based on the expanded set of CLAMP character-state definitions (see Fig. 9). Individual points represent positions of each training-set image projected onto two orthogonal discriminant functions. The figures illustrated here represent the complete 3-axis discriminant space. Note the disjunct distribution of subdomains associated with the lobed (red), and unlobed (purple, cyan, green) leaf lobing characters. These distributions take leaf width characteristics that are associated with, but not part of, the traditional CLAMP leaf lobing character into consideration in defining the discriminant space. See text for discussion.
As can be seen from the plot, within the discriminant space all four leaf lobing groups occupy distinct and mutually exclusive subdomains. Here, CV-1 represents a contrast between broad leaves (high scores) and proportionate-to-narrow leaves (low scores) whereas CV-2 and CV-3 encode various aspects of leaf symmetry. Despite the fact that these aspects of leaf physiology have nothing to do with leaf lobing per se, the CV space has nevertheless been ‘tuned’ to represent geometric distinctions between the various lobing groups and does so quite successfully. This result demonstrates that there are systematic and well organized geometric distinctions between these expanded lobing-shape categories that can be used to define lobing-based regions within the overall discriminant space for the purpose of automated CLAMP character identification.
Interestingly, lobed leaves plot closest to unlobed (narrow) leaves in the CV-1 vs CV-2 subspace. This makes sense insofar as the presence of lobing in the leaf margins included in our sample represents a combination of the physiographic aspects of narrow and broad leaves, with a portion of leaf space occupied by material located at a distance from — rather than close to — the leaf axis. It is only along CV-3 that asymmetries associated uniquely with leaf lobing are expressed. This can be seen by the fact that unlobed and lobed leaves form distinct and mutually exclusive domains when projected onto the CV-3 axis.
Centroid separations for the four-group leaf lobing result are marked and, as assessed by the ϕ statistic (1,052.00), significantly greater than would be expected for a sample drawn randomly from a single normal distribution or from the training set distribution itself, as assessed by 1,000 pseudoreplicate simulations of the ϕ index calculated under Monte Carlo and bootstrap sampling protocols. In both cases no pseudoreplicate ϕ-value greater than 150 was obtained for any of the simulated analyses. This result suggests the null hypotheses of the observed group separations arising as a result of either random sampling error or an artefact of the CVA procedure can be rejected for this dataset with a very high degree of confidence (α<<0.00001).
Post hoc assignment of leaves to a priori lobed state groupings based on the proximity of projected image configurations to group centroids attained a 90.67 percent identification accuracy ratio when using all four shape categories (see Fig. 9) and a 98.67 percent accuracy ratio if the three unlobed state sub-regions in the discriminant space are regarded as a single, disjunct, unlobed state region. When the stability of this solution was examined using the jackknife test error rates declined marginally to 94.00 percent; but remained well within the range of performance expected from human taxonomic experts.
Leaf Aspect Ratio
On first inspection leaf aspect ratio would appear to be an inherently quantitative character that would lend itself more readily to a completely morphometric approach. However, few CLAMP practitioners actually measure leaves in order to score them for this character, preferring to estimate the difference between leaf lengths and widths visually instead. This practice alone suggests that it should be possible to devise an automated system for placing leaf images into the appropriate aspect-ratio categories accurately, consistently, and reproducibly.
Owing to the large number of CLAMP aspect-ratio categories the leaf aspect ratio training set was the most complex of any used in this investigation. Totalling 150 specimens, the five traditional CLAMP aspect ratio character states were further subdivided into nine groups by including both symmetry (symmetrical, asymmetrical) and shape (lobed, obovate, straight, curved) characteristics in the aspect ratio definitions (Fig. 11). Not all combinations of these characteristics were present in the Karee Kranz dataset. Sample sizes for each of the aspect ratio categories included in this analysis were as follows: ≤1:1 cordate (15), 2:1 symmetric (19), 3:2 symmetric (20), 3:2 asymmetric (3), 3:2 lobed (15), 3:2 obovate (13), 3:1 symmetric (23), ≥4:1 curved (19), ≥4:1 straight (23). Based on the high level of similarity between the two analyses the same image processing procedure described above was used for the leaf aspect ratio training set. The leaf aspect ratio pixel covariance matrix was pre-processed via eigenanalysis to concentrate the information content of the entire dataset into a relatively small number of latent image variables. For this training set 35 eigenvectors were needed to represent 95 percent of the observed image variability. Projected positions of the leaf images in this 35-dimensional space were then grouped into the traditional set of CLAMP leaf ratio/shape categories and submitted to CVA.

Figure 11 Expanded set of CLAMP leaf aspect ratio character states used in this analysis with examples illustrating these categories from drawn from the training set.
Plots of the subspace formed by the three most important CVA axes for the leaf ratio training-set data are shown in Figure 12. Even within this reduced discriminate space it can be seen that virtually all training-set groups are well separated. Statistical testing of group separation using ϕ statistic confirms this qualitative interpretation: that the observed degree of group centroid separation (2,188.0) far exceeds that expected for a CVA analysis of a dataset of similar size and complexity as assessed by 1,000 Monte Carlo and/or bootstrap pseudoreplicate simulations. Based on these test results, the probability that our empirical separation between leaf aspect-ratio character states lacks statistical significance under either random sampling from a normal distribution with a single mean and variance (Monte Carlo simulation) or from the pooled training set data (bootstrap resampling) is judged to be extremely low (α<<0.0001) for both test scenarios.

Figure 12 Discriminant space for the leaf aspect ratio image training set formed from the canonical variates of the reduced set of the pooled sample image eigenvectors partitioned a priori into states based on the expanded set of CLAMP character-state definitions (see Fig. 11). Individual points represent positions of each training-set image projected onto two orthogonal discriminant functions. As the two figures illustrated here represent arbitrary slices through a 9-dimensional discriminant space (36 unique slices in total) character-state groups that appear to overlap in these plots may be separable along other discriminant axes. Nevertheless, note the disjunct distribution of subdomains associated with the 3:2 aspect ratio geometries (turquoise, dark blue, purple - blue). These distributions are the result of additional morphological attributes (leaf shape, leaf breadth, leaf symmetry) geometrically associated with, but not part of, the traditional CLAMP leaf aspect-ratio character.
The overall geometry of the discriminant space is well-defined by the group distributions with the first canonical variate axis separating the group with lowest aspect ratio (low scores) from those which higher ratios (high scores). Indeed, the rank order of group centroids along CV-1 exhibits a perfect correlation with the group aspect ratio. Two broad shape groupings are also distinguished along CV-2, a characteristically narrow, non-circular group (low scores) and a characteristically broader non-circular group (high scores).
Interestingly, lobed leaves plot at positions adjacent to those leaves which higher aspect ratios (≥4:1) despite the fact that the aspect ratio of the lobed leaves is markedly lower (3:2). The reason for this seemingly odd placement is straightforward. The low aspect ratio of the lobed leaves reflects the presence of the lobes which can be thought of as structures superimposed on a characteristically narrow leaf morphology. As with the leaf lobing analysis, lobed leaves are placed close to the uniformly high aspect-ratio leaves because their outlines exhibit extensive regions of high length-to-width ratios interrupted periodically by the low aspect-ratio lobes.
Similar to the results obtained from other CLAMP character states, by defining the discriminant space in such a way as to allow different leaf morphologies to be placed in their natural positions, an excellent discriminant result was achieved. At the same time, the ability to track parameters of interest through the complex discriminant shape space was retained even though the distributions of the traditional CLAMP aspect-ratio shape groups sensu stricto exhibit disjunct distributions within the hyperdimensional discriminant space.
Based on centroid proximity-based, post-hoc, aspect ratio-shape group identifications the full nine-dimensional discriminant solution for these training-set images achieved an accuracy of 90.67 percent. The majority of misidentifications recorded by this test involved incorrect assignment to shape groups, which is not the parameter of interest for assessment of the CLAMP aspect ratio character. If the aspect ratio discriminant result is recoded to only record the (disjunct) regions defined by the traditional CLAMP leaf aspect-ratio character states, this accuracy result rises to 98.67 percent. Perhaps most importantly, this result exhibits excellent stability. A jackknife test of identification accuracy in which the specimen being identified played no role in defining the discriminant space returned a 94.63 percent overall accuracy with three of the five CLAMP aspect-ratio groups returning identification accuracy results of over 95 percent.
A summary of all results obtained in this investigation for all CLAMP characters investigated is presented in Table 1.
Table 1 Results for automated CLAMP character state analysis performance tests.

Discussion
Implications for CLAMP Analyses
Recently, Corney et al. (Reference Corney, Tang, Clark, Hu and Jin2012a,Reference Corney, Clark, Tang and Wilkinb) proposed methods for automating the identification of leaf objects on herbarium sheets by extracting leaf teeth measurements from their images. These included leaf length, leaf width, tooth count, and tooth area. While none of these aspects of leaf morphology are part of the standard CLAMP character suite per se, there is no conceptual or operational difference between them and those aspects of leaf physiognomy that are part of the standard CLAMP character suite. In addition, the practical problem of implementing automated character analysis is the same for any aspect of leaf morphology regardless of the use to which such identifications are put subsequently.
The approaches employed by Corney et al. (2012a,b) differ from those described above in that they are based on algorithms whose explicit aim is to extract specific distance measurements (usually distance from the centroid) from leaf outlines for the purposes of leaf characterization (Huff, et al. Reference Huff, Wilf and Azumah2003; Royer, et al. Reference Royer, Wilf, Janesko, Kowalski and Dilcher2005; Peppe et al. 2011). The Corney et al. (Reference Corney, Tang, Clark, Hu and Jin2012a,Reference Corney, Clark, Tang and Wilkinb) approaches do not attempt to devise a generalized method for automated leaf character analysis. Ours does. While the Corney et al. (Reference Corney, Tang, Clark, Hu and Jin2012a,Reference Corney, Clark, Tang and Wilkinb) approaches might be useful in principle for employment in CLAMP-style analyses, we believe they will prove difficult to generalize into fully realized CLAMP character discriminators as they employ purpose-designed algorithms that would need to be modified extensively to be applied to the discrimination of standard CLAMP leaf physiognomy characters. Further, the conceptual and operational specificity of these approaches prevents them from being used to discover radically new and potentially useful leaf characters as they are designed only to quantify specific aspects of the leaf morphology. These approaches will also have difficulty coping with damaged leaves, both in terms of training set assembly and the extraction of data from unknown leaves. In contrast, our approach is fully generalized in that it is based on the image of the leaf itself and is capable of representing, at least in theory, all aspects of leaf morphology without further modification. Our approach is more akin to true computer vision as it treats leaf morphology as a unified geometric configuration of points (=the entire pixel grid), and could even use leaf color and blade surface texture as leaf-character descriptors (see MacLeod 2015). In addition, since a large amounts of data are collected from each leaf image, minor to moderate levels of leaf damage will compromise only part of the dataset for any leaf under consideration. As this damage would be expected to be distributed in a quasi-random manner over the leaf, and to present both an irregular and (from the standpoint of overall leaf shape) idiosyncratic aspect of shape variation, minor-to-moderate levels of damage can be expected to exert comparatively little influence on the placement of shape-characterization and shape-discrimination vectors/axes, and so comparatively little influence on the accuracy or leaf character identifications. Certainly the results we have obtained are consistent with this view though the degree to which automated leaf character identifications can (and should) be the specific subject of further research. Of course, damage so severe as to obscure the character(s) or interest will not be able to be handled unambiguously, either by our system or by human experts
One of the more subtle limitations of distance-based multivariate morphometric datasets — as employed by Corney et al. (2012a,b) — is that they do not readily lend themselves to formalized modelling of the shape spaces that can be created from landmark and semilandmark data. In contrast, our geometric morphometric approach enables the user to move freely between the mathematical shape spaces that our results describe (see Reference MacLeodMacLeodReference MacLeod2002a,Reference MacLeodb, Reference MacLeod2005, Reference MacLeod2007, 2009, 2015). These model-based results can be portrayed visually and the pixel-point configurations (i.e. images) that underly those shape spaces, can be viewed as actual leaves. Further, the much larger set of theoretical constructs of leaf character shape within which the results of our discriminant analyses are embedded can be viewed and modelled as well, providing an expanded vocabulary of geometries for analysis and thus facilitating the discovery of novel insights into the ways angiosperm leaf architecture respond to climate change. We believe the Corney et al. (Reference Corney, Tang, Clark, Hu and Jin2012a,Reference Corney, Clark, Tang and Wilkinb) approach and ours are complementary and, when viewed as a whole, provide multiple lines of unambiguous evidence that automated CLAMP character scoring — and indeed the automated assessment of leaf form — is not only possible using current, off-the-shelf linear data analysis procedures, it is practical and advantageous.
Of the five CLAMP characters we investigated using our expanded character state categories, all but the first yielded raw training set identification results with c. 100 percent accurate, post-hoc, CLAMP character-group discriminations whose statistical significance and stability were supported by a variety of probability-based tests. Tests of the leaf base character, while not returning near perfect identification performance results, nevertheless returned results that approached the acceptable error margin of c. 85 percent correct identifications. Overall, this level of performance, at the very least, approaches, and in most cases exceeds, those documented as having been delivered by human experts in controlled trials (admittedly for other organismal groups). Collectively, our results indicate that the chance of such discriminations arising either as a result of random sampling error, or as an artefact of the CVA analysis, is essentially nil.
Perhaps the most important way in which our approach differs from those used by most other practitioners lies in the manner in which we constructed training sets for the identification of CLAMP characters from leaf images. For example, in the case of the leaf base character, results predicated on the analysis of the traditional three CLAMP character states (acute, cordate and round) returned a relatively high post hoc raw identification accuracy (84.92%), but exhibited lower stability when the discriminant functions were asked to identify specimens from outside the training set. This type of problem is encountered commonly by biological data analysts and is, in large part, responsible for the historically limited use of linear discriminant analysis (LDA) as a taxonomic identification tool. The reason this poor result was obtained for our CLAMP characters — and the likely reason LDA appeared to perform poorly in other taxonomic, systematic, phylogenetic, and ecological contexts — is that, while humans find it easy to focus in on specific aspects of morphology when they assess specimens for character states, computer algorithms have difficulty performing the same task as they ‘see’ all aspects of the form residing within the data they are presented, including aspects that may not be relevant to the discriminant problem at hand, but lack the experience and intelligence necessary to ignore these aspects of leaf shape variation.
In our investigation we found that by (1) processing the leaf images to remove as much extraneous shape information as possible from consideration and (2) expanding the number of groups used to subdivide the discriminant space to include natural geometric groupings of objects, we were able to work with the strengths and systemic tendencies of the LDA algorithm to recognize and employ the presence of these extraneous physiognomic data to add value to the discriminant result. From a geometric point-of-view, the primary effect of expanding the set of character groups used as the basis for the discriminant analysis was to allow different configurations of the same character state to drift to their ‘natural’ positions within the discriminant shape space rather than constraining the CVA algorithm to finding only those discriminant functions that maximize contiguous between-groups separations while simultaneously minimizing contiguous within-groups distinctions. Using our strategy for optimizing a morphometric discriminant analysis a larger number of discriminant functions can also be brought to bear on the group-partitioning problem than would otherwise be the case. Moreover, our strategy relaxes the assumption that all groups of interest will, or need to, occupy contiguous regions within the overall discriminant shape space.
In the case of the leaf base character this meant devising simple image-processing algorithms to reduce the resolution of the cropped, aligned, and standardized images to a standard 15×50 pixel grid. Once these images had been processed we allowed expert-assessed, qualitative leaf-breadth and leaf-symmetry categorizations, along with the traditional CLAMP leaf base states (acute, cordate, and round) to participate in creation of the overall leaf base discriminant space. This procedure resulted in this discriminant space being partitioned into discontinuous domains with respect to the CLAMP leaf-base characters of interest (see Fig. 8) with those discontinuities reflecting the influence of the leaf broadness and symmetry characters.
While leaf breadth and leaf symmetry have not been used to define the various states of any CLAMP leaf-shape character, they are, nevertheless, part of the leaf shape image ‘seen’ by the discriminant algorithm. The result of our employment of this image-processing procedure and discriminant space training strategy was to increase the accuracy and stability of the leaf-base character identifications by several percentage points for the raw post hoc identification of training set images, and for the jackknife stability test results.
Should additional training sets of leaf character states need to be added, or existing ones modified to optimize performance, this can be done very easily. Verification of the performance of such an automated system can be achieved by presenting new or unknown leaves to the system for analysis and observing whether the system generates credible results (as determined by consensus identifications performed by a group of taxonomic experts). In the initial phases of system deployment it would also possible for all specimen character state identifications to be viewed and cross-checked by human experts to ensure adequate quality control.
The increase in automated identification performance realized as a result of using our approach has implications that transcend the application of this strategy to CLAMP analyses. An implicit assumption of all linear discriminant strategies is that the groups being separated from one another occupy continuously distributed fields or regions within some linear transformation of the variable space. In many cases this is indeed the case. But just as obviously it is not true in a very large number of cases across the biological sciences where morphologies assigned to the same character state can exist as sets of discrete ‘island’ subgroups. Our automated identification strategy introduces an element of non-linearity into the results of a linear discriminant analysis in that groups of interest no longer need to be distributed in the discriminant space continuously.
For example, the CLAMP leaf shape states of ellipticity, obovateness, and ovateness can be defined as an archipelago of islands within a ‘sea’ of morphological variation whose geometry is determined in large measure by the ever-present — but for this character extraneous — factors of leaf breadth and leaf symmetry. Once these islands have been located relative to one another in the overall discriminant space, it is an easy matter to focus the quantitative definitions of the character states of interest in a manner that ignores extraneous shape-categorization factors. This is accomplished by partitioning the space such that all specimens projecting to positions within the ‘elliptical-broad-symmetrical’, ‘elliptical-broad-asymmetrical’, or ‘elliptical-narrow-symmetrical’ islands are identified as ‘elliptical’.
This approach to discriminant analysis design strategy is fully generalizable. It can be employed in the design of any linear discriminant problem through the creation of appropriate training sets. Our strategy also has the desirable feature of nullifying the significance of identification errors among similar character state groupings (in our case the various permutations of ellipticity) which, as it turns out, account for the majority of the identification errors produced by the automated identification system, at least for the datasets we have examined to date.
Our strategy of using subgroupings to focus and improve the identification of groups has several other interesting implications for existing CLAMP character suites. While the narrowness or broadness of the leaf shape could arguably be said to already be taken into consideration in a traditional CLAMP analysis by virtue of the leaf/width ratio character suite, the presence or absence of leaf asymmetries has not. This may explain why deletion of some character states from a CLAMP analysis entirely does not have a marked influence upon the resulting climate estimates (Spicer and Yang, Reference Spicer, Valdes, Spicer, Craggs, Srivastava, Mehrotra and Yang2010). Our results suggest that the current set of CLAMP leaf physiographic descriptors may not be as ‘natural’ as had been thought previously. At present, the existence of notable asymmetries in a leaf population, and how these might relate to climate variables, is unknown, especially in those cases where one side of the leaf clearly has one characteristic state, and the other side a different characteristic state. The potential of adding symmetry-based subgroupings (e.g., base asymmetric/base symmetric) to CLAMP analyses not only represents a potential improvement that might enable character scorers to avoid the (current) need to make arbitrary — and so potentially inconsistent — decisions with regard to the appropriate manner in which to score certain types of leaves, it may indicate the existence of a previously unrecognized, but easily coded and potentially useful, set of climatically relevant leaf character-state variables.
This possibility also illustrates how the use of new, quantitative methods of morphological analysis can lead to the reconsideration of traditional taxonomic observations and, possibly, to the discovery of new and potentially useful characters and/or character states that may be linked to explanatory variables and/or hypotheses (e.g., climate variables, ecological variables, phylogenetic characters, see Reference MacLeodMacLeodReference MacLeod2002b for another example). For this character suite the task now becomes one of testing various new characters whose definition contains the concept of symmetry (using both manual and automatic methods) to determine whether any do, in fact, have a material impact upon the accuracy and predictive powers of the CLAMP method. Regardless of the outcome of such analyses, recognition of this potential represents a very useful addition to morphological analysis in general and to CLAMP analyses in particular.
Finally, we would like to point out that none of the issues we have raised with regard the principles of practices of automating CLAMP character-state analysis should be seen as undermining the core logic of the CLAMP approach. CLAMP has been proven a useful and robust approach to (paleo)climate inference many times and in many contexts (see Spicer & Yang Reference Spicer, Valdes, Spicer, Craggs, Srivastava, Mehrotra and Yang2010; Spicer et al. Reference Spicer, Bera, De Bera, Spicer, Srivastava, Mehrotra, Mehrotra and Yang2011). Rather, we are simply pointing out that morphometrics offers an avenue whereby the CLAMP approach can be improved, both in terms of the identification of new leaf analysis characters and character states as well as in identifying areas where existing leaf character definitions may be less than ideal or appropriate. Employment of automated image analysis methods such as those we have described has the power to increase the accuracy, consistency, and speed of all analyses in which the identification of taxonomic groups is important, one example of which is CLAMP analysis.
Summary and Conclusions
Research into automated forms of species and taxonomic character recognition has now reached the state of development that will allow this technology to make real contributions to research in many different biological fields by addressing long-standing issues of identification accuracy, consistency, reproducibility, and speed. Sophisticated, turn-key, industrial-scale specialist hardware and software systems are not needed to take advantage of this technology. Simple, but effective, identification systems that deliver marked improvements over expert-based identifications can be assembled from off-the-shelf software components, trained using expert-identified data (incl. images), tested and verified using a wide variety of statistical procedures, and employed with confidence to improve the accuracy and extend the scope of systematic studies across the (paleo)biological sciences.
Herein we have illustrated one such procedure which utilizes digital images as the source of information to automate the identification of traditional CLAMP leaf physiography character states. Five CLAMP characters were selected for analysis using our approach: leaf base, leaf apex, leaf shape, leaf lobing, and leaf aspect ratio. Direct analysis of digital images of leaf silhouettes collected from the Karee Kranz locality in, South Africa, using a combined eigenanalysis/CVA data-analysis design returned results of between 87 and 100 percent correct raw post hoc identifications and between 83 and 100 percent correct jackknifed post hoc identifications for training set specimens. Statistical testing of the CVA results using both Monte Carlo and bootstrapped simulations of the log-likelihood ratio (LLR) index returned results that, in each case, rejected the null hypotheses that the observed results could be attributed either to (1) random sampling from a single population or (2) artefacts the CVA procedure.
Comparison of these accuracy results with results obtained from empirical identification blind tests of human expert performance based on a number of different taxonomic groups suggest they are similar to those that could be expected from a typical human experts performing identifications under optimal conditions and (likely) much better than would be expected from human experts working under routine CLAMP data-analysis conditions. In this context it should be noted that no specific comparison of the scoring accuracy of CLAMP characters under routine scoring conditions between human experts has been published to date with the exception of a partial analysis of results produced by eight novice collector groups in a training study (Spicer and Yang Reference Spicer, Valdes, Spicer, Craggs, Srivastava, Mehrotra and Yang2010). A blind-test and comprehensive multi-subject CLAMP scoring study on a complex flora needs to be undertaken to document actual identification accuracies of human CLAMP experts.
Critical to the generation of our results was an innovation in the structuring of training sets for the leaf character analysis. Instead of partitioning the training set images into the standard CLAMP character-state categories, our training-set images were partitioned into character groups that acknowledged the presence of other morphological factors in the image data — chiefly leaf breadth (narrow/broad) and symmetry (symmetrical/asymmetrical) — that are not part of the formal definition of any CLAMP character but, nevertheless, exhibit strong influences on the morphometric results. This operation increased the number of groups considered in the partitioning of the discriminant space, allowed more discriminant axes to be employed in the characterization of that space, and relaxed the (artificial) constraint of all character-state groups of interest being assumed to occupy continuous regions in the transformed shape space. Use of this enhanced training set-grouping strategy introduced an element of non-linearity into the mapping of character-state regions within the discriminant space and allowed the CVA algorithm to find more geometrically natural positions for these regions relative to one another. The price paid for use of this strategy is an increase in the number of training set images needed to characterize the range of possible shape states adequately. However, in all trials reported here use of this strategy improved the accuracy and stability of the discriminant results as well as improving estimates of statistical significance even when groups were characterized by small numbers of specimens/images; in most instances dramatically so.
Based on these results, and combining them with results obtained by other investigators using other morphometric procedures (e.g., Corney et al. Reference Corney, Tang, Clark, Hu and Jin2012a,Reference Corney, Clark, Tang and Wilkinb), there is now little question that it is feasible to fully automate the identification of most CLAMP character states at the point of character identification and, in so doing, improve the accuracy, consistency, reproducibility and speed of CLAMP analyses. Human experts will be needed to assemble representative leaf training sets, determine training set categories, and test both training set and system performance (not to mention developing the software, writing the code, etc.). These aspects of the leaf identification process is not, and cannot, be automated. Nevertheless, from the point of view of the user of such a system, no pre-sorting or pre-identification of leaves or leaf characters is necessary. The system is fully automated at the point of use. More generally, the image processing and data-analysis procedures we have developed for this investigation can be applied to many different organismal groups, and in many different contexts, across the biological and physical sciences [Note: See Reference MacLeodMacLeod et al. Reference Culverhouse, MacLeod, Williams, Benfield, Lopes and Picheral2013 for a novel application to bioacoustic analysis and Reference MacLeodMacLeod 2015 for another application to taxonomic analysis.]
While the results we (and others) have obtained in our attempts to implement computer vision and automated object recognition algorithms to the problem of leaf physiognomic character identification are encouraging, they were not obtained from a fully operational user-friendly system for conducting such analysis on a routine basis. Rather they were obtained from leaves collected from a single — albeit ordinary and representative — CLAMP calibration locality using off-the-shelf image processing and linear, multivariate data analysis methods. If the assembly of a fully realized, general-purpose system to undertake routine leaf-character identifications from a wide range of geological times and places is desired, expansion of the leaf physiognomy character training sets will be needed, additional non-linear and machine learning discrimination algorithms tested (see MacLeod 2012; MacLeod et al. 2014) and an IT systems infrastructure created to accept leaf images, undertake standard image processing procedures, compute the identifications and deliver the results (preferably) to users wherever they happen to be and whenever they happen to need them. This system does not exist (yet) and, indeed, is not necessary for analyses such as those we have reported. However, until such time as it could be demonstrated that any computer-based system was capable in principle and in practice of providing leaf character identifications at the level of accuracy required for standard CLAMP (and other leaf physiographic) analysis, there was no particular reason to confront seriously issues involved in determining how such a system might be designed and constructed. The results described above constitute a major part of that demonstration.
Many of the environmental, ecological, biogeographic, (paleo)oceanographic, bio-functional, evolutionary, stratigraphic, and paleontological problems that confront science in the 21st century will require that large datasets of reliably, consistently, and rapidly identified objects (=taxa, characters, character states, individuals) be assembled quickly, within verifiable error limits, and in a form suitable for quantitative analysis. Even if a new generation of researchers can be attracted to careers in taxonomy and trained to replace those approaching retirement, it is unlikely the current practice of relying of individual experts to supply these identifications will be adequate to the task of meeting this need. Molecular data can meet this challenge in certain instances (e.g., Sykes et al. Reference Sykes, Mullis, Hagenmuller, Melton and Sartori2014), but not across the broad range of scientific fields and not for problems (such as those in paleontology/paleobiology) where an understanding of patterns of morphological variation is the focus of investigation. Prominent paleobiologists have been alerting the systematic community to the need for automating identifications for several decades (e.g., Kaesler Reference Kaesler1993). The time has come for the systematic community as a whole, and the paleobiological community – because of its absolute dependence on morphological data – in particular, to grasp this nettle, to use the methods of morphological data analysis currently available to improve identifications/datasets, and to support research into the application and improvement of methods for automating the identification of objects with respect to routinely used categorizations.
Acknowledgements
We would like to thank The Natural History Museum for providing the funds and equipment needed to make this research possible. Previous versions of this manuscript were read and commented on by Paul Kenrick (NHM) and Daniel J. Pepe (Baylor), and one anonymous reviewer. We thank these reviewers for their efforts. We also thank the South African National Research Foundation, the Palaeontological Science Trust (PAST), Prof. M. K. Bamford, and the University of the Witwatersrand for funding the research and fieldwork that enabled the collection of the original specimens used in this study.
Supplementary Material
Supplemental materials deposited at Dryad: doi:10.5061/dryad.mk4f8
Appendix I Automated Image Processing and Analysis Procedures
In this investigation all image processing and image analysis steps were carried out using algorithms that can be implemented using a wide variety of graphics and/or mathematical applications that are available for a wide variety of software platforms. In our particular case image processing was largely carried out using the “Convert and Modify” processing system available in the Lemke Software application Graphic Converter™ (vers 8.8.3). Specific image processing tools we found useful form this purpose included “Canvas Size”,“Change Format”, “Resolution”, “Scale”, “Threshold”, and “Trim”. Specification for the settings used for the analysis of each CLAMP character are provided in the text. Graphic Converter™ was also used to convert the leaf-character images from their original.tif format to an ASCII matrix of greyscale values.
Data analysis was implemented using three programme packages written by the senior author as in the scripting language of the Wolfram Research Inc. Mathematica™ System (vers. 10.1.0.0) as follows.
Form & Texture Analysis (Mono, vers. 1.0) - This script reads in a series of ASCII image matrix files from a directory where they have been placed, reformats the matrix into a column vector (the image vector), and output the image vectors as a single standard format data matrix (the image matrix) with rows representing images and columns representing the pixel greyscale values.
Principal Components Analysis (PCA, vers. 4.10) - This script reads in a standard format image matrix, calculates the covariance matrix for all pairwise pixel combinations (the image covariance matrix), and performs a singular value decomposition (=eigenanalysis) of this matrix. It also includes facilities for making 2D and rotatable 3D plots of the projections of the set of input data (in our case image vectors) onto any non-zero eigenvector and outputting the set of eigenvalues, eigenvectors, and (projected) eigenscores to standard format datafiles.
Canonical Variates Analysis (CVA, vers. 1.18) - This script reads in a standard format matrix and performs a CVA analysis on the subgroups designated in order to separate the subgroups centroids to the maximum extent possible relative to intra-group data dispersions. It also includes facilities for making 2D and rotatable 3D plots of the projections of the set of input data (in our case latent image vector scores) onto any non-zero canonical variate and outputting the set of eigenvalues, eigenvectors, and (projected) eigenscores to standard format datafiles. In addition, this script includes routines for assessing, displaying, and outputting the distance matrix of discriminant function assignments, the confusion matrix for a priori submitted training sets, proposed identifications for unknown specimens (in our case images), as well as Χ 2 Monte Carlo, and bootstrapped estimates of the statistical significance of subgroup-centroid separation and a jackknife estimate of expected identification performance.
Non-executable, but complete listings of these scripts are available from the datadryad site (http://datadryad.org/resource/doi:10.5061/dryad.mk4f8) along with the original leaf image and raw results files. Executable versions of these routines are available from the senior author.


