1. Introduction
The formation and interaction of shed vortices behind a bluff body are important mechanisms underlying the wake dynamics responsible for mixing and induced forces. Manipulating vortex formation can thus alter aerodynamic characteristics or fluid transport (Choi, Jeon & Kim Reference Choi, Jeon and Kim2008). Manipulation of the shedding process has been achieved by periodically perturbing the separated shear layer, for example, by using oscillating cylinders or pulsed (non-zero mass flux) and synthetic (zero-net-mass-flux) jets. Over certain intervals of the actuation frequency, the shedding frequency locks-on to subharmonics of the actuation frequency and the wake dynamics is strongly modified. This manipulation strategy has been applied for heat transfer enhancement (Gau, Wu & Su Reference Gau, Wu and Su2001), mixing improvement (Celik & Beskok Reference Celik and Beskok2009) and drag reduction (Barros et al. Reference Barros, Borée, Noack, Spohn and Ruiz2016b). While the use of large-amplitude forcing is commonly studied, from a practical perspective, the potential for achieving high effectiveness using weak (low-energy) synthetic jets motivates further research because this form of actuation benefits compact design and control authority at low energetic cost (Cattafesta & Sheplak Reference Cattafesta III and Sheplak2011). The process by which weak perturbations from a synthetic jet interact with the shear layers and forming vortices, giving rise to multiple lock-on regimes with modified wake dynamics remains poorly understood. This process is thus of practical and fundamental interest. In this work the influence of weak synthetic jet pulses on the wake dynamics of a cantilevered, finite triangular prism is considered. The pulses are injected along the obstacle trailing edge and their interaction with the forming vortices is investigated as a function of actuation frequency. The aim of this work is to identify the mechanisms for synchronization and downstream vortex splitting due to weak perturbations and develop a model accounting for multiple lock-on regimes.
The lock-on phenomenon (Griffin & Hall Reference Griffin and Hall1991), also known as lock-in (Williamson & Roshko Reference Williamson and Roshko1988; Rigas, Morgans & Morrison Reference Rigas, Morgans and Morrison2017) or vortex synchronization (Kim et al. Reference Kim, Park, Park, Bae and Yoo2009; Feng & Wang Reference Feng and Wang2010), in response to periodic perturbations of the flow has been reported for different actuation methods, including pulsed and synthetic jets; modulated oncoming streams and oscillating cylinders. Primary lock-on occurs when the shedding frequency,  $f_{sh}$, matches the actuation frequency,
  $f_a$, over some interval and initiates when
  $f_a$ approaches
  $f_0$, the natural shedding frequency of the unactuated flow. Subharmonic or superharmonic lock-on (Baek, Lee & Sung Reference Baek, Lee and Sung2001; Wang et al. Reference Wang, Tang, Simon and Duan2017) occurs when
  $f_a$ is an integer multiple or submultiple of
  $f_{sh}$, which generally differs from
  $f_0$. The lock-on phenomenon for cantilevered triangular geometries has not been studied previously. However, for weak perturbations, similarities in the wake response observed for this study with earlier works suggest a common underlying physical process despite the very different actuation methods used. Pertinent results using pulsed and synthetic jets are thus reviewed next and subsequently linked to the similarities observed using different actuation methods.
1.1. Pulsed and synthetic jets
The importance of the actuation amplitude on the wake response has been investigated using synthetic jets for two-dimensional (2-D) cylinders in low-Reynolds-number laminar flows. Feng & Wang (Reference Feng and Wang2010) and Qu et al. (Reference Qu, Wang, Sun, Feng, Pan, Gao and He2017) investigated the influence of single synthetic jet actuators placed at the leeward stagnation point of a 2-D circular and square cylinder, respectively. For sufficiently large net momentum flux (excitation amplitude) from the actuator, the antisymmetric (Kármán) shedding was replaced by symmetric shedding of counter-rotating vortex pairs. Only primary lock-on ( $\,f_a/f_{sh}=1$) was found to occur over a large interval
  $1.67 \leq f_a/f_0 \leq 5$ by Feng & Wang (Reference Feng and Wang2010), while Qu et al. (Reference Qu, Wang, Sun, Feng, Pan, Gao and He2017) observed similar primary synchronization at
  $f_a/f_0=$ 4 and 6. The wake response to
  $f_a$ is affected by the excitation strength relative to
  $U_\infty$ (Feng, Wang & Pan Reference Feng, Wang and Pan2011). For example, below an actuation amplitude threshold, Qu et al. (Reference Qu, Wang, Sun, Feng, Pan, Gao and He2017) observed synchronized Kármán shedding at
  $f_a \simeq 2f_{sh}$ (
 $\,f_a/f_0=3$). The importance of the actuation amplitude threshold on the synchronization interval and shedding mode has been reported for other actuation and geometric configurations (Griffin & Hall Reference Griffin and Hall1991; Munday & Taira Reference Munday and Taira2013; Rigas et al. Reference Rigas, Morgans and Morrison2017). Taken together, these studies indicate that the wake response to weak and strong perturbations differ fundamentally.
The conditions on the actuation frequency and phase difference for synchronization of antisymmetric Kármán shedding have been discussed by Wang et al. (Reference Wang, Tang, Simon and Duan2017) for two-sided actuation using synthetic jets placed symmetrically about the leeward stagnation point of a 2-D cylinder. Using a low-order model based on extended linear theory, it was found that subharmonic lock-on regimes ( $\,f_a \simeq 2f_{sh}$ and
  $f_a \simeq 4f_{sh}$) are possible with two-sided in-phase actuation, while lock-on regimes at
  $f_a \simeq f_{sh}$ and
  $f_a \simeq 3f_{sh}$ are possible for antisymmetric actuation. Based on a lattice Boltzmann method (LBM) simulation for
  $Re=100$, the existence of all but the lock-on regime at
  $f_a \simeq 4f_{sh}$ could be confirmed. This discrepancy was interpreted to imply that a minimum perturbation level is required for effective actuation. While the proposed model has heuristic value, it presupposes synchronization and, thus, does not account for the observed deviation of
  $f_{sh}$ from
  $f_0$. Consequently, the onset and duration of the lock-on intervals cannot be explained. Moreover, the process of synchronization was not investigated.
Barros et al. (Reference Barros, Borée, Noack and Spohn2016a) showed that synchronization using pulsed jets of antisymmetric Kármán-like shedding is possible for three-dimensional (3-D) bodies at higher Reynolds numbers. The pulsed jets were placed near the edges of the leeward face of an Ahmed body. Similarly to 2-D studies, primary lock-on was observed when the pulsed jets on opposing faces were actuated out-of-phase, while lock-on at  $f_a \simeq 2f_{sh}$ occurred for in-phase actuation. While lock-on was associated with increased curvature of the separated shear layers, the mechanisms underlying the lock-on process were not investigated.
Related synchronization studies are those for the actuation of the high-Reynolds-number turbulent wake of a long axisymmetric (cylindrical) body with a blunt trailing edge (Rigas et al. Reference Rigas, Morgans and Morrison2017). The synthetic (zero-net-mass-flux) jet was ejected along an annular slit in the proximity of the circumference behind the trailing edge and lock-on at  $f_a \simeq 2f_{sh}$ was observed. Rigas et al. (Reference Rigas, Morgans and Morrison2017) presented a model for the evolution of laminar global modes in the transitional regime describing weakly nonlinear interaction based on the Stuart–Landau equations. The model predictions matched experimental observations showing that the shedding frequency increases above
  $f_0$ and the synchronization interval increases with the excitation amplitude. While the vortex formation and shedding process for the cylindrical wake differs from the Kármán process, the results of this study highlight the importance of the interactions between the actuation pulses and the separated shear layers in determining the wake response.
1.2. Actuation using moving cylinders or incoming flow perturbations
The lock-on phenomenon specifically related to the Kármán shedding mode has been studied in greater detail using other actuation methods. Relevant to this study are works related to oncoming flow perturbations, 2-D cylinders undergoing streamwise oscillations or unsteady rotation. By analogy to the classical Stokes’ second problem for oscillating plates, these actuations change the rate at which vorticity is generated on the body, which is subsequently transported in the shear layers.
Direct numerical simulation studies at  $Re=110$ past a cylinder undergoing sinusoidally modulated rotation were conducted by Baek et al. (Reference Baek, Lee and Sung2001). For actuation amplitudes, given as the ratio of the maximum surface velocity to
  $U_\infty$, approximately 0.1, synchronization of Kármán-type shedding occurs at
  $f_a \simeq f_{sh}$ and
  $2f_{sh}$. These results suggest that altering the rate of vorticity generation also plays a role in the synchronization process.
The wake response of a circular cylinder undergoing forced streamwise oscillations in a uniform stream depends strongly on the excitation amplitude  $A^*=A/D$, with
  $A$ the maximum cylinder displacement. Direct numerical simulation studies for
  $Re<400$ (Leontini, Jacono & Thompson Reference Leontini, Jacono and Thompson2013; Tang et al. Reference Tang, Cheng, Tong, Lu and Zhao2017) show that forcing the wake at very large excitation,
  $A^*>0.5$, causes the shedding mode to change and synchronize, albeit for very short lock-on intervals for ratios
  $f_{sh}/f_a=n/m$ with
  $n$ and
  $m$ integers. Lock-on regimes at
  $f_a \simeq f_{sh}$ and
  $f_a \simeq 3f_{sh}$ are observed for lower excitation thresholds,
  $A^*\geq 0.15$, but these give rise to symmetric shedding patterns (Ongoren & Rockwell Reference Ongoren and Rockwell1988; Xu, Zhou & Wang Reference Xu, Zhou and Wang2006) similar to those for cylinder wakes actuated with a synthetic jet (Feng et al. Reference Feng, Wang and Pan2011). Particularly pertinent to the present study is that synchronization and lock-on of the Kármán shedding mode at
  $f_a \simeq 2f_{sh}$ occurs for small excitations,
  $A^*\approx 0.06$ (Griffin & Ramberg Reference Griffin and Ramberg1976), which supports the view that the wake response to weak and strong perturbations differs.
Vortex shedding lock-on for a circular cylinder immersed in a uniform stream with superposed sinusoidal perturbation has been studied experimentally and numerically for  $120 \leq Re \leq 2580$. For large perturbation amplitude wavelength relative to
  $D$, the wake response to
  $f_a$ is similar to that for cylinders undergoing low-amplitude streamwise oscillations (Konstantinidis & Balabani Reference Konstantinidis and Balabani2007; Griffin & Hall Reference Griffin and Hall1991). Synchronization and lock-on of Kármán shedding at
  $f_a \simeq 2f_{sh}$ and
  $4f_{sh}$ is reported (Kim, Yoo & Sung Reference Kim, Yoo and Sung2006; Kim et al. Reference Kim, Park, Park, Bae and Yoo2009; Konstantinidis & Liang Reference Konstantinidis and Liang2011; Konstantinidis & Bouris Reference Konstantinidis and Bouris2016), accompanied by shorter recirculation regions and increased drag.
Konstantinidis, Balabani & Yianneskis (Reference Konstantinidis, Balabani and Yianneskis2005) examined the timing of vortex shedding during  $f_a \simeq 2f_{sh}$ lock-on (
 $1.74\leq f_a/f_0 \leq 2.2$). They observed that the circulation of the forming vortex increased monotonically up to the shedding event, which coincided with the maximum transverse velocity along the wake centreline. They concluded that the shedding event is determined by the time when the opposing shear layer penetrates the wake and interrupts the transport of vorticity feeding the forming vortex.
During Kármán shedding lock-on due to weak perturbations, two vortex patterns in the wake have been reported: the classical Kármán 2S pattern (single counter-rotating vortices shed alternately from opposing sides); and 2P-like patterns. The 2P-like patterns consist of co-rotating vortices on each side of the cylinder. This pattern differs from the counter-rotating pair 2P pattern reported for transverse oscillating cylinders (Griffin & Ramberg Reference Griffin and Ramberg1976; Williamson & Roshko Reference Williamson and Roshko1988) and its origin remains unclear.
The previous studies show that, for weak perturbations, different actuation methods influence the wake dynamics similarly. However, a physical mechanism, describing how the actuation interacts with the forming Kármán vortices resulting in lock-on and the observed changes in the wake shedding patterns, remains poorly understood.
1.3. Rationale and objectives
The present study focuses on investigating the influence of actuation on the turbulent wake of a 3-D cantilevered triangular prism, of aspect ratio 4, protruding a thin boundary layer. The unactuated flow at high Reynolds number past similar triangular prisms has been studied by Buresti & Iungo (Reference Buresti and Iungo2010) and Iungo & Buresti (Reference Iungo and Buresti2009). The wake is similar to wakes of cantilevered square cylinders (Bourgeois, Noack & Martinuzzi Reference Bourgeois, Noack and Martinuzzi2013; Wang & Zhou Reference Wang and Zhou2009). This simple configuration was selected for several heuristic reasons. Since the separation points are fixed, the influence of the Reynolds number is expected to be small. For this aspect ratio and thin boundary layers, the wake fluctuations are periodic, suggesting a Kármán process, and the influence of the end conditions is local. Ongoren & Rockwell (Reference Ongoren and Rockwell1988) showed that the synchronization characteristics for a 2-D triangular prism undergoing streamwise oscillation are similar to those for a cylinder, but the wake patterns are more easily interpreted because the ‘wake swinging’ due to movement of the separation point is eliminated. For triangular prisms, flow separation occurs at the trailing edges, thus avoiding complications due to after-body interference downstream of leading edge separation as occurs for square cylinders.
This work contributes to the fundamental understanding of how weak periodic perturbations excite a strong wake response as a function of actuation frequency. To this end, the wake is forced using synthetic jets pulsed at constant frequency. The jet-exit slits are located directly behind the trailing edges and span the obstacle height. The actuation pulses interact with the shear layers downstream of the separation, allowing a clear visualization of the interaction process. Flow fields acquired from particle image velocimetry (PIV) and surface pressure measurements are used to examine the mechanisms underlying lock-on of the Kármán shedding process and vortex splitting in the wake. A phenomenological model is proposed to account for multiple lock-on intervals. The remainder of this work is organized as follows. The experimental configuration and analysis methodology are presented in § 2. Experimental results, characterizing unactuated and actuated flow over the triangular prism, are presented and discussed in § 3. This section also details the proposed phenomenological model. Finally, concluding remarks are presented in § 4.
2. Experimental set-up
2.1. Experimental facility and geometry
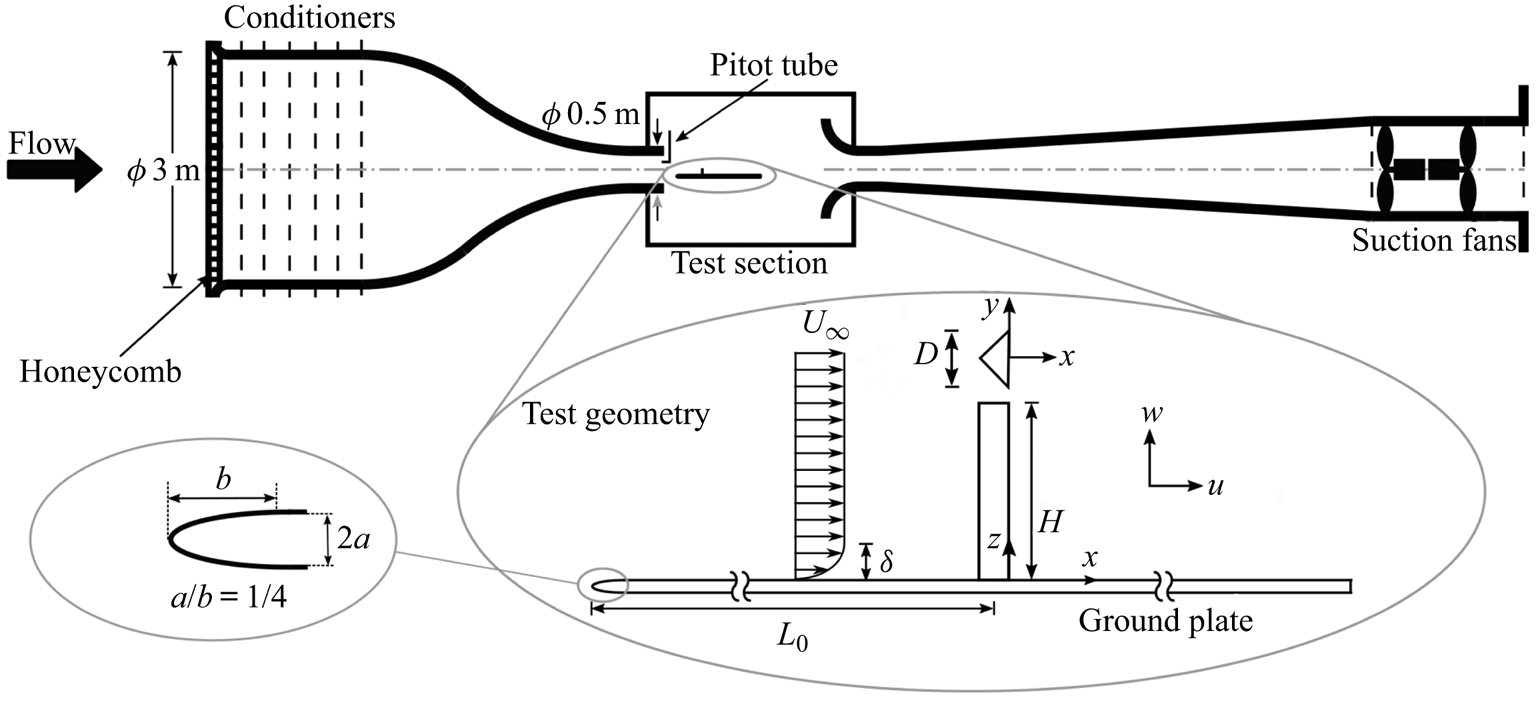
Experiments are conducted in an open circuit suction wind tunnel shown schematically in figure 1. The nozzle inlet diameter is 3 m and the inlet area-contraction ratio is  $36:1$. The open working section has a jet diameter of 0.5 m. The free-stream velocity is monitored using a Pitot tube, mounted in the test section inlet and is maintained through a feedback variable frequency controller. The free-stream velocity can be adjusted in the range of
  $U_\infty =5$ to
  $40\ \textrm {m}\,\textrm {s}^{-1}$. The nominal free-stream turbulence is less than
  $0.3\,\%$.

Figure 1. Schematic view of the wind tunnel and experimental model, including the basic nomenclature and coordinate definitions;  $L_0/D= 12.5$,
  $2a= 7\ \textrm {mm}$,
  $D= 40\ \textrm {mm}$,
 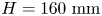 $H= 160\ \textrm {mm}$. Centroid is located along
  $y=0$,
  $D/6$ upstream of the leeward face (chord centre).
The experimental geometry is mounted on a horizontal machined-flat plate rigidly suspended in the test section. The dimensions of the plate are  $1330\ \textrm {mm}\times 760\ \textrm {mm} \times 7\ \textrm {mm}$. The plate leading edge is a
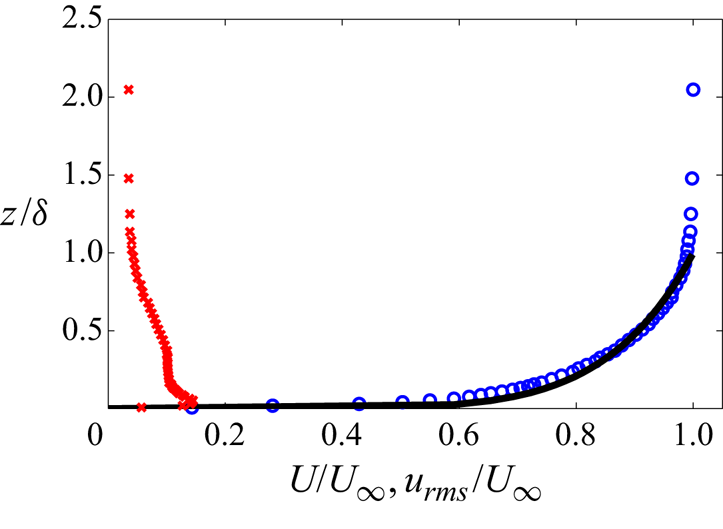
  $1:4$ ellipse with a zero gradient smooth transition to the plate along the minor axis. A tripping tape is mounted at the transition between the ellipse and the flat plate. The boundary layer is fully turbulent and the profiles match those of a canonical boundary layer. Sample profiles of the mean streamwise velocity component,
  $U$, and root-mean-square (r.m.s.) of its fluctuations,
  $u_{rms}$, for the flow in the absence of the obstacle at its location from the plate leading edge are shown in figure 2.

Figure 2. Undisturbed boundary layer profile at obstacle location: mean streamwise velocity  $U$ (
$U$ ( $\circ$, blue), 1/7th power law turbulent boundary layer (
 $-$), root-mean-square (r.m.s.) of velocity fluctuations
  $u_{rms}$ (
 $\times$, red). Boundary layer parameters are: boundary layer thickness,
  $\delta =8.77\ \textrm {mm}$,
  ${\delta }/{H} \approx 0.055$; displacement thickness,
  ${\delta ^*}/{\delta }=0.016$; momentum thickness,
  ${\theta }/{\delta }=0.011$; and shape factor,
  ${\delta ^*}/{\theta }=1.41$.
The obstacle is a finite aspect ratio,  $AR$, triangular prism mounted vertically on the flat plate. Its cross-section is a
  $90^\circ$ isosceles triangle. The characteristic length (width,
  $D$) and height (
 $H$) of the triangular prism are 40 mm and 160 mm, respectively, for
  $AR$=
$AR$= $H/D=4$. The obstacle centroid is located on the plate at
 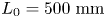 $L_0=500\ \textrm {mm}$ (12.5
  $D$) from the leading edge. A Cartesian coordinate system (
 $x$,
$x$,  $y$,
$y$,  $z$) with the origin at the chord centre of the obstacle base is used (figure 1), such that the leeward face is located along
  $x=0$. The
  $x$,
$x$,  $y$ and
  $z$ coordinates are aligned in the streamwise, transverse and spanwise (height) directions, respectively, with corresponding velocity components
  $u$,
$u$,  $v$,
$v$,  $w$. Mean velocity components are denoted
  $U$,
$U$,  $V$,
$V$,  $W$ and fluctuating components
  $u^\prime$,
  $v^\prime$,
  $w^\prime$.
2.2. Pressure sensing system
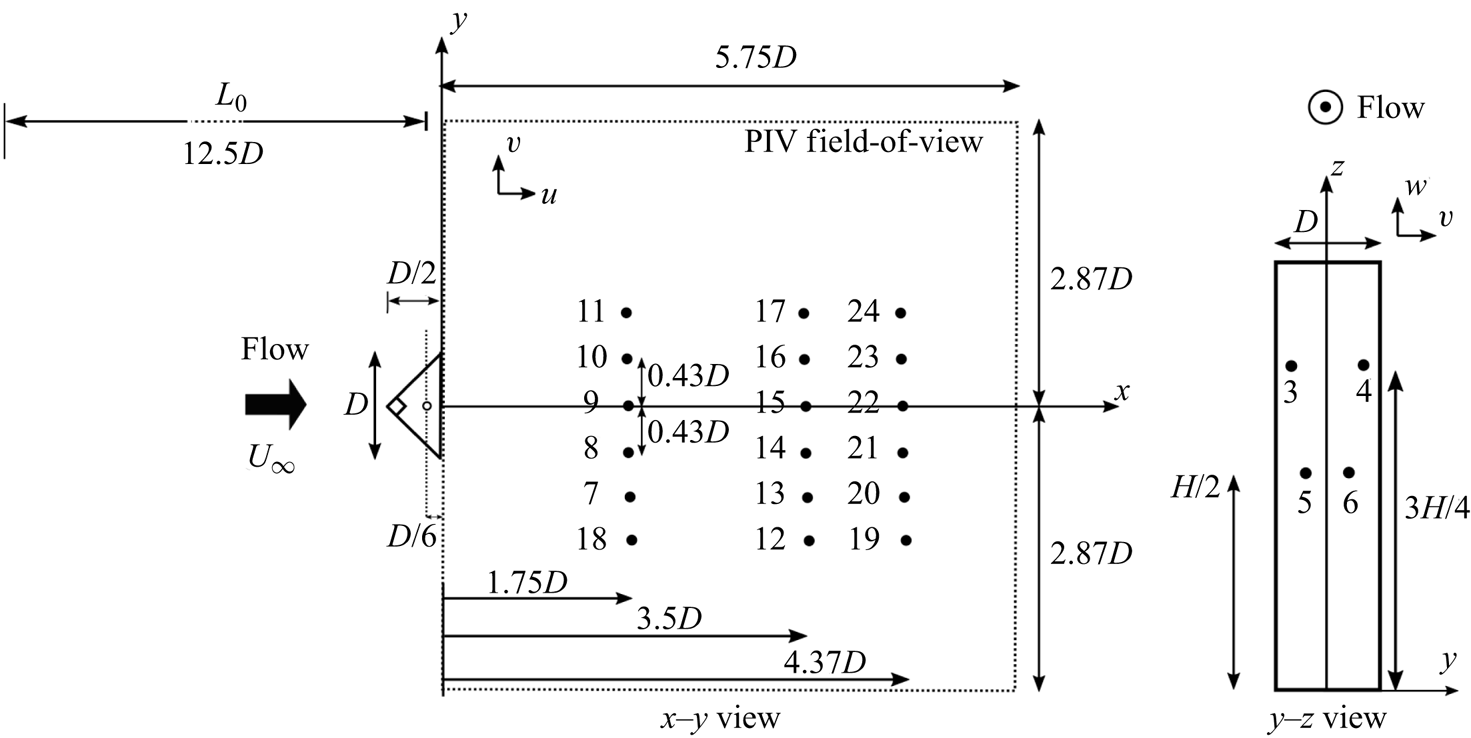
Measurements of the surface pressure are conducted through a pressure tapping system. There are four pressure taps on the leeward face of the obstacle and 18 on the flat plate in the prism wake arranged as depicted in figure 3. The pressure taps have a diameter of 0.5 mm. They are connected via soft, transparent polymer (Tygon) tubes to the differential pressure transducers (All Sensors Corp model 5 INCH-D1-4V-MINI). The transducer accuracy is  ${\pm }0.05\,\%$ of full scale which corresponds to
  ${\pm }1.25\ \textrm {Pa}$ for an instantaneous pressure measurement. Pressure data are acquired simultaneously using six 4-channel National Instrument modules NI9234 with 24-bit ADC resolution, installed on a National Instrument acquisition board (NI cDAQ-9172).

Figure 3. Schematic view of the pressure tap arrangement on the body leeward face and flat plate with coordinate system and nomenclature. Particle image velocimetry field-of-view is shown using dashed lines. Obstacle centroid is depicted by open circle. Black dots represent pressure taps and numbers their identifying designation.
The pressure data are sampled at a rate of 2 kHz and digitally filtered at 250 Hz, which corresponds to the Nyquist frequency of the PIV measurements. The digital filter is an eighth-order low-pass Butterworth filter applied forward and backward to compensate for the phase lag. The frequency response of the pressure tapping system is determined analytically using the model of gas-filled pressure-transducer-sensing-line system (Hougen, Martin & Walsh Reference Hougen, Martin and Walsh1963) and verified experimentally. Pressure ports either on the obstacle or on the flat plate have a flat frequency response up to  ${\sim }150\ \textrm {Hz}$, calculated analytically using the frequency response of the second-order system to a sinusoidal input (Wheeler & Ganji Reference Wheeler and Ganji1996). The analysis is confirmed experimentally. Pressure spectra start to roll-off near the cut-off frequency of 150 Hz. The cut-off frequency is defined at 50 % gain, corresponding to a 6-dB power attenuation.
Pressure data are reported as pressure coefficients 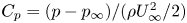 $C_p=(p-p_\infty )/(\rho U_\infty ^2/2)$, where
  $\rho$ and
  $p_\infty$ are the air density and reference free-stream pressure, respectively. Time-averaged pressure and r.m.s. of fluctuating pressure coefficients are denoted
  $\bar {C}_p$ and
  $C_p^\prime$, respectively. Pressure data are acquired for at least three independent trials. For each trial, data are collected for 20 s, which corresponds to approximately 300 shedding cycles (i.e. statistically independent samples) at the lowest velocity (
 $U_\infty =5.2\ \textrm {m}\,\textrm {s}^{-1}$). The uncertainty is estimated following Wheeler & Ganji (Reference Wheeler and Ganji1996) for propagation of bias and precision errors. The maximum uncertainty occurs for
  $U_\infty =5.2\ \textrm {m}\,\textrm {s}^{-1}$ and is
  ${\pm }0.02$ for
  $\bar {C}_p$ and
  ${\pm }0.003$ for
  $C_p^\prime$.
2.3. Zero-net-mass-flux actuator
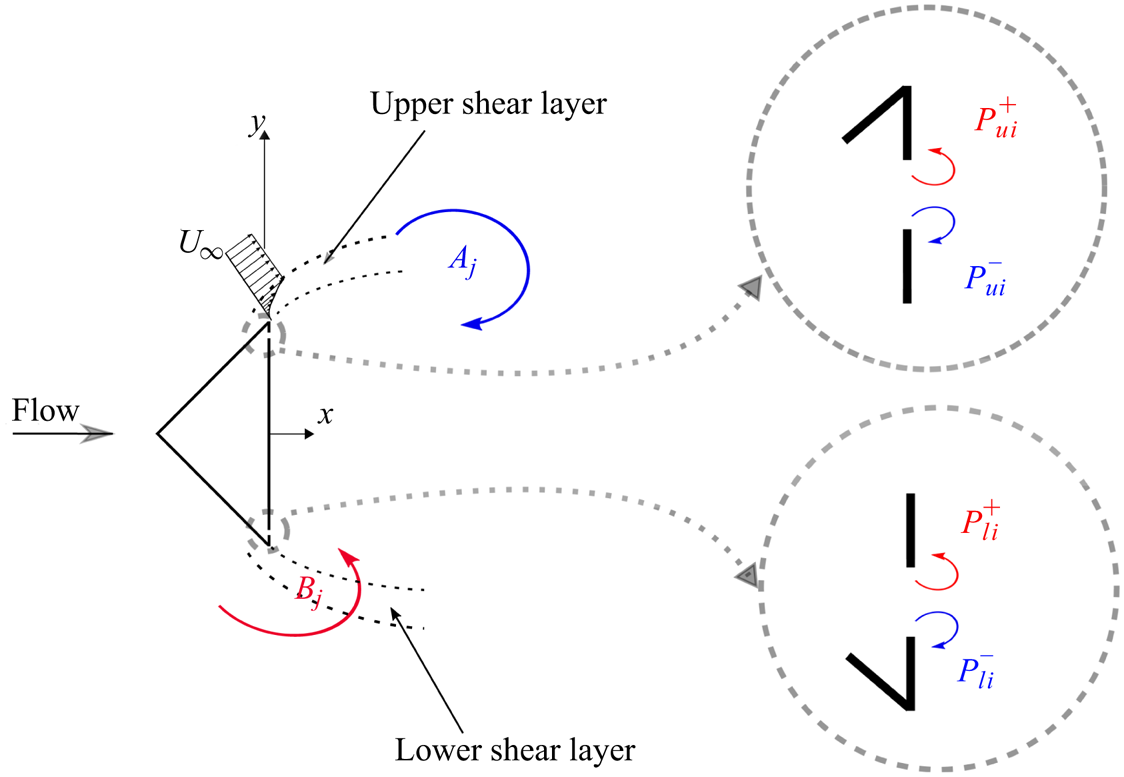
Flow forcing is provided by a zero-net-mass-flux (ZNMF) actuator, schematically shown in figure 4. The ZNMF actuator consists of a cavity, a plate with a small hole (orifice) and oscillating diaphragm. The diaphragm is the surface of a loudspeaker as described below. During a cycle, the net mass flux is zero, but the momentum transfer with the surrounding fluid is non-zero (Holman Reference Holman2006). This cycle (blowing and suction) occurs repeatedly forming a train of vortices discharged into the surrounding flow in the streamwise direction through the spanwise slits, which are located on the leeward face of the prism and starting 1.4 mm from the trailing edge. The slit width is 1.4 mm.
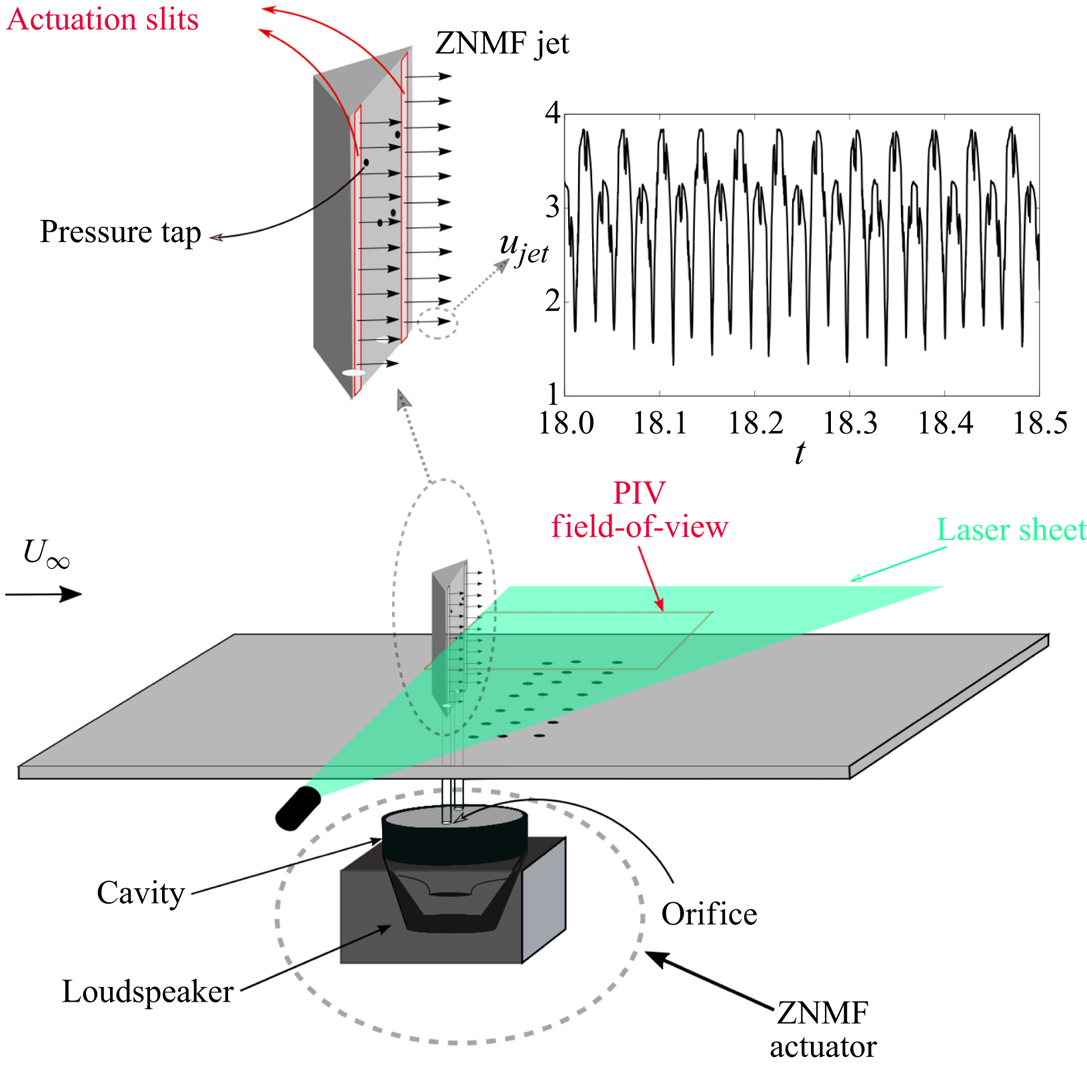
Figure 4. Schematic view of experimental apparatus and time series of the measured jet centreline velocity.
A Dayton Audio 180-6 loudspeaker, mounted inside the cavity, is driven by a Crown 160 MA power amplifier. A sinusoidal signal driving the actuation is generated by the NI myDAQ, sampled at 5 kHz. The cavity, placed underneath the plate holding the obstacle, is connected to the slits through two Tygon tubes. Two forcing parameters are varied in the experiments; the non-dimensional actuation frequency,  $f_a$, and amplitude,
  $c_\mu$. The actuation frequency is typically reported as a ratio of the shedding frequency of the unactuated flow,
  $f_0$. The actuation amplitude is defined as
  $c_\mu =({u_j^2 A_{{slit}}})/({U_\infty ^2 A_{{Proj}}})$, where
  $u_j$ and
  $A_{{slit}}$ are the maximum jet velocity and slit area, respectively, and
  $A_{{Proj}}=DH$ is the projected area of the obstacle.
The jet velocity is measured using a single-wire hot wire anemometer (probe model TSI 1210 and bridge model TSI IFA300) operating in constant temperature mode. The hot wire probe is placed at the slit exit to measure the jet centreline velocity. The output voltage from hot wire anemometer is calibrated using King's law ( $E^2=\alpha +\beta u^n$), where
  $E$ and
  $u$ are the induced voltage from anemometer and flow velocity, respectively. The calibration coefficients are
  $\alpha =0.62$,
  $\beta =0.33$ and
  $n=0.43$. The time series obtained from hot wire anemometer for the jet signal is a rectified wave as shown in figure 4. Because of directional ambiguity, the signal is the jet velocity magnitude. The larger and smaller peaks correspond to blowing and suction, respectively. The jet velocity,
  $u_j$, is the maximum measured jet centreline velocity for each actuation parameter.
2.4. Particle image velocimetry
Two-component PIV is performed using a LaVision Flow Master system along the horizontal  $x$–
$x$– $y$ planes
  $z/H=0.25$ and 0.5 downstream of the obstacle at
  $Re={UD}/{\nu }=12\,000$, with
  $\nu$ the kinematic viscosity of air and
  $U_\infty = 5.2\ \textrm {m}\,\textrm {s}^{-1}$ the free-stream velocity. A single-cavity Photonix Industries DM40-527 Nd-YLF laser (wavelength 527 nm) is utilized to generate a laser sheet approximately 2 mm thick using a cylindrical-spherical lens combination (focal lengths: 800 mm and
  $-$20 mm). The PIV field-of-view is
  $230\ \textrm {mm}\times 230\ \textrm {mm}$ corresponding to
  $5.75D \times 5.75D$ and captured by a Photron Fastcam SA4 CMOS camera with
  $1024\times 1024$ pixel resolution. The camera is mounted normal to the laser sheet. The PIV field-of-view is depicted schematically in figure 3.
Olive oil seeding particles of mean diameter of approximately  $1\ {\rm \mu}\textrm{m}$ are generated by TSI 9307-6 six-jet Laskin nozzles and enter the wind tunnel upstream of the large contraction. Particle image velocimetry is conducted at a sampling rate of 500 Hz giving approximately 25–30 snapshots per shedding cycle to resolve the interaction of the actuation pulse with the forming vortices. Image pairs are taken with a laser pulse separation time of 200
  ${\rm \mu}$s in which each particle moves approximately six pixels at
  $U_\infty =5.2\ \textrm {m}\,\textrm {s}^{-1}$. Particle position can be resolved to within 0.1 pixel. In each trial, 2700 frames are recorded corresponding to 90 shedding cycles for the unactuated case. Six trials of 2700 snapshots are recorded for each case. The first and second statistical moments as well as proper orthogonal decomposition (POD) spatial modes converge within four and five trials, respectively.
The Lavision Davis 8.4 software is employed to process the particle images. The multi-pass post-processing algorithm is used to calculate the velocity vector field. The initial and final interrogation windows are selected as 64  $\times$ 64 pixel with 50 % overlap and
  $32 \times 32$ with 50 % overlap, respectively. The final interrogation window provides the vector spacing of
  $0.09D$ in
  $x$- and
  $y$-directions. It is verified that peak locking does not occur for these selected acquisition and processing parameters. Accepted trials contain instantaneous velocity vector fields with less than 1.5 % missing/rejected vectors, called ‘bad vectors’. Bad vectors are replaced with interpolated values.
The uncertainty estimation algorithm in Lavision Davis 8.4 following Wieneke (Reference Wieneke2015) is used to estimate the uncertainty on the instantaneous velocity vectors. The uncertainty in instantaneous velocity vectors is estimated to be  $\Delta \boldsymbol {u} /U_\infty \approx \pm 0.079$. The maximum uncertainty in mean velocity vectors and Reynold stresses are estimated to be
  $\boldsymbol {\Delta } \boldsymbol {U} /U_\infty \approx \pm 0.025$ and
  $\boldsymbol {\Delta } \overline {u^\prime _i u^\prime _j} /U_\infty ^2 \approx \pm 0.008$, respectively, following the method proposed by Benedict & Gould (Reference Benedict and Gould1996).
2.5. Analysis methodology
Particle image velocimetry data are subject to a Reynolds decomposition into time-averaged ( $\boldsymbol {U}$) and fluctuation components (
 $\boldsymbol {u}^\prime$),
 \begin{equation} \boldsymbol{u}(\boldsymbol{x},t)=\boldsymbol{U}(\boldsymbol{x})+\boldsymbol{u}^\prime(\boldsymbol{x},t), \end{equation}
where bold symbols represent vectors. The Reynolds stresses are defined using the Cartesian tensor components  $\overline {u_i^\prime u_j^\prime }$.
The fluctuating field is further analysed using the snapshot POD method,
 \begin{equation} \boldsymbol{u}^\prime(\boldsymbol{x},t)=\sum_{i=1}^N a_i(t)\boldsymbol{\varPhi}_i(\boldsymbol{x}), \end{equation}
where  $\boldsymbol {x}$ and
  $t$ are respectively spatial and temporal arguments,
  $\boldsymbol {\varPhi }_i(\boldsymbol {x})$ is the spatial basis function (mode) and
  $a_i(t)$ is its temporal coefficient (Holmes et al. Reference Holmes, Lumley, Berkooz and Rowley2012). Here
  $N$ denotes the number of all spatial modes which is equal to the number of acquired snapshots.
A low-order model is obtained using the  $M$ first (most energetic) modes (
 $M < N$), which define the coherent field
 \begin{equation} \boldsymbol{u}_c^\prime(\boldsymbol{x},t)=\sum_{i=1}^{M} a_i(t) \boldsymbol{\varPhi}_i(\boldsymbol{x}). \end{equation}
Modes are ranked by their energy content relative to the total kinetic energy (TKE),
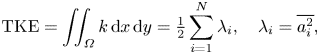 \begin{equation} {\rm TKE}= \iint_\varOmega k \, {\textrm{d}x}\,{\textrm{d}y} = \tfrac{1}{2} \sum_{i=1}^{N} \lambda_i, \quad \lambda_i=\overline{a_i^2}, \end{equation}
where  $k=(\overline {{u^ \prime }^2}+\overline {{v^ \prime }^2})/2$ is the 2-D approximation to the local turbulent kinetic energy and
  $\varOmega$ the PIV domain. The low-order representation of the flows is reconstructed using the first
  $M=24$ modes in order to capture the actuation pulses. Additional modes affect negligibly the observed flow patterns. For consistency, 24 modes were also used for the unactuated case. The 24-mode reconstructions account for 58 % and 70 % of the TKE for unactuated and actuated flows, respectively. For all cases, the two most energetic modes are associated with the fundamental frequency of vortex shedding. These represent approximately 25 % and 40–48 % of the TKE for unactuated and actuated flows, respectively.
Spectral analysis of the pressure and velocity data is accomplished using a fast Fourier transform. The power spectrum density function (PSDF) of a pressure or velocity signal is defined as
 \begin{equation} {\rm PSDF} = \frac{\|F\|^2}{{\rm \pi} N^2 \Delta f}=\frac{\|F\|^2}{{\rm \pi} N f_s}, \end{equation}
where  $F$,
$F$,  $N$ and
  $f_s$ denote the signal's Fourier coefficients, number of sample points and sampling rate, respectively;
  $\Delta f={1}/{T}$ is the frequency resolution, where
  $T$ is the time acquisition window. By Parseval's identity, the PSDF integrated over the frequency (in Hz) returns the signal variance. The presented PSDFs herein are conducted by averaging the PSDF of the sampled data using Bartlett's method (Bartlett Reference Bartlett1950). Frequencies are reported in non-dimensional form,
  $fD/U_{\infty }$, and the associated uncertainty is
  ${\pm }0.003$.
Cross-correlation and auto-correlation functions are defined as
 \begin{equation} R_{fg}(\tau)=\frac{\dfrac{1}{T}\displaystyle\int_{-({T}/{2})}^{{T}/{2}}f(t)g(t+\tau)\,\textrm{d}t}{\sigma_f \sigma_g}, \end{equation}
where  $f$ and
  $g$ can be fluctuating pressure or velocity and
  $\sigma$ the standard deviation.
3. Results and discussion
In this section results of pressure and PIV measurements are summarized. First, the unactuated flow past the triangular prism for different  $Re$ is considered to provide a baseline for comparison and to assist in the selection of the actuation parameters. Then, the influence of actuation on the wake is investigated. Subsequently, vortex shedding synchronization is examined. Lastly, the influence of actuation on the vortex formation process is considered in detail and a phenomenological model is proposed.
3.1. Characterization of unactuated flow over triangular prism
Figure 5 shows statistical characteristics of the unactuated flow. Transverse profiles of the mean streamwise  $U$ and transverse
  $V$ velocity components at several locations
  $x/D$ are shown in figures 5(a) and 5(b), respectively, and the mean sectional streamlines in figures 5(c)–5(e). The
  $U$ and
  $V$ fields exhibit mirror symmetry about the centreline,
  $y=0$. From the
  $U$-profiles, the thin separated shear layer bounding the base recirculation region is easily identified. This region extends to the saddle point along
  $y=0$ at
  $x/D \approx 3.7$. Two foci are located symmetrically about
  $y=0$ at
  $x/D \approx 2.8$. Upstream of the foci,
  $U$ decreases and
  $V$ is directed away from the centreline, while downstream
  $V$ is directed towards
  $y=0$ and
  $U$ increases towards the wake recovery region.
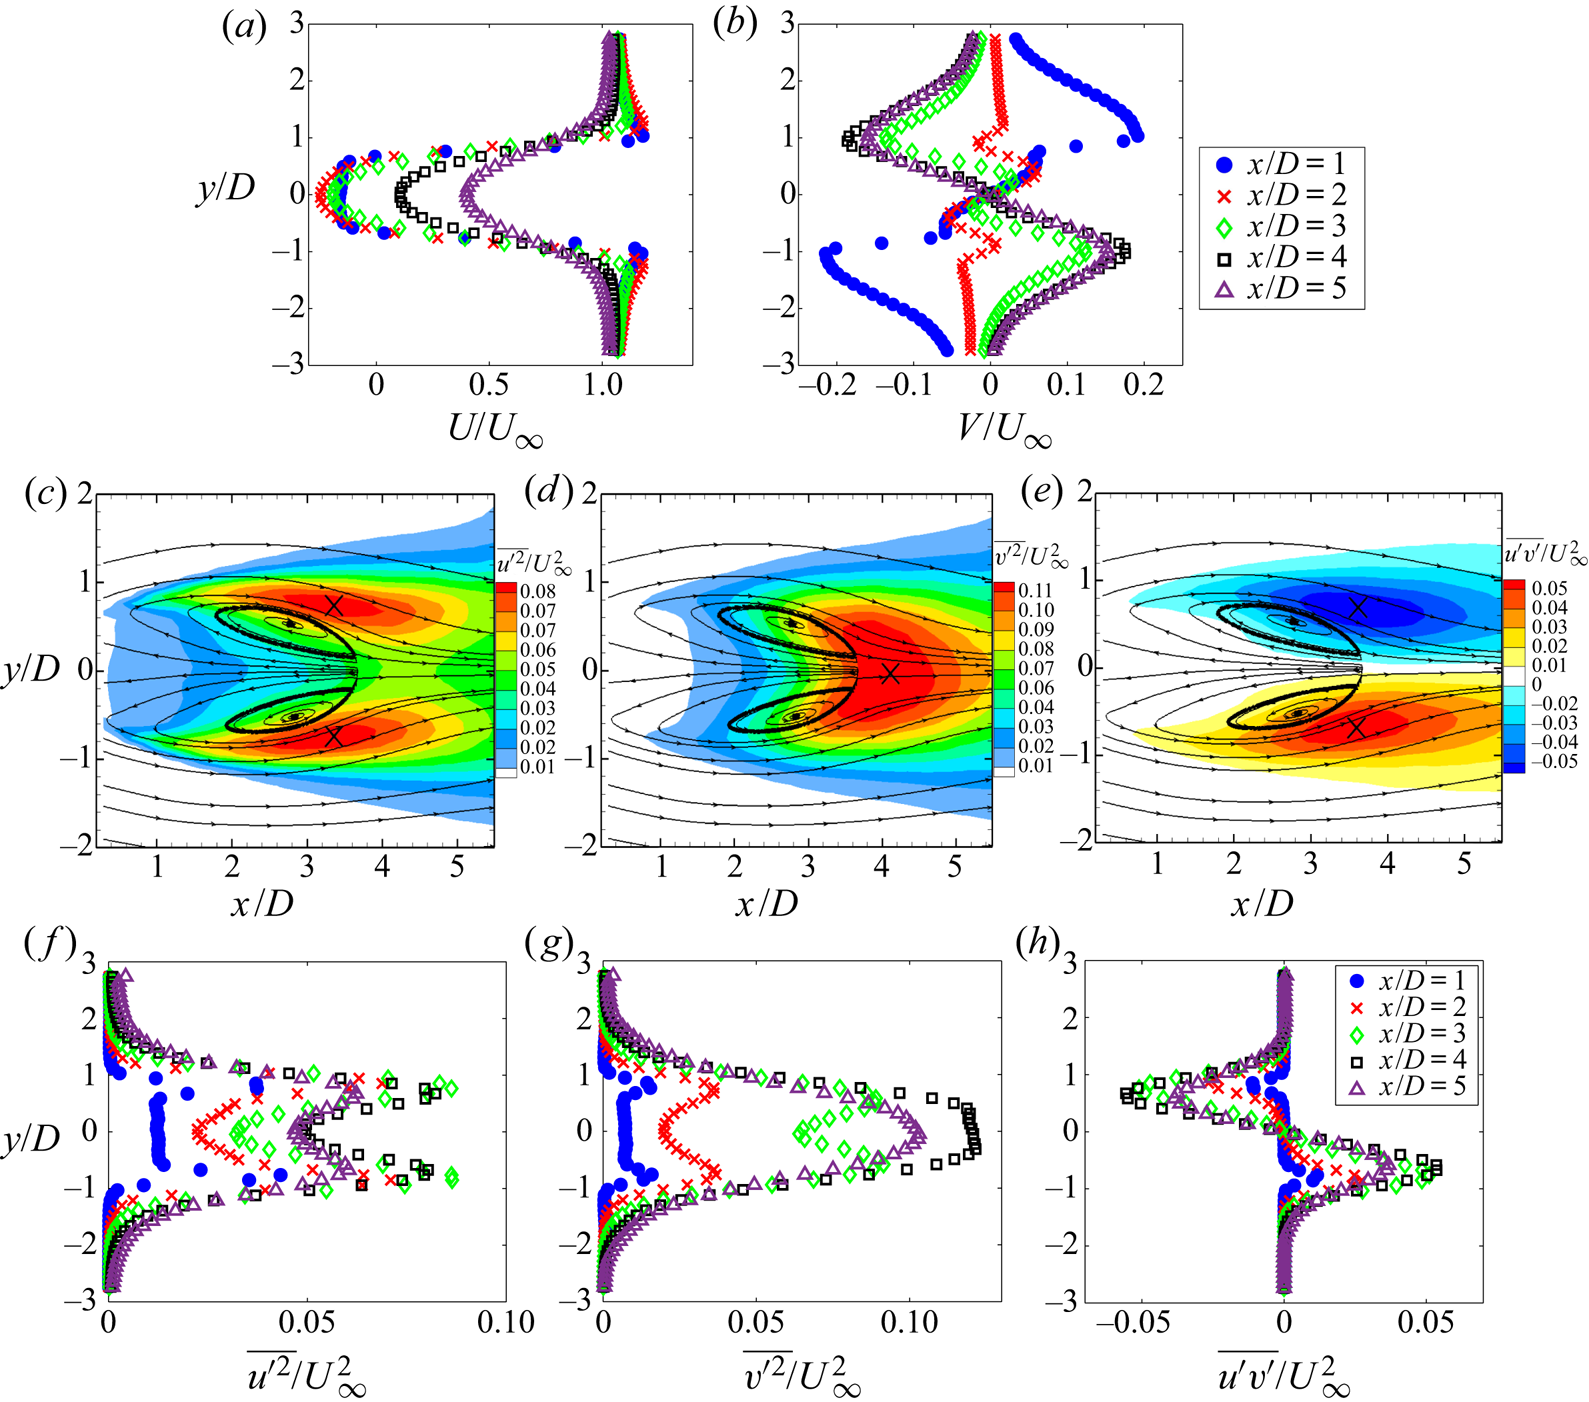
Figure 5. Transverse profiles at different  $x/D$ for (a)
  $U$ and (b)
  $V$. Mean sectional streamlines and overlaid isocontours of Reynolds stresses in the plane
  ${z}/{H}=0.5$: (c)
  ${\overline {u^{\prime 2}}}/{U_\infty ^2}$ (d)
  ${\overline {v^{\prime 2}}}/{U_\infty ^2}$: (e)
  ${\overline {u^{\prime } v^{\prime }}}/{U_\infty ^2}$. The locations of maximum Reynolds stresses are marked by a
  $\times$ on the isocontours. Transverse profiles of Reynolds stresses along
  ${z}/{H}=0.5$ at the different
  $x/D$: (f)
  ${\overline {u^{\prime 2}}}/{U_\infty ^2}$: (g)
  ${\overline {v^{\prime 2}}}/{U_\infty ^2}$: (h)
  ${\overline {u^{\prime } v^{\prime }}}/{U_\infty ^2}$.
The Reynolds stress distributions are qualitatively very similar to those for other bluff bodies characterized by periodic vortex shedding. Figures 5(c) and 5(f) show isocontours and transverse profiles of the streamwise Reynolds normal stress ( ${\overline {u^{\prime 2}}}/{U_\infty ^2}$). The distribution of
  $\overline {u^{\prime 2}}$ is symmetric about
  $y=0$. The peaks coincide with the separated shear layers. Isocontours and transverse profiles of the transverse Reynolds normal stress (
 ${\overline {v^{\prime 2}}}/{U_\infty ^2}$) are shown in figures 5(d) and 5(g). Downstream of the recirculation region, a single-peak pattern of
  $\overline {v^{\prime 2}}$ is observed with maxima occurring along the centreline. The
  $\overline {v^{\prime 2}}$ profiles show a double-peak pattern within the recirculation region. Isocontours and transverse profiles of the Reynolds shear stress (
 ${\overline {u^{\prime } v^{\prime }}}/{U_\infty ^2}$) are antisymmetric about
  $y=0$ with high values concentrated along the shear layers, as seen in figures 5(e) and 5(h). Maxima in
  $\overline {u^{\prime } v^{\prime }}$ occur close to the location of
  $\overline {u^{\prime 2}}$ maxima.
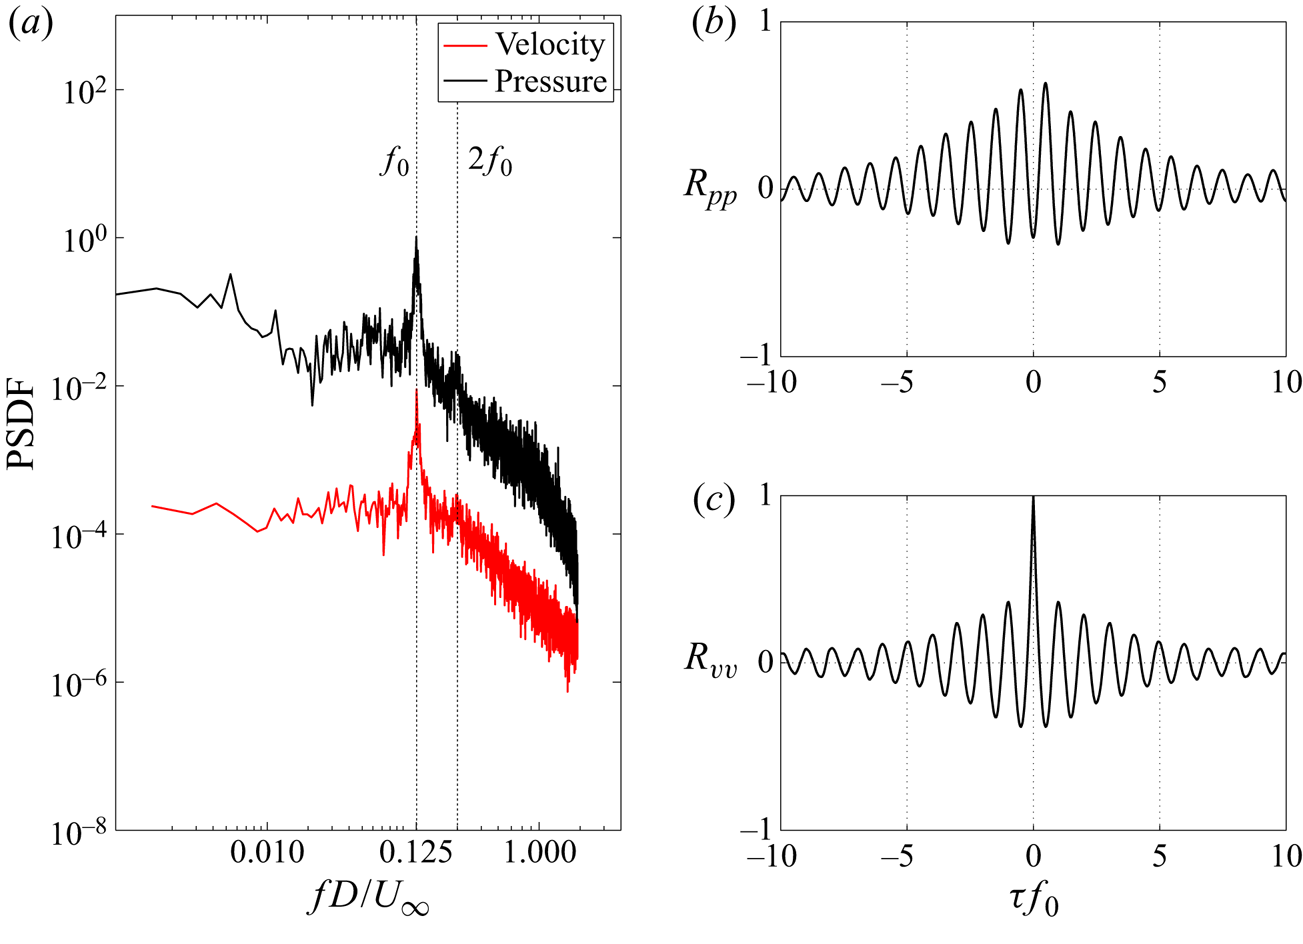
Figure 6(a) shows the PSDF of the fluctuating surface pressure, recorded at pressure tap 8 on the plate ( $x/D=1.75$,
  $y/D=-0.43$) and PSDF of transverse velocity fluctuations (
 $v^ \prime$), acquired by PIV, at the point (
 $x/D=3.98$,
  $y/D=-0.314$,
  $z/H=0.5$) corresponding to the location of the maximum
  ${\overline {v^{\prime 2}}}/{U_\infty ^2}$. Pronounced spectral peaks, centred around the frequency
  $f_0$, appear in both pressure and velocity spectra. As discussed below, this frequency corresponds to the fundamental frequency of vortex shedding and is denoted by the Strouhal number
  $St={f_0D}/{U_\infty }=0.125$. Figure 6(b) illustrates the cross-correlation of the pressure signals, recorded at symmetric locations in the wake (tap 8 and 10:
  $x/D=1.75$,
  $y/D={\pm } 0.43$). The cross-correlation displays a strong periodicity at
  $f_0$ and the pressure signals are out-of-phase by a half-cycle (
 $180^\circ$), which is consistent with the alternate shedding of counter-rotating vortices in the wake from opposing sides of the obstacle. In figure 6(c) the auto-correlation of
  $v^ \prime$ shows the same dominant oscillation frequency. Henceforth, the Strouhal number for the unactuated wake is referred to as
  $St_0$.

Figure 6. (a) Power spectrum density function of pressure on the plate in the wake at tap 8 ( $x/D=1.75$,
  $y/D=-0.43$) and
  $v^ \prime$ at maximum
  ${\overline {v^{\prime 2}}}/{U_\infty ^2}$ (
 $x/D=3.98$,
  $y/D=-0.314$,
  $z/H= 0.5$). (b) Cross-correlation function of pressure data between symmetrically located surface pressure tap 8 (
 $x/D= 1.75$,
  $y/D=-0.43$) and tap 10 (
 $x/D= 1.75$,
  $y/D=0.43$) in the wake. (c) Auto-correlation function of
  $v^ \prime$ at the location of maximum
  ${\overline {v^{\prime 2}}}/{U_\infty ^2}$.
For this geometry, flow separation is expected to be fixed at the sharp trailing edges. Hence,  $St$ and the base (leeward face) pressure coefficient are expected to be insensitive to the Reynolds number over a wide range. Here the influence of
  $Re$ in the range of 12 000–45 400 is examined and a suitable
  $Re$ for the actuated flow investigations determined.
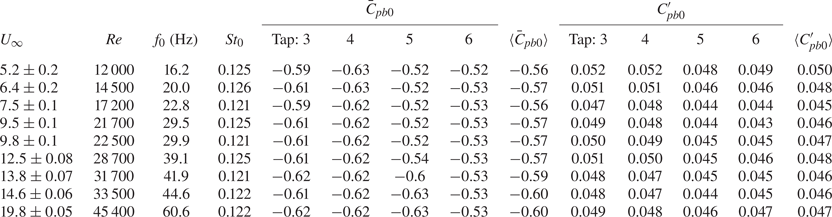
Table 1 shows the influence of  $Re$ on the shedding frequency and base pressure for the unactuated flow. The non-dimensional shedding frequency,
  $St_0$, is constant within the experimental uncertainty. Here
  $\bar {C}_{pb0}$ and
  ${C^\prime _{pb0}}$ are the mean and fluctuating base pressure coefficients, respectively, at pressure tap locations on the obstacle leeward face. Both
  $\bar {C}_{pb0}$ and
  ${C^\prime _{pb0}}$ change negligibly with the
  $Re$ and are very similar for the four taps. Hence, the averages of these four taps,
  $\langle \bar {C}_{pb0}\rangle$ and
  $\langle C^\prime _{pb0} \rangle$ with
  $\langle \cdot \rangle$ denoting the spatial average, are considered representative of the base pressure.
Table 1. Effect of the Reynolds number on the shedding frequency and base pressure coefficients for the unactuated flow.

Considering the base flow and measurement system characteristics, detailed investigations of the influence of actuation frequency on wake dynamics will be conducted at  $Re=12\,000$. Given a pressure system cut-off frequency of 150 Hz and
  $St_0= 0.125$ (
 $\,f_0 \simeq 16\ \textrm {Hz}$), the critical range of frequency excitation ratios discussed in the literature can be covered. Although a lower
  $Re$ allows achieving a higher range of excitation amplitude
  $C_\mu$, for
  $Re < 12\,000$ the pressure fluctuations on the leeward face, which scale with dynamic pressure
  $(\rho U_\infty ^2)/2$, are not high enough to be captured within acceptable experimental uncertainty due to the sensitivity of the pressure sensing system.
For 2-D triangular prisms, numerical and experimental studies at  $Re=520$ (Agrwal, Dutta & Gandhi Reference Agrwal, Dutta and Gandhi2016) and
  $Re \simeq 10 ^4$ (Yagmur et al. Reference Yagmur, Dogan, Aksoy, Goktepeli and Ozgoren2017) have shown that the vortex formation and shedding process is similar to that described by Gerrard (Reference Gerrard1966). However, the vortex formation and shedding process for 3-D cantilevered triangular prisms has not been characterized. Since a physical understanding of the vortex formation process is key for characterizing the influence of actuation, the vortex formation and shedding process for the unactuated flow is first examined to establish a baseline for comparison.
The shedding process for the unactuated flow at  $Re=12\,000$ is illustrated based on the 24-mode low-order representation. Figure 7 shows flooded isocontours of the vorticity,
  $\omega _z$, for an arbitrarily chosen shedding cycle. Overlaid in these figures are instantaneous velocity vectors (only every sixth vector is shown to avoid clutter) and green curves of
  $Q=0$ enclosing the vortex cores. The vortex cores are identified from the second invariant of the deformation tensor,
  ${\partial {u_i}}/{\partial {x_j}}$, i.e. the
  $Q$-criterion of Hunt, Wray & Moin (Reference Hunt, Wray and Moin1988) defining a vortex core as closed regions of
  $Q \geq 0$. Selected instantaneous sectional streamlines (blue) are used to visualize the saddle point as needed. The shedding phase
  $\phi$ is determined from the temporal coefficients of the two most energetic modes,
  $a_1$ and
  $a_2$, which capture the fundamental (shedding) frequency, according to
 \begin{equation} \phi = \arctan \left( {\frac {a_2}{a_1} \sqrt{\frac{\lambda_1}{\lambda_2}}} \right). \end{equation}
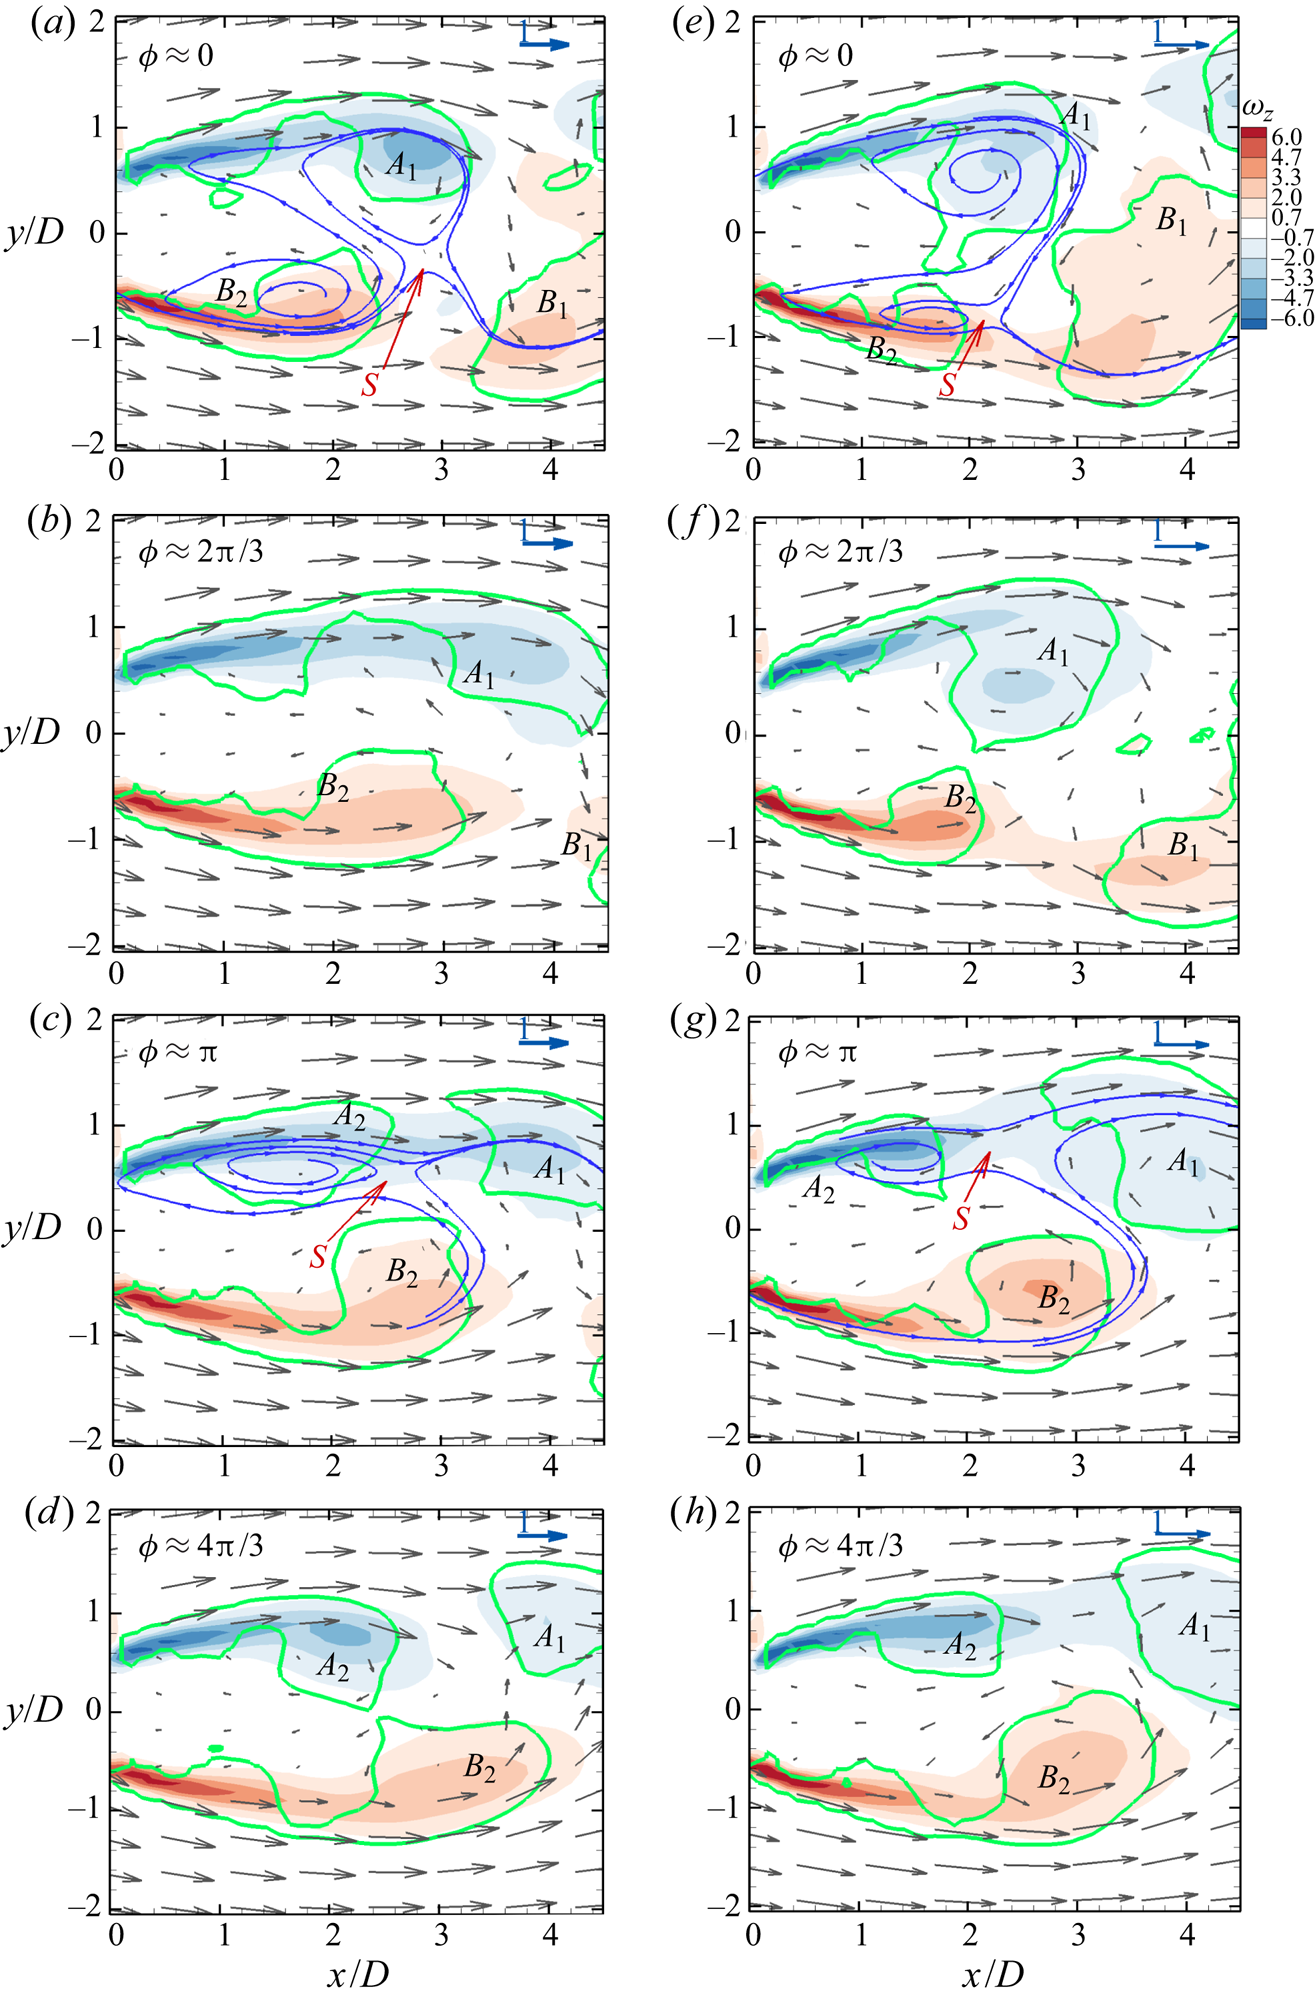
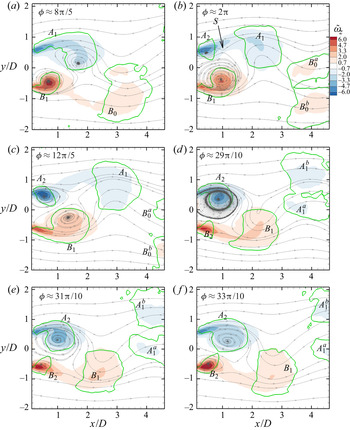
Figure 7. Isocontour of vorticity,  $\omega _z$, based on the 24-mode low-order representation for the unactuated flow with
  $Re=12\,000$ at different phases
  $\phi$ of the shedding cycle in the planes (a–d)
  ${z}/{H}=0.5$ and (e–h)
  ${z}/{H}=0.25$. Overlaid are instantaneous velocity vectors. Selected instantaneous sectional streamlines (blue) are used to visualize the saddle point, marked
  $S$. Green curves (
 $Q=0$) enclose the vortex cores. Here
  $A$ and
  $B$ identify vortices and the subscripts their order of appearance. For clarity, every sixth vector is shown.
For the unactuated flow, the vortex formation and shedding process is similar to the Kármán process as described by Gerrard (Reference Gerrard1966). In figure 7(a), at  $\phi =0$, the vortex
  $B_1$ is in the process of shedding, as indicated by the upstream saddle point
  $S$. The clockwise rotating vortex
  $A_1$ is growing, fed by circulation from the shear layer. In figure 7(b),
  $\phi =2{\rm \pi} /3$, the vortex
  $B_1$ has shed while the vortex
  $A_1$ grows stronger, drawing the shear layer (of opposite-sign vorticity) from the other side of the wake. In figure 7(c), at
  $\phi ={\rm \pi}$, fluid drawn between the vortices
  $A_1$ and
  $B_2$ interferes with the shear layer feeding
  $A_1$. The saddle point
  $S$ appears as vortex
  $A_1$ is cut off from the feeding shear layer. The shed vortex
  $A_1$ is convected downstream as illustrated at
  $\phi =4{\rm \pi} /3$ in figure 7(d). The process is repeated on the opposite side resulting in shedding of
  $B_2$. The vorticity distributions for the plane
  ${z}/{H}=0.25$ at similar shedding phases are given for comparison in figures 7(e)–7(h). The vortex formation and shedding process is seen to be similar in both planes, confirming that end effects are local for the present geometry.
3.2. General characterization of the influence of actuation
The influence of actuation on the flow is characterized for different actuation frequencies and amplitudes at  $Re=12\,000$. The actuation signal is a sinusoidal wave,
  $S(t)=A\sin (2{\rm \pi} f_at+\theta )$. Here
  $A$ and
  $f_a$ denote the actuation amplitude and frequency, respectively, and
  $\theta$ is the phase difference between two actuation slit flows. For the present study, the actuation pulses from the two slits are in phase,
  $\theta =0$. Actuation parameters (
 $A$ and
  $f_a$) required for further investigations are determined below.
The effect of actuation on spatially averaged (average of taps 3–6) mean base pressure coefficient is illustrated in figure 8(a) as a function of  $f_a$ and
  $A$. Here
 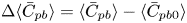 $\Delta \langle \bar {C}_{pb} \rangle = \langle \bar {C}_{pb} \rangle - \langle \bar {C}_{pb0} \rangle$ represents the change in the spatially averaged mean base pressure coefficient, where
  $\langle \bar {C}_{pb} \rangle$ is the spatially averaged mean base pressure coefficient for the actuated flow. These low-frequency actuations only lead to a base pressure reduction and, thus, increase in drag. The most effective actuation frequencies are around
  ${f_a}/{f_0}$= 2.5 and
  ${f_a}/{f_0}$= 5 which decrease the base pressure up to 70 %. For constant
  $f_a$,
  $\langle \bar {C}_{pb} \rangle$ decreases asymptotically with increasing
  $A$. As shown in figure 8(b),
  $\Delta \langle \bar {C}_{pb} \rangle$ approaches a constant value for
  $A \geq 2.4\ \textrm {V}$. Therefore, this actuation amplitude (
 $A= 2.4\ \textrm {V}$) is used to examine the influence of actuation for further investigations. Figure 8(c) displays the contour of jet momentum coefficient
  $C_\mu$ as a function of
  $A$ and
  ${f_a}/{f_0}$. The influence of
  ${f_a}/{f_0}$ on
  $C_\mu$ is shown in figure 8(d) for different
  $A$. For
  $1<{f_a}/{f_0}<8$,
  $C_\mu$ is sufficiently large to affect the wake response and this frequency range is chosen for further investigations. The magnitude of
  $C_\mu$ is insensitive to the elevation
  $z$ for
  ${f_a}/{f_0}<4$. For larger
  $f_a$,
  $C_\mu$ decreases with increasing
  $z$, but remains of the same order.
Figure 8. (a) Effect of actuation signal amplitude  $A$ and frequency
  $f_a$ on
  $\langle \bar {C}_{pb} \rangle$ at
  $Re=12\,000$. (b) Effect of
  $A$ on
  $\langle \bar {C}_{pb} \rangle$ at
  $Re=12\,000$ for selected actuation frequencies. Results are reported as change from the unactuated flow:
  $\Delta \langle \overline {C}_{pb} \rangle = \langle \bar {C}_{pb} \rangle - \langle \bar {C}_{pb0} \rangle$. (c) Effect of
  $A$ and
  $f_a$ on
  $C_\mu$ at
  $Re=12\,000$. (d) Effect of
  $A$ on
  $C_\mu$ at
  $Re=12\,000$ for selected actuation signal amplitudes.
Figure 9 shows the effect of the actuation frequency  $f_a$, for
  $A= 2.4\ \textrm {V}$, on the normalized mean base pressure coefficient (
 ${\bar {C}_{pb}}/{\bar {C}_{pb0}}$) and normalized fluctuating pressure (
 ${ {C^\prime _{pb}}}/{ {C^\prime _{pb0}}}$) coefficients, respectively. The trends as a function of
  $f_a$ for all pressure taps on the obstacle are similar. For compactness, the trends are thus represented by the normalized spatially averaged base pressure coefficients (
 ${ \langle \bar {C}_{pb} \rangle }/{|\langle \bar {C}_{pb0} \rangle |}$ and
  ${ \langle C^\prime _{pb} \rangle }/{ \langle { C^\prime _{pb0}} \rangle }$), also shown in figure 9. Generally, the minima of base pressure occur at approximately
  ${f_a}/{f_0}=2.5$ and 5, respectively, which correspond to maxima in the fluctuation levels.
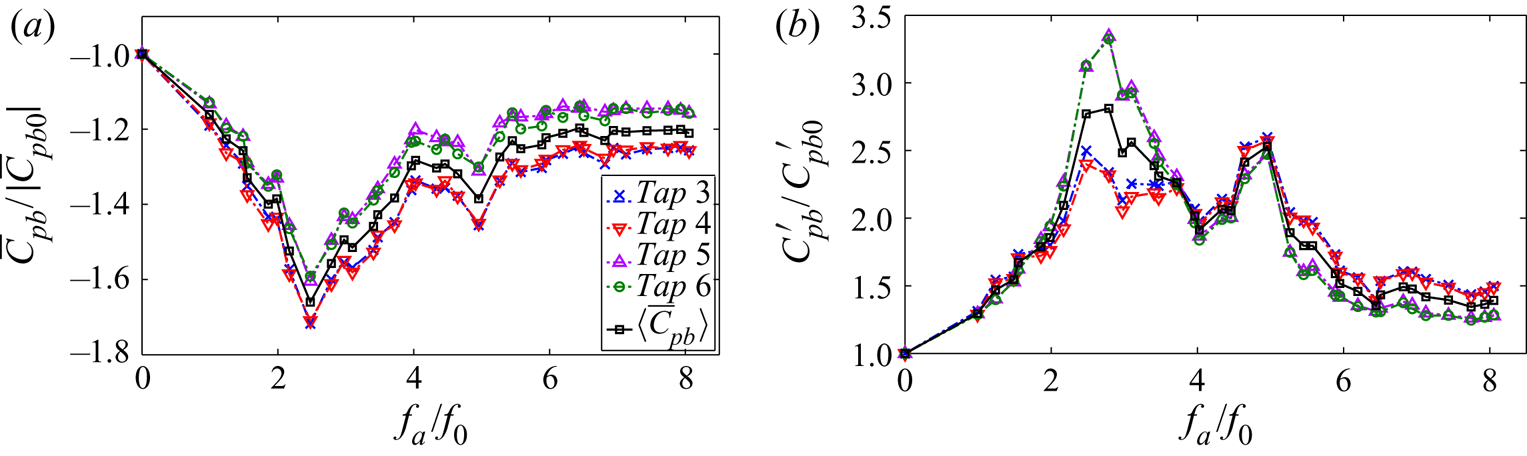
Figure 9. Influence of the actuation frequency  $f_a$ on the base pressure for
  $A=2.4 \ \textrm {V}$ and
  $Re$ = 12 000 (a) normalized mean base pressure coefficient (
 ${\bar {C}_{pb}}/{\bar {C}_{pb0}}$) and normalized spatially averaged mean base pressure coefficient (
 ${ \langle \bar {C}_{pb} \rangle }/{| \langle \bar {C}_{pb0} \rangle |}$),
  $\langle \bar {C}_{pb0} \rangle =-0.537$; (b) normalized fluctuating pressure coefficient
  ${ {C^\prime _{pb}}}/{ {C^\prime _{pb0}}}$ and normalized spatially averaged fluctuating pressure coefficient
  ${ \langle C^\prime _{pb} \rangle }/{ { \langle C^\prime _{pb0}} \rangle }$,
  $\langle C^\prime _{pb0} \rangle =0.050$.
Statistics of actuated and unactuated flows in the plane  ${z}/{H}=0.5$ are compared in figure 10. Figures 10(a)–10(c) display the transverse profiles of Reynolds stresses for the unactuated and the two most effective actuation cases (
 $\,{f_a}/{f_0}$= 2.5 and 5) at the locations of maximum Reynolds stresses. The profile symmetry confirms that the actuation affects the wake symmetrically in the mean. A similar double-peak pattern in
  $\overline {u^{\prime 2}}$ profiles is seen for all cases. The actuation generally increases the level of the Reynolds stresses and, thus, the velocity fluctuations, which is consistent with the observed increase in
  $C^\prime _{pb}$ (figure 9). A striking difference is that the
  $\overline {v^{\prime 2}}$ profiles during actuation show higher levels near
  $y=0$ and are double peaked in contrast to the single peak for the unactuated case.
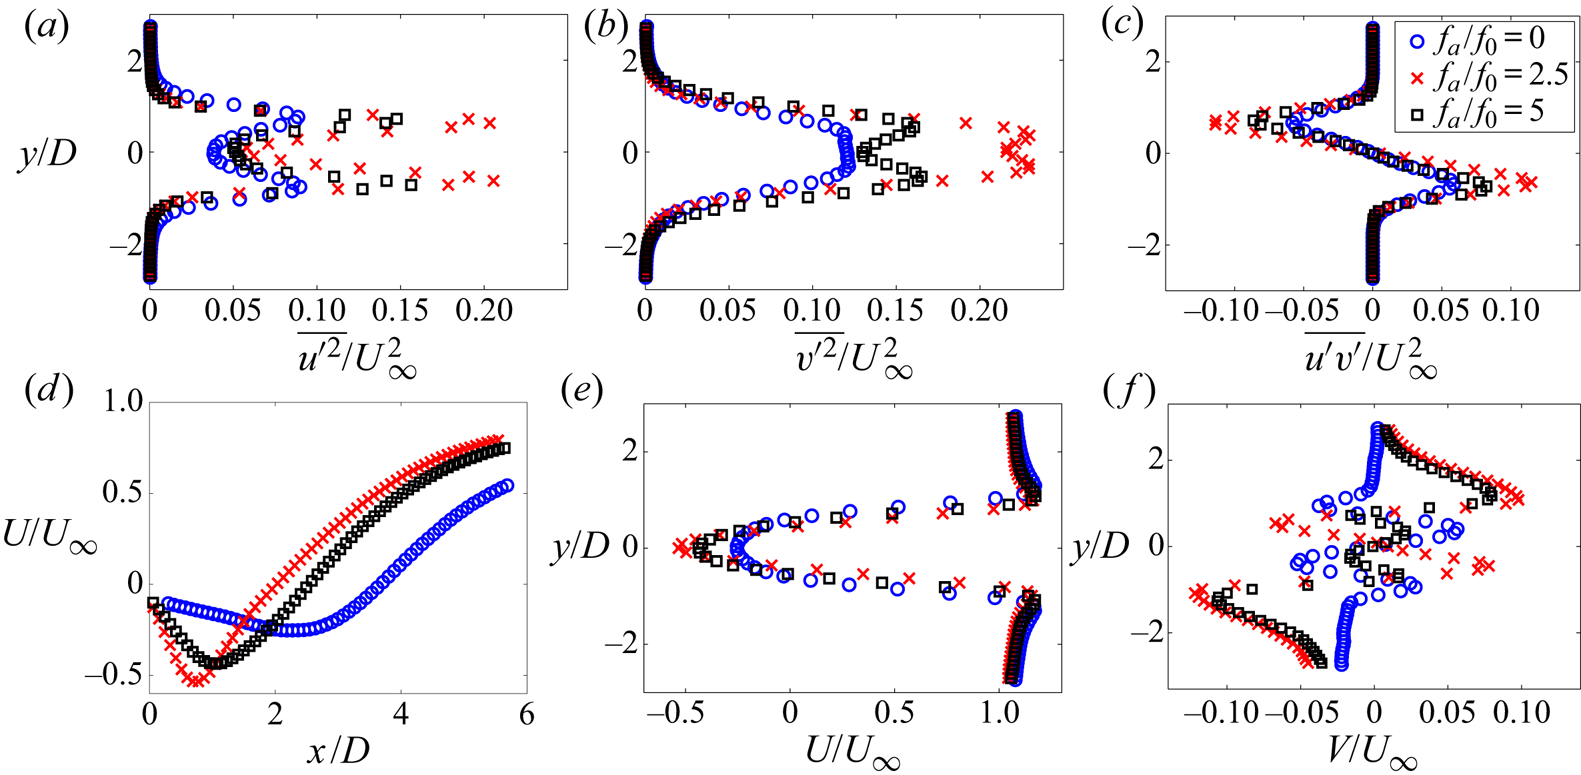
Figure 10. Transverse profiles of Reynolds stresses for the unactuated and the two most effective actuation cases in the plane  ${z}/{H}$=0.5: (a)
  ${\overline {u^{\prime 2}}}/{U_\infty ^2}$; (b)
  ${\overline {v^{\prime 2}}}/{U_\infty ^2}$; (c)
  ${\overline {u^\prime v^\prime }}/{U_\infty ^2}$. Profiles are at
  $x/D$ location coinciding with the maximum of the respective Reynolds stress. (d) Streamwise distribution of
  $U$ along the centreline
  $y=0$. (e) Transverse distribution of
  $U$ and (f)
  $V$ at
  $x/D$ where
  $U$ is minimum on centreline.
Figure 10(d) shows  $U$ evolution along the centreline. The location of minimum
  $U$ approximately coincides with the
  $x$-location of the recirculation foci and moves upstream for the actuated cases indicating shorter mean recirculation lengths. Figures 10(e) and 10(f) show transverse
  $U$ and
  $V$ profiles at the
  $x$-locations of the recirculation foci. The
  $U$ velocity deficit increases with actuation and the highest decrease in
  $U$ is observed for
  ${f_a}/{f_0}=2.5$, which is consistent with the lowest
  $\bar{C}_{pb}$ occurring for this case. The
  $V$-levels are significantly higher for the actuated cases, indicating a higher entrainment rate. In particular,
  ${\partial V}/{\partial y}$ is much larger in the recirculation for the actuated cases. Thus, an increased
  $\overline {v^{\prime 2}}$ production rate, mainly due to the contribution
  $-2\overline {v^{\prime 2}}({\partial V}/{\partial y})$, accounts for increased levels and the double-peak nature of the
  $\overline {v^{\prime 2}}$ distribution when compared with the unactuated case.
Figure 11 illustrates the influence of  $f_a$ on the mean wake topology and the turbulent kinetic energy
  ${k}/{U_\infty ^2}$. Figures 11(a)–11(c) show the mean flow sectional streamlines overlaid with isocontours of
  ${k}/{U_\infty ^2}$ in the plane
  ${z}/{H}=0.5$ for the unactuated and the two most effective actuation cases (
 $\,{f_a}/{f_0}= 2.5$ and 5). In all cases, the flow field is symmetric about
  $y=0$. The mean recirculation length,
  $L_r$, is defined as the maximum extent of the recirculation along
  $y = 0$ and coincides with the streamline saddle point, marked
  $S$. Compared with the unactuated case, actuation results in much shorter
  $L_r$ and the location of the recirculation nodes shifts upstream relative to the saddle point. These observations are consistent with the observed increase in the shear layer curvature, which is in turn consistent with lower
  $\bar {C}_{pb}$ for the actuated cases. The highest fluctuation values, quantified by
  $k$, are concentrated immediately downstream of the recirculation nodes and increase with actuation effectiveness. Considered together with figure 10, the increase in
  $k$ is related to larger contributions of
  $-\overline {u^\prime v^\prime }({\partial U}/{\partial y}+{\partial V}/{\partial x})-\overline {v^{\prime 2}}({\partial V}/{\partial y})$ to the
  $k$-production term and are thus related to the streamline curvature through the mean field gradients.
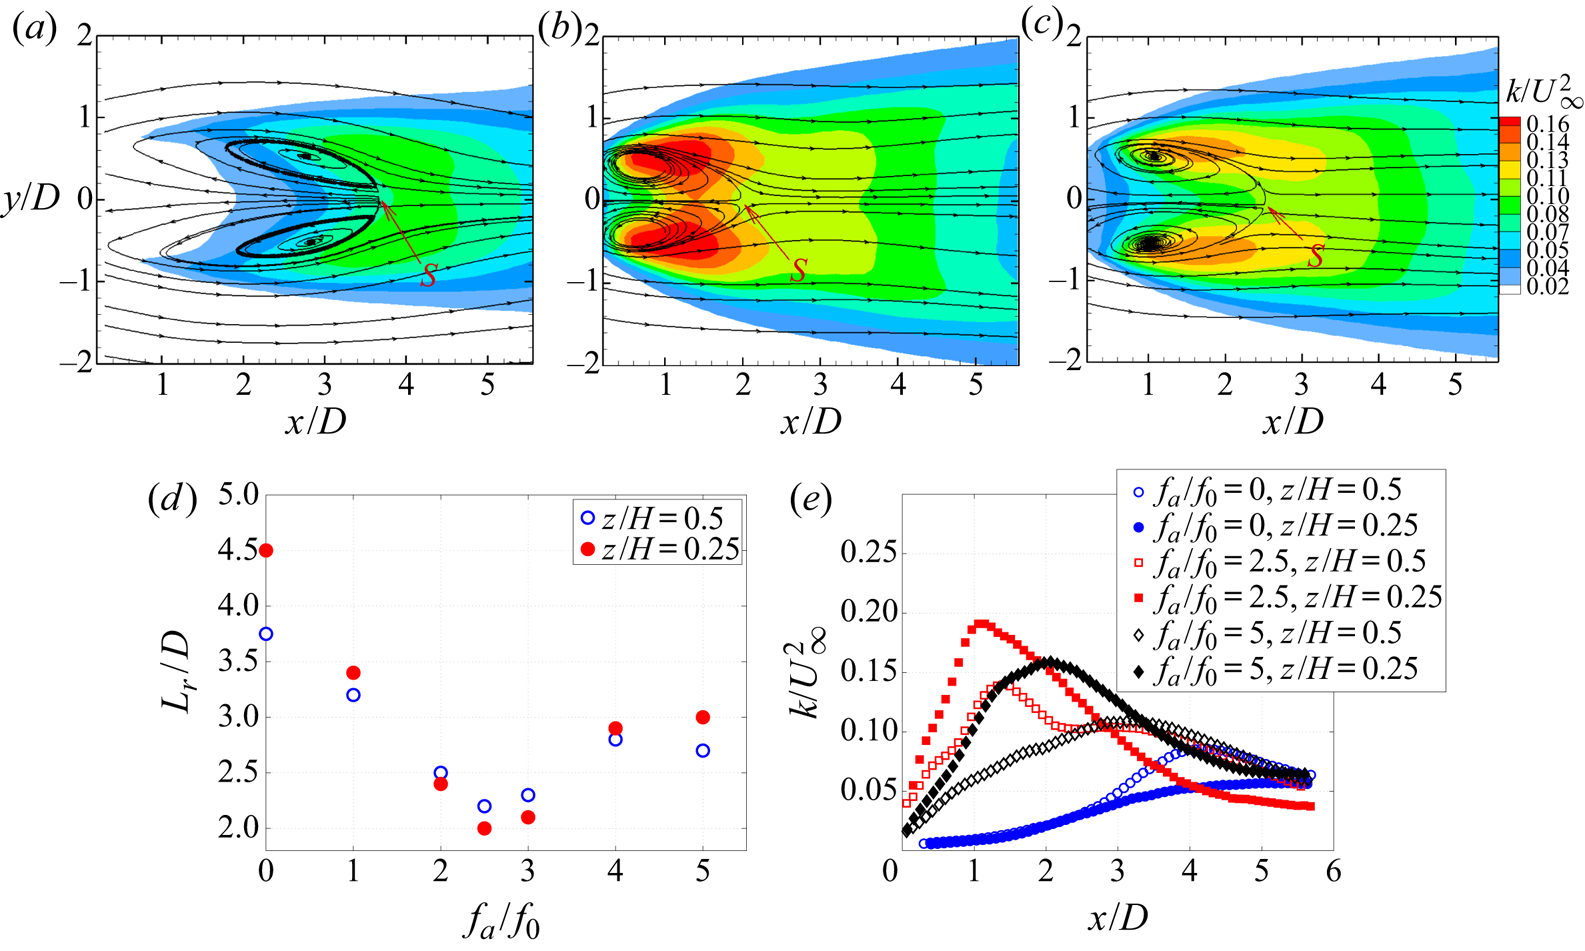
Figure 11. (a) Mean sectional streamlines and overlaid isocontours of  ${k}/{U_\infty ^2}$ in the plane
  ${z}/{H}=0.5$ for: unactuated flow,
  ${L_r}/{D}=3.7$; (b) actuated flow,
  ${f_a}/{f_0}=2.5$ (
 $\,{f_{sh}}/{f_a}={1}/{2}$),
  ${L_r}/{D}=2.1$; (c)
  $\,{f_a}/{f_0}=5$ (
 $\,{f_{sh}}/{f_a}={1}/{4}$),
  ${L_r}/{D}=2.5$.
  $L_r$ is the mean recirculation length, coinciding with the location of the saddle point marked
  $S$. (d) Influence of actuation frequency on
  ${L_r}/{D}$, measured in the planes
  ${z}/{H}=0.25$ and 0.5. (e) Streamwise distribution of the turbulent kinetic energy,
  ${k}/{U_\infty ^2}$, along the centreline
  $y=0$.
Figure 11(d) shows  $L_r$ as a function of
  $f_a$ for the planes
  ${z}/{H}$= 0.25 and 0.5. The change in
  $L_r$ between the two planes for actuated cases is smaller than the unactuated case. This observation is consistent with that of Feng, Cui & Liu (Reference Feng, Cui and Liu2019), who reported that synthetic jet actuation along slits tends to increase the two dimensionality of 3-D bluff body wakes. Figure 11(e) shows
  ${k}/{U_\infty ^2}$ along
  $y=0$ for the three cases in the planes
  ${z}/{H}= 0.25$ and 0.5. The mean flow patterns in the plane
  ${z}/{H}= 0.25$ are qualitatively similar to those along
  ${z}/{H}= 0.5$ and are not shown for brevity. Generally,
  $k$ along
  $y=0$ increases with actuation. A significant topological difference due to actuation is that for the actuated flows, the maxima for
  $k$ along
  $y=0$ occur upstream of the saddle point and, thus, within the mean recirculation region, while for the unactuated case, maximum values of
  $k$ occur downstream. Moreover, the maximum levels of
  $k$ are greater along
  ${z}/{H}= 0.25$ than for
  ${z}/{H}= 0.5$ for the actuated cases, while the converse is true for the unactuated flow. The observations drawn from figure 11 suggested that the actuation modifies the vortex formation process as is elaborated in §§ 3.4 and 3.5 discussing the synchronization triggering mechanism.
Figure 12 presents spectra of the wake pressure and transverse velocity fluctuations  $v^\prime$ for different
  $f_a$. Figure 12(a) shows the PSDF of the surface pressure at tap 8 in the wake (
 $x/D=$ 1.75,
  $y/D=-$0.43). Generally, the broader spectral peaks correspond to the shedding frequency,
  $f_{sh}$, and the very sharp peaks to the actuation frequency and its harmonics. The fluctuation energy associated with the actuation is concentrated in a single frequency bin and contributes negligibly to
  $C_{pb}^\prime$. The interpretation of the spectral peaks is confirmed by viewing the PSDF of
  $v^\prime$, shown at the location of maximum
  ${\overline {v^{\prime 2}}}/{U_\infty ^2}$ in figure 12(b), where only the spectral peaks at
  $f_{sh}$ and its second harmonic,
  $2f_{sh}$, are generally observed. The response of the shedding frequency to increasing
  $f_a$ is not monotonic. Experiments were conducted with increasing and decreasing
  $f_a$ and evidence of hysteresis was not observed. The shedding frequency initially increases with
  $f_a$ up to
  ${f_a}/{f_0}\simeq 3$, at which condition the spectra of
  $v^\prime$ exceptionally show multiple peaks. As
  $f_a$ is further increased,
  $f_{sh}$ gradually decreases to
  ${f_a}/{f_0}\simeq 4$, but remains larger than
  $f_0$ and increases again up to
  ${f_a}/{f_0}\simeq 5$. This behaviour is addressed in detail in § 3.3. The PSDF of
  $v^\prime$ and the surface pressure at
  ${f_a}/{f_0}=2.5$ (
 $\,{f_{sh}}/{f_a}={1}/{2}$) and
  ${f_a}/{f_0}=5$ (
 $\,{f_{sh}}/{f_a}={1}/{4}$) are small band about
  $f_{sh}$. Both cases correspond to local extrema in
  $\bar {C}_{pb}$,
  $C^\prime _{pb}$ and
  $k$. Together, these observations suggest a synchronization of the vortex shedding process with the actuation frequency and is examined in greater detail next.
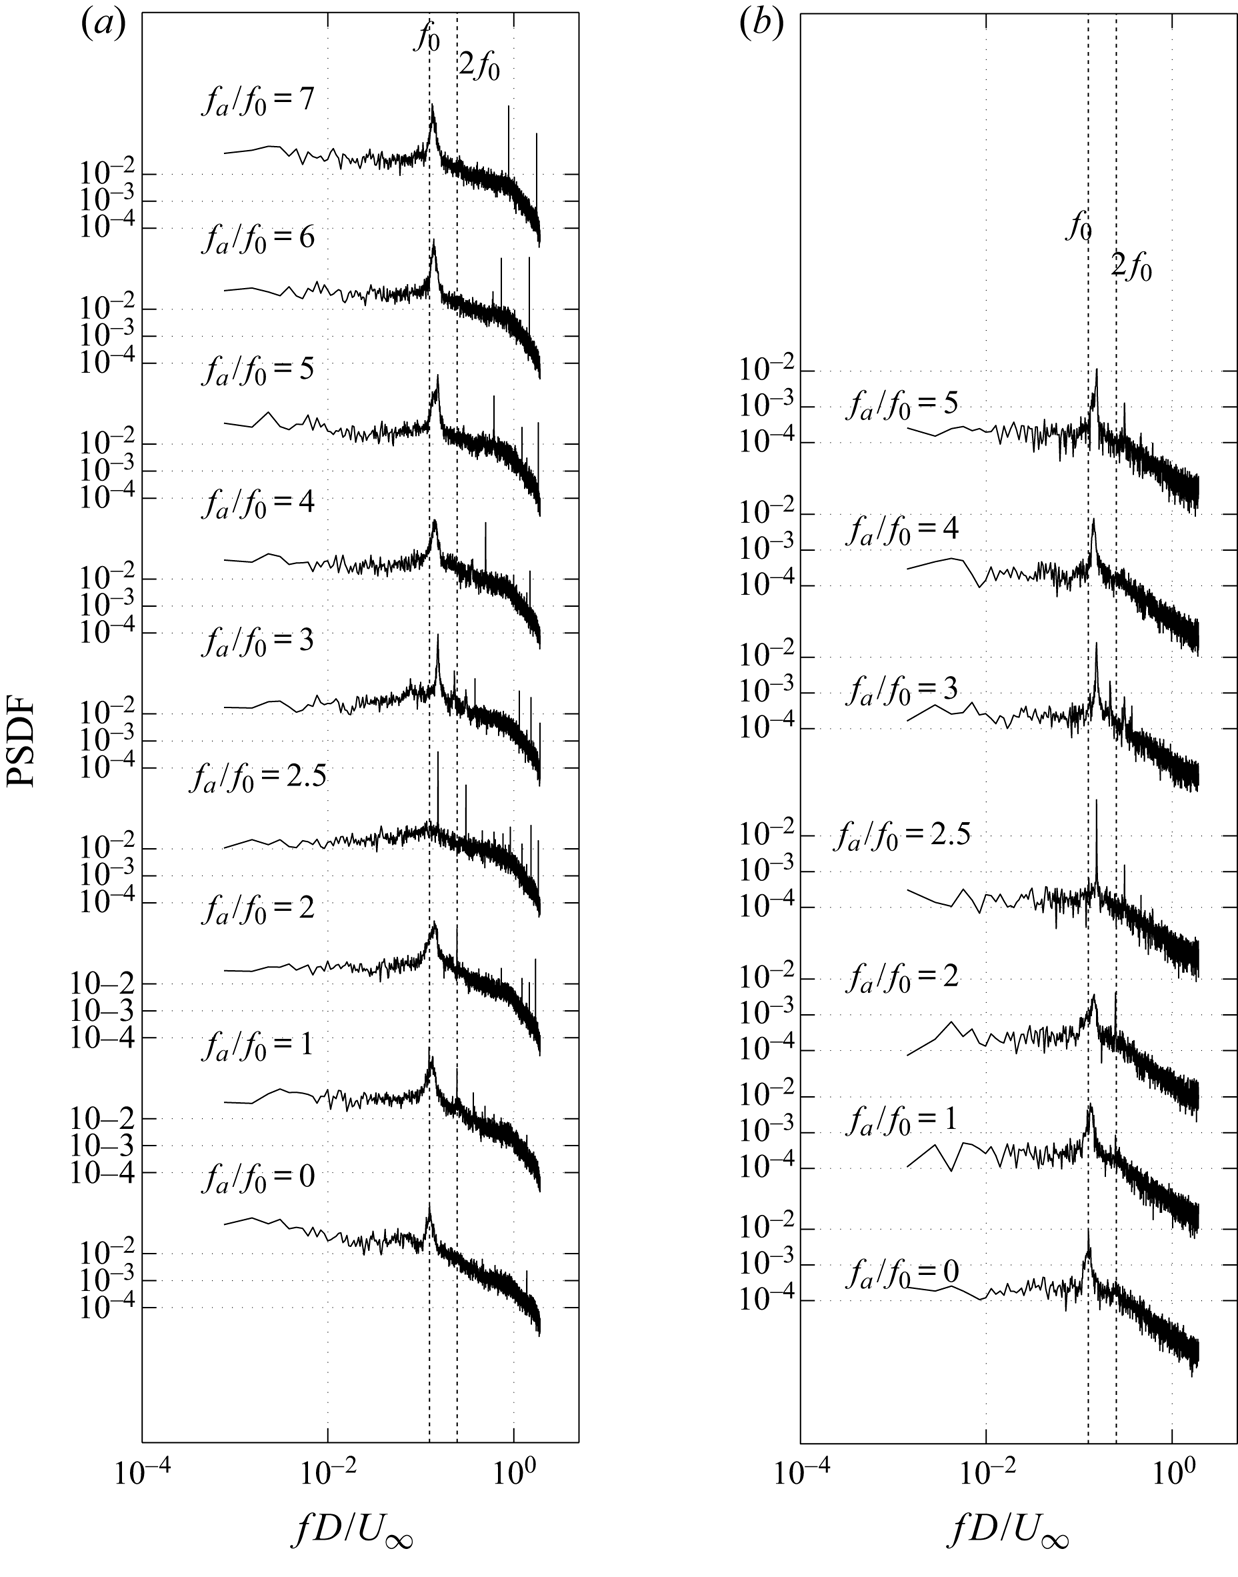
Figure 12. (a) Power spectrum density function of the fluctuating surface pressure on the plate at the location of tap 8 ( $x/D= 1.75$,
  $y/D=-0.43$); and (b) PSDF of
  $v^ \prime$ at the location of maximum
  ${\overline {{v^\prime }^2}}/{U_\infty ^2}$ for different actuation frequencies (
 $A=2.4\ \textrm {V}$) at
  $Re=12\,000$.
3.3. Evidence of vortex shedding lock-on and synchronization
Vortex shedding synchronization with  $f_a$ is investigated at
  $A= 2.4\ \textrm {V}$ and
  $Re= 12\,000$. Furthermore, the influence of actuation symmetry on synchronization is characterized using one-sided or two-sided (symmetric, in-phase) actuation.
3.3.1. Vortex shedding synchronization for symmetric two-sided actuation
Figure 13(a) illustrates the variation of vortex shedding frequency as a function of the actuation frequency for symmetric (two-sided) actuation. For  $2.18\leqslant {f_a}/{f_0}\leqslant 2.62$, the shedding frequency locks-on to half the actuation frequency,
  ${f_{sh}}/{f_a}= {1}/{2}$. This lock-on interval exhibits a decrease in the mean base pressure and an increase in its fluctuation levels (figure 9), as is also observed for other geometries (Konstantinidis & Liang Reference Konstantinidis and Liang2011; Barros et al. Reference Barros, Borée, Noack and Spohn2016a; Wang et al. Reference Wang, Tang, Simon and Duan2017). A lock-on interval with
  ${f_{sh}}/{f_a}= {1}/{4}$ occurs for
  $4.68\leqslant {f_a}/{f_0}\leqslant 5$. Again, a decrease in
  $\bar {C}_{pb}$ and an increase in
  $C^\prime _{pb}$ is observed in this interval. A primary lock-on,
  $f_{sh}=f_a$, occurs over a very short interval,
  $1.06 \leqslant {f_a}/{f_0}\leqslant 1.12$.
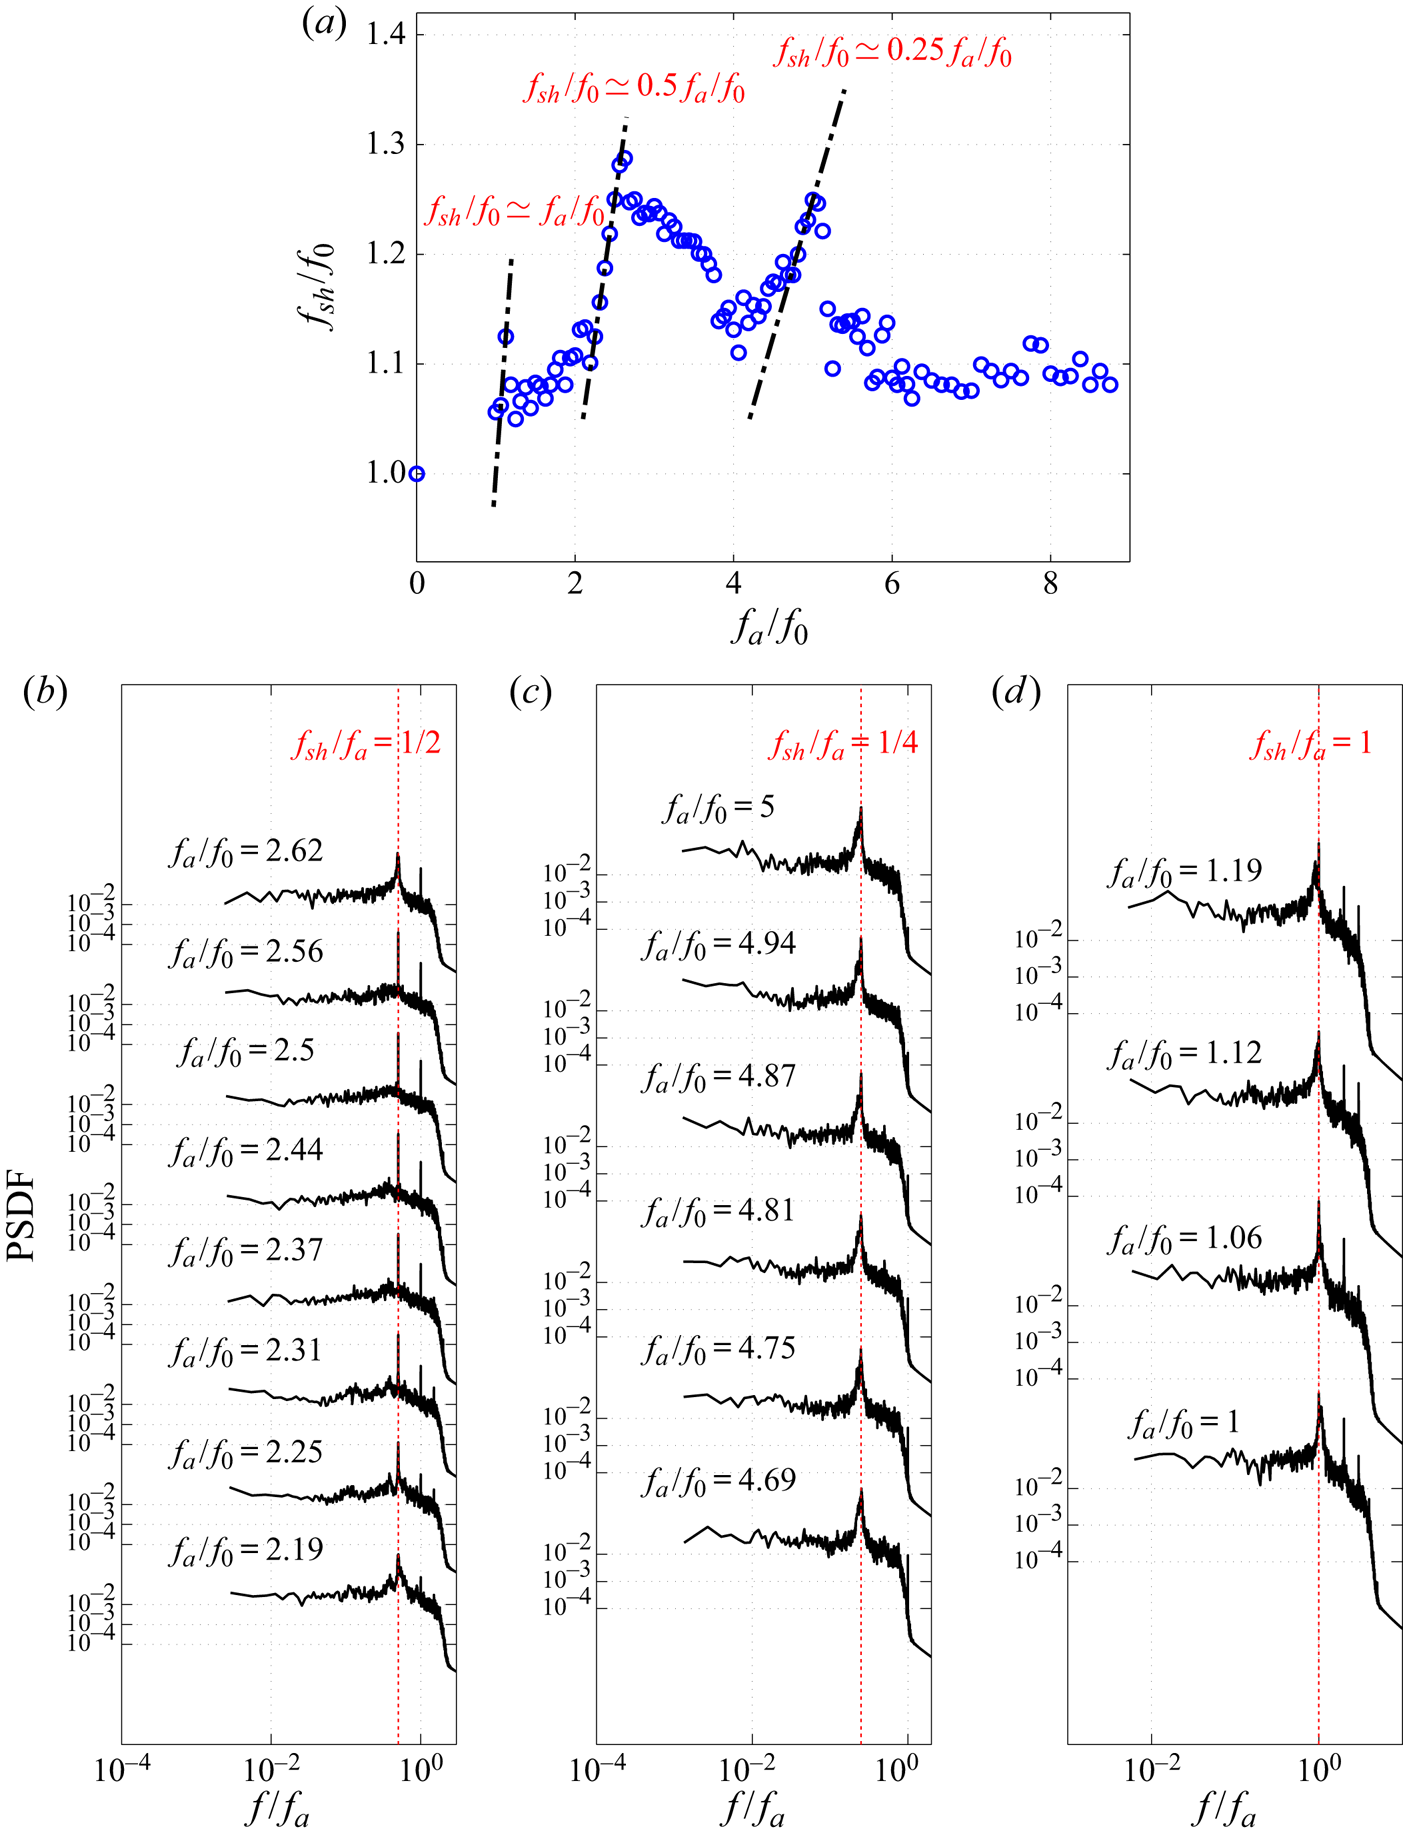
Figure 13. (a) Effect of actuation frequency  $f_a$ on shedding frequency
  $f_{sh}$ in symmetric actuation (two sided) at
  $Re=12\,000$; pressure spectra on the plate from tap 8 (
 $x/D=1.75$,
  $y/D=-0.43$) in the subharmonic lock-on regimes, (b)
  ${f_{sh}}/{f_a}={1}/{2}$,
  $2.19 \leqslant {f_a}/{f_0}\leqslant 2.62$, (c)
  ${f_{sh}}/{f_a}={1}/{4}$,
  $4.69 \leqslant {f_a}/{f_0}\leqslant 5$ and (d)
  ${f_{sh}}/{f_a}=1$,
  $1.06 \leqslant {f_a}/{f_0}\leqslant 1.12$, respectively.
Figure 13(b) shows a PSDF of surface pressure on the plate (tap 8:  $x/D= 1.75$,
  $y/D=-0.43$) for the lock-on range (
 $2.18\leqslant {f_a}/{f_0}\leqslant 2.62$). The dominant spectral peaks correspond to the shedding frequency and appear exactly at
  $f_{sh}=f_a/2$. The very sharp peaks at
  ${f}/{f_a}=1$ (the energy is contained in a single bin) correspond to the acoustic signature at
  $f_a$. The spectral energy associated with
  $f_{sh}$ is concentrated in a much narrower band (sharp peak) than observed for the unactuated flow. In the
  $f_a \simeq 2f_{sh}$ lock-on range the narrowest spectral band occurs at
  ${f_a}/{f_0}=2.5$, which coincides with the minimum
  $\bar {C}_{pb}$ and maximum
  $C^\prime _{pb}$ in figure 9. A similar behaviour in pressure spectra is observed when vortex shedding locks-on to
  $f_a/4$, figure 13(c), albeit with some spectral broadening. A secondary minimum in
  $\bar {C}_{pb}$ and maximum in
  $C^\prime _{pb}$ are observed in the
  $f_a \simeq 4f_{sh}$ lock-on interval in figure 9 at
  ${f_a}/{f_0}=5$.
Figure 13(d) shows pressure spectra for tap 8 for the primary lock-on interval ( $1.06\leqslant {f_a}/{f_0}\leqslant 1.12$). During synchronization, the peak due to actuation (energy contained in a single bin) aligns exactly with the centre of the narrow band peak due to vortex shedding. At
  ${f_a}/{f_0}=1$, and
  ${f_a}/{f_0}=1.19$, desynchronization is observed as these peaks start to deviate and the peaks corresponding to vortex shedding become broader.
Evidence of synchronization can be inferred from the correlation functions of either fluctuating pressure or velocity fields. Figures 14(a) and 14(c) show the cross-correlation functions,  $R_{pp}$, of the surface pressure signals of taps 8 and 10 (
 $x/D= 1.75$,
  $y/D={\pm }0.43$) for the
  ${f_a}/{f_0}= 2.5$ and 5. For both cases,
  $R_{pp}$ show stronger periodicity and higher correlation than the unactuated flow, as depicted in figure 6(b). The signals for both actuated cases are out-of-phase by a half-cycle (
 $180^\circ$) and their period is
  $1/f_{sh}$. These cross-correlation functions are consistent with the auto-correlation functions of the transverse velocity fluctuation at maximum
  ${\overline {v^{\prime 2}}}/{U_\infty ^2}$ in figures 14(b) and 14(d). During the synchronization intervals, the decay of the correlation functions for both pressure and velocity fields is significantly slower than observed for unsynchronized or unactuated cases.
Figure 14. (a,c) Cross-correlation function of pressure data between symmetrically located pressure tap 8 ( $x/D= 1.75$,
  $y/D=-0.43$) and tap 10 (
 $x/D= 1.75$,
  $y/D= 0.43$) in the wake for actuated cases of
  ${f_a}/{f_0}= 2.5$ and 5. (b,d) Auto-correlation function of
  $v^ \prime$ where
  ${\overline {v^{\prime 2}}}/{U_\infty ^2}$ is maximum for actuated cases of
  ${f_a}/{f_0}= 2.5$ and 5. Parameters: (a)
  ${f_a}/{f_{0}}=5$ (
 $\,{f_a}/{f_{sh}}=4$). (b)
  ${f_a}/{f_{0}}=5$ (
 $\,{f_a}/{f_{sh}}=4$). (c)
  ${f_a}/{f_{0}}=2.5$ (
 $\,{f_a}/{f_{sh}}=2$). (d)
  ${f_a}/{f_{0}}=2.5$ (
 $\,{f_a}/{f_{sh}}=2$).
Spectra and cross-correlation functions of the fluctuating pressure are compared in figure 15 for unactuated, unsynchronized and synchronized cases. When actuation and vortex shedding are synchronized, the spectral energy content of the spectral peaks at  $f_{sh}$ increases significantly. The fluctuations are strongly correlated over a larger spatial region and the decay is much slower when compared with the unactuated or unsynchronized actuation cases. When considering the momentum coefficient
  $C_\mu$, as shown in figure 8(d), it is observed that the threshold of actuation for the subharmonic ranges is very low, which is consistent with the observations for other actuation configurations (Tang et al. Reference Tang, Cheng, Tong, Lu and Zhao2017; Kim & Choi Reference Kim and Choi2019).
Figure 15. (a) Power spectrum density function of the fluctuating surface pressure on the plate at tap 8 ( $x/D= 1.75$,
  $y/D=-0.43$) for different actuation frequencies for symmetric actuation at
  $Re=12\,000$. (b) Cross-correlation function of pressure between symmetrically located taps 8 (
 $x/D= 1.75$,
  $y/D=-0.43$) and 10 (
 $x/D= 1.75$,
  $y/D= 0.43$) in the wake for unactuated and different actuated cases, including synchronized and unsychronized.
A more perplexing observation is for actuations in the vicinity of  $f_a \simeq 3f_{sh}$ (
 $\,f_a=3.6f_0$). The fluctuations are strongly correlated and the spectral peak around
  $f_{sh}$ is narrow band (figure 15). From figure 13(a), however, there is no evidence of a lock-on interval around
  ${f_{sh}}/{f_a}={1}/{3}$, even though
  $C_\mu$ is larger than for the primary and
  $f_a \simeq 4f_{sh}$ lock-on ranges. Synchronization at
  $f_a \simeq 3f_{sh}$ is generally not reported in earlier studies for different configurations. Considering the synchronization mechanism in § 3.4 suggests that tertiary synchronization is more difficult to achieve.
3.3.2. Vortex shedding synchronization for one-sided actuation
The influence of one-sided actuation on the wake response for  $A= 2.4\ \textrm {V}$ and
  $Re= 12\,000$ is summarized in figure 16. When compared with two-sided actuation, figure 16(a) shows that the synchronization intervals start at lower
  ${f_a}/{f_0}$. The primary lock-on interval is more clearly defined and occurs over a slightly longer interval,
 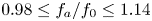 $0.98\leq {f_a}/{f_0}\leq 1.14$. The
  $f_a \simeq 2f_{sh}$ lock-on interval is again the most pronounced. This interval is slightly shorter than for two-sided actuation and occurs at lower frequencies,
 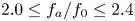 $2.0\leq {f_a}/{f_0}\leq 2.4$. In contrast, the
  $f_a \simeq 4f_{sh}$ lock-on interval is significantly shorter,
 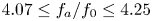 $4.07\leq {f_a}/{f_0}\leq 4.25$.
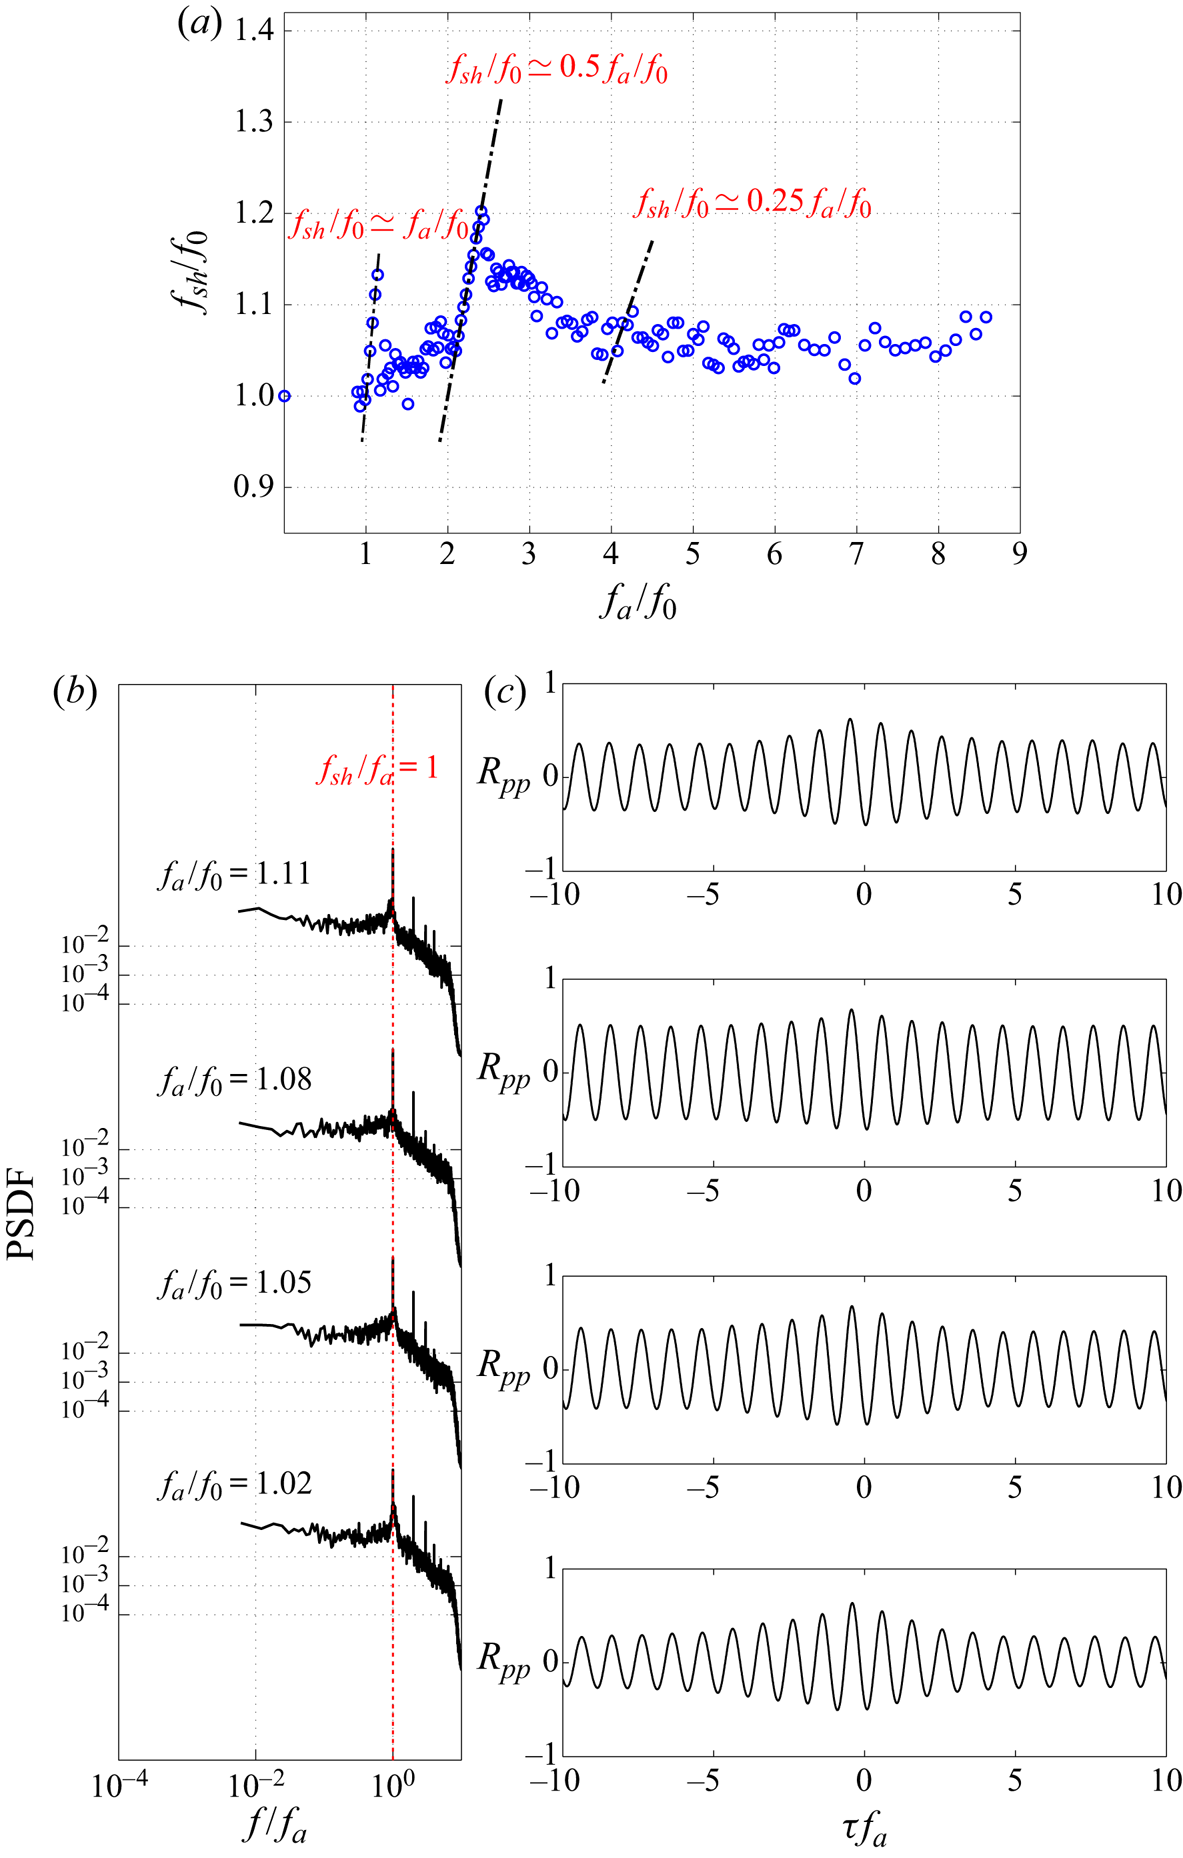
Figure 16. (a) Influence of actuation frequency  $f_a$ on shedding frequency
  $f_{sh}$ for one-sided actuation. (b) Pressure spectra on the plate at tap 8 (
 $x/D=1.75$,
  $y/D=-0.43$) for different
  ${f_a}/{f_{0}}$ in the primary lock-on range. (c) The corresponding cross-correlation functions of pressure fluctuations of tap 8 (
 $x/D= 1.75$,
  $y/D=-0.43$) and tap 10 (
 $x/D= 1.75$,
  $y/D=0.43$) in the wake.
The vortex shedding synchronization is stronger in the primary ( $\,{f_{sh}}/{f_a}=1$) lock-on interval for the one-sided than for two-sided actuation. Figure 16(b) shows the PSDF for the pressure fluctuations at tap 8 (
 $x/D= 1.75$,
  $y/D=-0.43$) for different
  ${f_a}/{f_0}$ with one-sided actuation. A very sharp peak (narrow bandwidth) is observed consistent with synchronization of vortex shedding with
  $f_a$. This interpretation is supported by the cross-correlation function of the surface pressure at taps 8 and 10 in the wake in figure 16(c). The pressure signals are out-of-phase and
  $R_{pp}$ is highly correlated over the entire measurement window (600 shedding cycles), in contrast to the two-sided actuation where the decay in
  $R_{pp}$ is more easily observed (figure 15b). The spectra and cross-correlation functions for
  ${f_{sh}}/{f_a}={1}/{2}$ and
  ${f_{sh}}/{f_a}={1}/{4}$ lock-on intervals are similar to those for the two-sided actuation and not shown for brevity.
For one-sided actuation,  $C_\mu$ is approximately twice that of the two-sided actuation, since the same excitation is applied to the cavity but the flow now exits through a single slit. While the increase in
  $C_\mu$ may explain the increased primary lock-on interval (Rigas et al. Reference Rigas, Morgans and Morrison2017), the opposite effect occurs for the
  $f_a \simeq 4f_{sh}$ lock-on interval and, thus, cannot be attributed simply to a change in
  $C_\mu$.
Primary lock-on has been reported for pulsed jet actuation in the wake of a 3-D bluff body by Barros et al. (Reference Barros, Borée, Noack and Spohn2016a) and for a cylinder wake by Wang et al. (Reference Wang, Tang, Simon and Duan2017). In both studies, primary lock-on required two-sided actuation with jets on the opposing sides pulsed  $180^\circ$ out-of-phase. In contrast, for this study one-sided actuation is sufficient, suggesting that the interaction between the pulse vortices and forming Kármán vortices leading to synchronization is not fully elucidated. In the next section PIV results are used to investigate these interactions in greater detail.
3.4. Influence of the actuation pulses on vortex formation
The interaction between the vortices arising from the actuation pulse and the large-scale vortices forming in the obstacle base region is investigated next to characterize the shedding synchronization process. Spectra of the fluctuating streamwise velocity ( $u^\prime$) and the surface pressure on the leeward face in the vicinity of the actuation slit for
  ${f_a}/{f_0}=2.5$ (
 $\,{f_a}/{f_{sh}}=2$) and
  ${f_a}/{f_0}=5$ (
 $\,{f_a}/{f_{sh}}=4$) are shown in figure 17. These show that the actuation pulses and shedding frequency can be readily distinguished such that the pulses can unambiguously synchronize with the shedding phase.
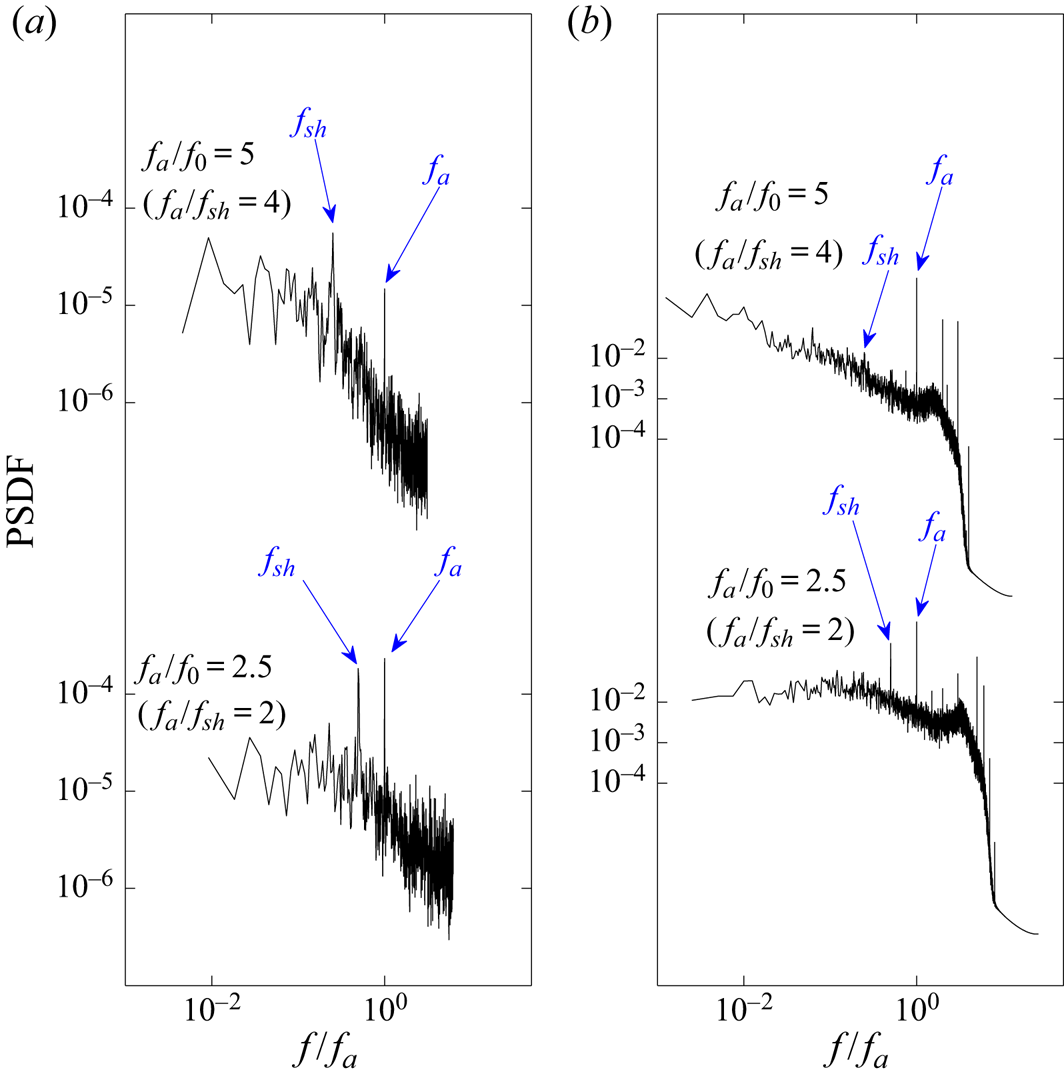
Figure 17. (a) Power spectrum density function of the fluctuating streamwise velocity ( $u^\prime$) next to the slit (
 $x/D=0.06$,
  $y/D=-0.5$,
  $z/H=0.5$); and (b) PSDF of the fluctuating pressure on the leeward face at tap 5 (
 $x/D=0$,
  $y/D=- 0.25$,
  $z/H=0.5$) for
  ${f_a}/{f_0} =2.5$ and 5 (
 $\,{f_a}/{f_{sh}} =2$ and 4, respectively).
The influence of the actuation pulse on the vortex formation and shedding process involves the complex interaction of several vortices. To assist in the interpretation of the instantaneous wake structure, the nomenclature is schematically summarized in figure 18. The shear layers along the  $y>0$ and
  $y<0$ sides of the obstacle are defined as upper and lower shear layers, respectively. Vortices
  $A_j$ and
  $B_j$ denote the
  $j$th wake (Kármán) vortices forming along the upper and lower shear layers, respectively. The subscript
  $i$ denotes the pulse. Actuation pulses in the upper actuation slit are defined as
  $P_{ui}^+$ and
  $P_{ui}^-$, where the superscript identifies the sign of the vorticity. Similarly,
  $P_{li}^+$ and
  $P_{li}^-$ represent the counter-rotating actuation pulses ejected from the lower slit.

Figure 18. Schematic identifying nomenclature used in figure 19. Here  $A_j$,
  $B_j$ identify wake vortices,
  $P$ identify the actuation pulse vortices, subscript
  $u$ and
  $l$ identify upper and lower and subscript
  $i$ identifies the pulse. For the case
  $f_a \simeq 2f_{sh}$, for shedding cycle
  $j=1$,
  $i=2j-1=1$ and
  $2j=2$.
During each pulse  $i$, counter-rotating vortex pairs from the upper (
 $P_{ui}^+$,
  $P_{ui}^-$) and lower (
 $P_{li}^+$,
  $P_{li}^-$) slits are injected into the wake and interact with the neighbouring shear layers and forming Kármán vortices. The co-rotating vortices (e.g
  $P_{ui}^-$ and
  $A_j$) tend to merge as described by Meunier, Le Dizès & Leweke (Reference Meunier, Le Dizès and Leweke2005). However, the pulse vortices
  $P_{ui}^+$, which rotate opposite to the forming vortex
  $A_j$ and have opposite-sign vorticity to the neighbouring shear layer, persist without merging and move downstream to interact with the shear layer and the growing Kármán vortices. The interaction with the shear layer can interrupt the transport of vorticity feeding the growing Kármán vortex or lead to splitting of the larger Kármán vortices. Details of these interactions are described next.
Figure 19 depicts a representative shedding cycle for the synchronized case  ${f_a}/{f_0}=2.5$ (
 $\,{f_a}/{f_{sh}}=2$) for six phases. The scale for
  $\omega _z$ is constrained (
 $-1 \leqslant \omega _z \leqslant 1$) to clearly show the pulse vortices and their interaction with the Kármán vortices. From the instantaneous vorticity fields, only the pulse vortices of opposite sign to the neighbouring shear layer can be distinguished.
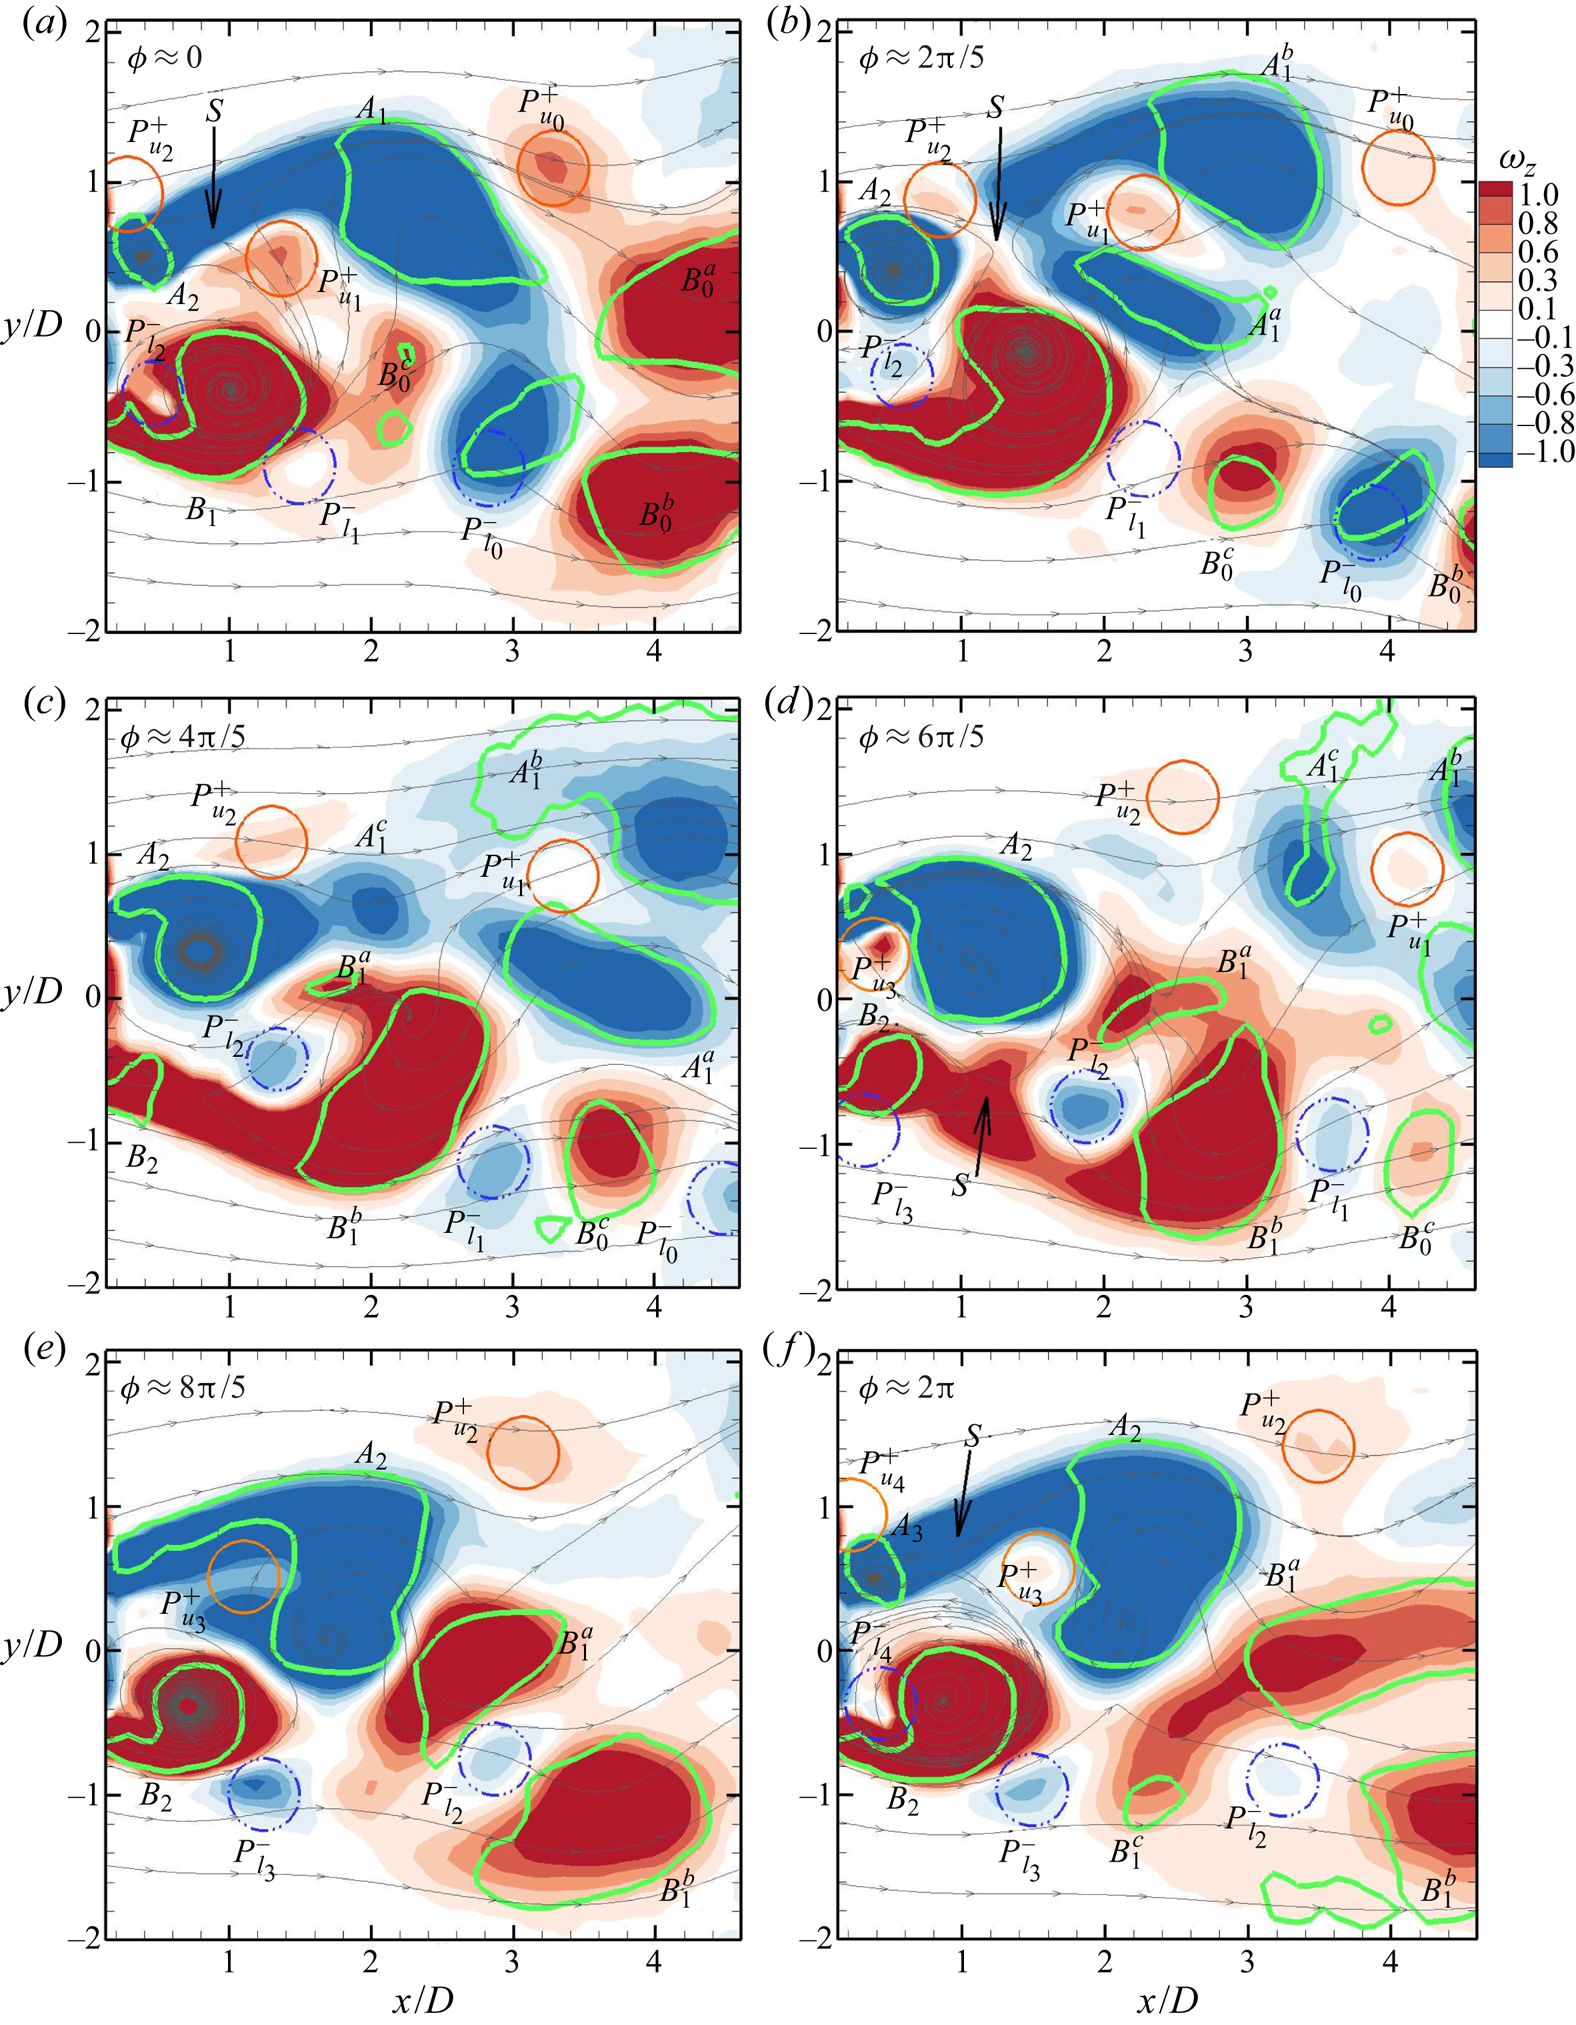
Figure 19. Phase-resolved vorticity distribution based on the 24-mode low-order representation for synchronized shedding at  ${f_a}/{f_0}=2.5$ (
 $\,{f_a}/{f_{sh}}=2$) for an illustrative Kármán shedding cycle in the plane
  ${z}/{H}=0.5$. Symbols identifying vortices are defined in figure 18. Green curves (
 $Q=0$) enclose the vortex cores.
Figure 19(a) illustrates the vorticity distribution at the shedding phase  $\phi \simeq 0$ shortly after the injection of the vortex pairs
  $P_{l2}$ and
  $P_{u2}$ from the actuation pulse. Pulse vortices that co-rotate with neighbouring Kármán vortex (i.e. have the same sign vorticity as the separated shear layer) merge with the shear layer (Meunier et al. Reference Meunier, Le Dizès and Leweke2005). However, the counter-rotating vortices,
  $P_{u2}^+$ along the upper and
  $P_{l2}^-$ along the lower shear layer remain discernible. These vortices interact with the forming Kármán vortices. In this figure,
  $P_{u0}^+$,
  $P_{l0}^-$,
  $P_{u1}^+$ and
  $P_{l1}^-$ are vortices injected from the previous actuation cycles. Kármán vortex
  $A_1$ is nearly fully formed on the upper side, while the roll-up of the lower shear layer along the opposite side, leading to the formation of a new vortex
  $B_1$, is visible. The vortices
  $B_0^a$,
  $B_0^b$ and
  $B_0^c$ have been shed from the previous cycle.
In figure 19(b) at  $\phi \simeq {2{\rm \pi} }/{5}$, vortex
  $P_{u2}^+$ has effectively interrupted the transport of vorticity along the shear layer as a streamline saddle point
  $S$ is clearly seen. Hence,
  $P_{u2}^+$ is said to have triggered the shedding of vortex
  $A_1$. This pulse, hereafter, is referred to as the triggering pulse. The vortex
  $P_{u1}^+$, injected from the previous pulse, interacts to split the shed vortex into vortices
  $A_1^a$ and
  $A_1^b$ and later
  $A_1^c$ (figure 19(c) at
  $\phi \simeq {4{\rm \pi} }/{5}$). Note that the vortex
  $P_{l2}^-$ is entrained into the forming vortex
  $B_1$, foreshadowing that this vortex will play a similar role in splitting the vortex
  $B_1$ into
  $B_1^a$ and
  $B_1^b$. Hereafter, this pulse is referred to as an interim pulse and it plays no role in triggering the shedding of a vortex. However, the interim pulse affects the process of vortex formation. In figure 19(d) at (
 $\phi \simeq {6{\rm \pi} }/{5}$), immediately after the next pulse giving rise to pulse vortices
  $P_{u3}^+$ and
  $P_{l3}^-$, vortex
  $P_{l2}^-$ is embedded in vortex
  $B_1$ causing a redistribution of its vorticity and thus perturbing the formation process. Also observed in this figure is the roll-up of the upper shear layer leading to the initiation of a new vortex
  $A_2$.
The observed interaction between the interim pulse and the shed Kármán vortices appears similar to the process resulting in the splitting of 2-D counter-rotating vortices of unequal strength described by Christiansen & Zabusky (Reference Christiansen and Zabusky1973) and illustrated experimentally by Freymuth, Bank & Palmer (Reference Freymuth, Bank and Palmer1984). Unlike equal strength pairs, unequal strength vortices in sufficient proximity tend to follow a spiraling trajectory towards a common centre of rotation. The shear straining due to one vortex will result in strong distortion of the other. As a result, the voticity is redistributed, eventually leading to the splitting of the larger vortex (Couder & Basdevant Reference Couder and Basdevant1986). The resulting co-rotating vortices follow separate trajectories due to their mutually induced velocities.
The shedding event for vortex  $B_1$ is shown in figure 19(e) (
 $\phi \simeq {8{\rm \pi} }/{5}$) and is analogues to events shown for the first half of the shedding cycle (figure 19b). Again,
  $P_{l2}^-$ acts to split the vortex. Figure 19(f) (
 $\phi \simeq 2{\rm \pi}$) shows the wake at the third actuation, which corresponds to the initiation of the next shedding cycle. The pattern observed in figure 19(a) is thus approximately repeated as expected.
The same interactions between actuation pulses and forming Kármán vortices are observed in other planes. The vorticity distributions at the shedding phases  $\phi ={4{\rm \pi} }/{5}$ and
  ${6{\rm \pi} }/{5}$ are given for the plane
  ${z}/{H}=0.25$ in figure 20. The similarities and corresponding phases
  $\phi$ strongly suggest that the identified mechanisms for triggering and vortex splitting are representative of the wake response to the actuation.
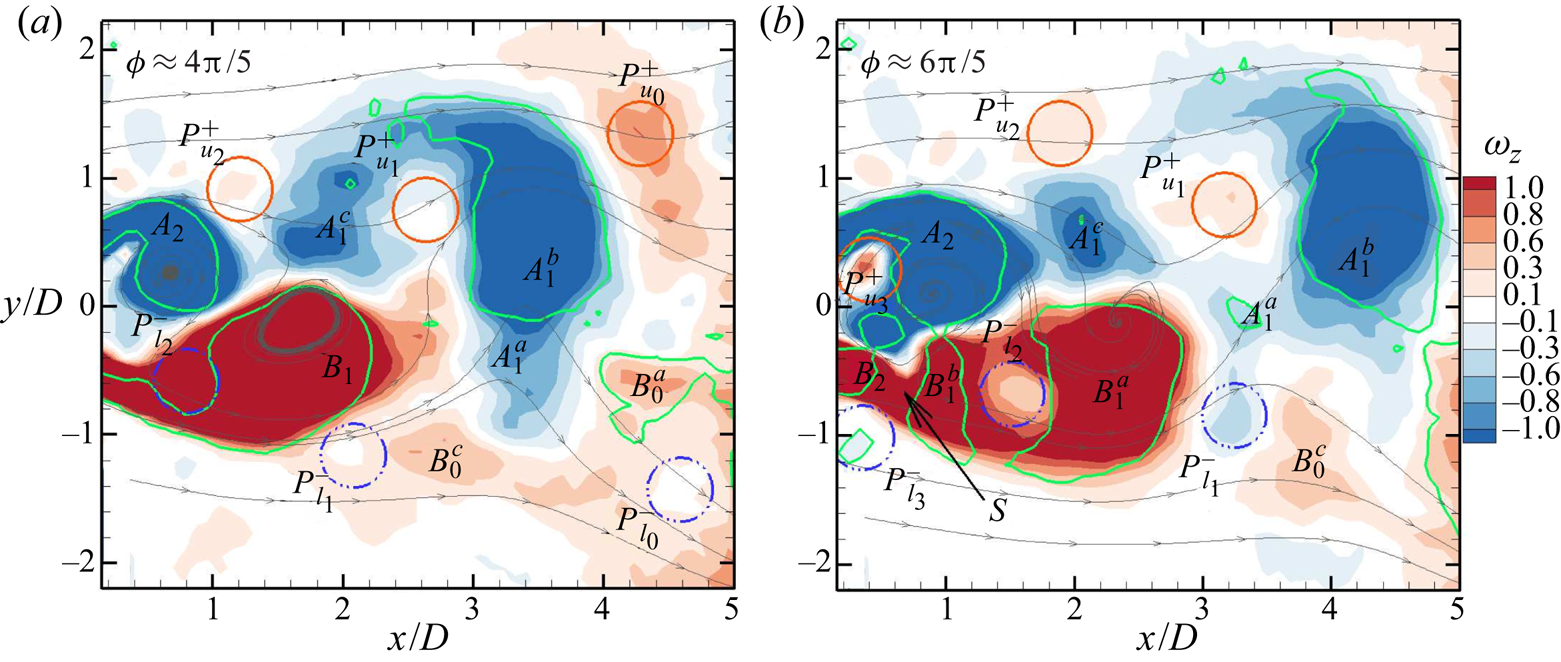
Figure 20. Phase-resolved vorticity distribution based on the 24-mode low-order representation for synchronized shedding at  ${f_a}/{f_0}=2.5$ (
 $\,{f_a}/{f_{sh}}=2$) for an illustrative Kármán shedding cycle in the plane
  ${z}/{H}=0.25$. Symbols identifying vortices are defined in figure 18. Green curves (
 $Q=0$) enclose the vortex cores.
Briefly summarizing the process, the influence of the injected vortices depends on the state of the locally forming Kármán vortex following the sequence: (i) on the upper side of the obstacle, the forming Kármán vortex reaches its maximum strength (circulation); (ii) the injection of the pulse vortex (e.g.  $P_{u2}^+$) perturbs the neighbouring shear layer thereby triggering the shedding; (iii) on the opposing (lower) side, the injected vortex pulse (
 $P_{l2}^-$) is entrained along the low-speed side of the shear layer towards the forming Kármán vortex; (iv) the pulse interacts with the Kármán vortex further downstream causing the larger vortex to split as it sheds; (v) the shedding of the lower vortex occurs as the process is mirrored in the second half of the shedding cycle.
The splitting of shed Kármán vortices occurring in the wake is due to interactions with the interim pulses. Figure 21 depicts the phase-averaged vorticity fields,  $\tilde {\omega }_z$, obtained directly from the raw velocity fields following the methodology of Lyn et al. (Reference Lyn, Einav, Rodi and Park1995) and Cantwell & Coles (Reference Cantwell and Coles1983) for the synchronized case
  ${f_a}/{f_0}=2.5$ (
 $\,{f_a}/{f_{sh}}=2$) at different phases of the shedding cycle. This sequence illustrates that the macroscopic vortex shedding patterns observed during a typical shedding cycle are consistent with the interaction shown in figure 19. Attention is focused on the evolution of vortex
  $A_1$ at the upper side of the obstacle (negative-signed vorticity). In figure 21(a) vortex
  $A_1$ is fed from the shear layer until the saddle point
  $S$ appears and
  $A_1$ is shed as shown in figure 21(b). Note that vortex
  $B_0$ has split due to the action of the interim pulses. Vortex
  $A_1$ travels downstream while the new vortex
  $B_1$ grows at the lower side of the obstacle, figure 21(c). In figure 21(d) vortex
  $A_1$ is in the initial stage of splitting due to the interaction with the interim actuation pulse with opposite-signed vorticity, consistent with the detailed views in figures 19(b) and 19(c). Then, vortex
  $A_1$ splits into vortices
  $A_1^a$ and
  $A_1^b$, which have diverging downstream trajectories. The leading vortex,
  $A_1^a$, convects laterally toward the centreline whereas
  $A_1^b$ travels downstream laterally away from the centreline in figures 21(e) and 21(f). The vortices
  $A_1^a$ and
  $A_1^b$ form a co-rotating vortex pair. This 2P-like wake shedding pattern has been reported in previous studies (Konstantinidis & Balabani Reference Konstantinidis and Balabani2007; Konstantinidis & Liang Reference Konstantinidis and Liang2011). In figure 21(e) vortex
  $A_1^a$ moves across the centreline and approaches vortex
  $B_1$, giving the appearance of a counter-rotating vortex pair, which corresponds to the second pattern observed in earlier studies (Konstantinidis & Bouris Reference Konstantinidis and Bouris2016). The configuration of these patterns and their origin are, however, different to those associated with 2P shedding for cross-flow oscillating cylinders which consist of counter-rotating pairs (Williamson & Roshko Reference Williamson and Roshko1988).

Figure 21. Isocontours of the phase-averaged vorticity,  $\tilde {\omega }_z$, for the synchronized case
  ${f_a}/{f_0}$=2.5 (
 $\,{f_a}/{f_{sh}}$=2) at different phases
  $\phi$ of the shedding cycle in the plane
  ${z}/{H}=0.5$. Overlaid are sectional streamlines of the phase-averaged velocity. Green curves (
 $Q=0$) enclose the vortex cores. Here
  $A$ and
  $B$ identify vortices and the subscripts their order of appearance.
3.5. Phenomenological model description
The synchronization process described above for  $f_a=2f_{sh}$ can help with understanding the behaviour observed at other actuation frequencies. Consider first the influence of the actuation frequency
  $f_a$ on the strength, or circulation, of the shed vortices. The circulation of the shed vortices,
  $\varGamma _V$, is estimated from the phase-averaged PIV data immediately after the shedding event, e.g.
  $\phi =2{\rm \pi}$ in figure 21(b), from
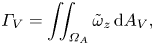 \begin{equation} \varGamma_V=\iint_{\varOmega_A} \tilde{\omega}_z \,\textrm{d}A_V, \end{equation}
where  $\tilde {\omega }_z$ is the phase-averaged vorticity and
  $A_V$ is the area inside the closed contour
  $\varOmega _A$. Following Lyn et al. (Reference Lyn, Einav, Rodi and Park1995) and Cantwell & Coles (Reference Cantwell and Coles1983),
  $\varOmega _A$ is defined along the closed streamline surrounding the shed vortex and connecting at saddle point
  $S$. Figures 22(a) and 22(b) show
  $\varGamma _V$ as a function of
  $f_a$ for synchronized and unsynchronized cases, measured in the planes
  ${z}/{H}=0.5$ and 0.25, respectively. It is found that the circulation of the shed vortices is insensitive to the actuation frequency.
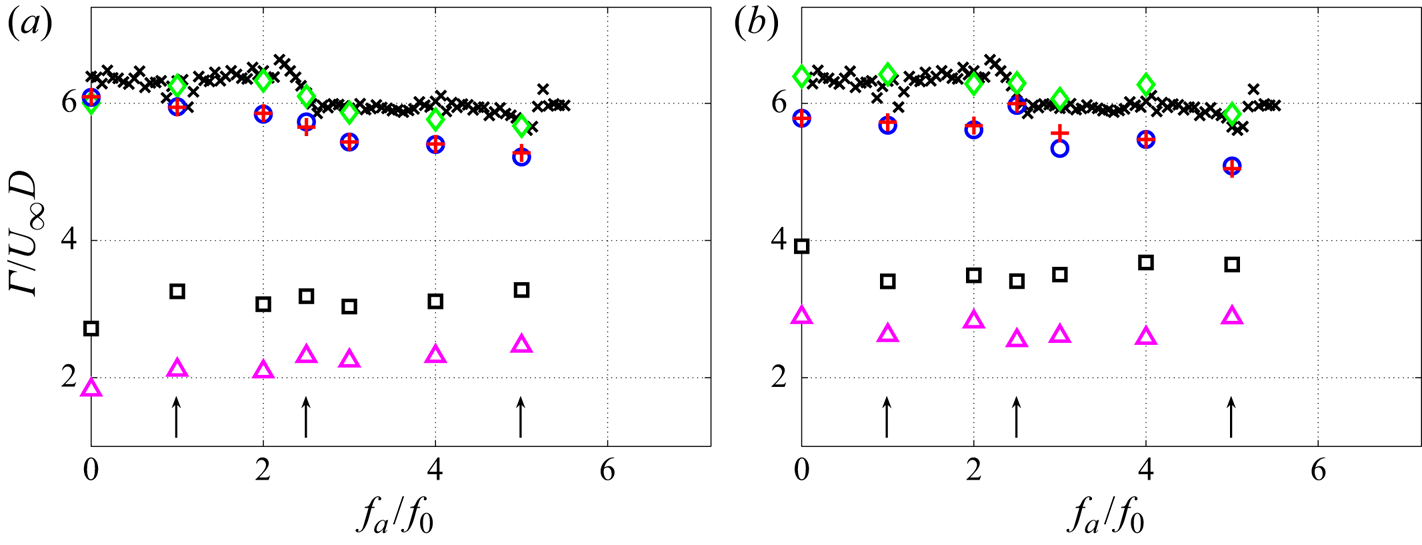
Figure 22. Average of total circulation over a shedding cycle ( $\varGamma _{0}$) and circulation of shed vortex (
 $\varGamma$) are calculated in the two planes (a)
  ${z}/{H}=0.5$ and (b)
  ${z}/{H}=0.25$. Estimated average circulation over a shedding cycle using pressure measurements (
 $\times$, black),
 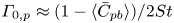 $\varGamma _{0,p} \approx ({1-\langle \bar {C}_{pb} \rangle })/{2St}$; estimated average circulation over a shedding cycle using pressure measurements taken synchronously with PIV (
 $\diamond$, green),
 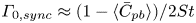 $\varGamma _{0,sync} \approx ({1-\langle \bar {C}_{pb} \rangle })/{2St}$; estimated average circulation over a shedding cycle using mean phase-averaged velocity field (
 $\circ$, blue),
  $\varGamma _{0,PA}= ({1}/{St}) \int _{y1:\tilde {u}_{min}} ^{y2:\tilde {u}_{max}} \overline {\tilde {u}({\partial \tilde {v}}/{\partial x}-{\partial \tilde {u}}/{\partial y})}\,{\textrm {d}y}$; estimated average circulation over a shedding cycle using a mean velocity field (
 $+$, red),
  $\varGamma _{0}= ({1}/{St}) \int _{y1:U_{min}} ^{y2:U_{max}} U({\partial V}/{\partial x}-{\partial U}/{\partial y})\,{\textrm {d}y}$; circulation of the shed vortices (
 $\Box$, black),
  $\varGamma _V$; and circulation bound in the core region (
 $\triangle$, magenta),
  $\varGamma _{VQ}$, as a function of the actuation frequency,
  ${f_a}/{f_0}$. Arrows indicate lock-on intervals.
The definition of  $\varOmega _A$ based on the streamline is, however, subjective because the convective velocity of the vortex core is not constant in the near wake and streamlines are not Galilean-invariant. As an alternative, the circulation
  $\varGamma _{VQ}$ is estimated for the vortex core region, enclosed by the
  $Q=0$. This definition is invariant, but only accounts for the vorticity in the vortex core region and
  $\varGamma _{VQ}$ underestimates the vortex circulation. From figure 22, it is found that
  ${\varGamma _{VQ}}/{\varGamma _V}$ is constant within experimental uncertainty, supporting the conclusion that
  $\varGamma _V$ is insensitive to
  $f_a$, and is independent of synchronization.
The average circulation convected to the wake over a shedding cycle can be obtained using
 \begin{equation} \varGamma_0= \frac{1}{St} \int_{y1:U_{min}} ^{y2:U_{max}} U\left(\frac{\partial V}{\partial x}- \frac{\partial U}{\partial y}\right)\,{\textrm{d}y}. \end{equation}
These results can be generalized by pressure measurements to cases for which PIV measurements are not available. Following Roshko (Reference Roshko1954) or Ahlborn, Lefrancois & King (Reference Ahlborn, Lefrancois and King1998) for 2-D geometries, the average circulation convected to the base region during a shedding cycle can be approximated as
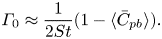 \begin{equation} \varGamma_0 \approx \frac{1}{2St} (1- \langle \bar{C}_{pb} \rangle). \end{equation}
The ratio  ${\varGamma _V}/{\varGamma _0}$ is expected to be constant for a given geometry. From figure 22,
  $\varGamma _0$ varies little with the actuation frequency and
  ${\varGamma _V}/{\varGamma _0} \approx 0.52\pm 0.02$, which agrees well with results for the 2-D circular cylinder (Cantwell & Coles Reference Cantwell and Coles1983), square cylinder (Lyn et al. Reference Lyn, Einav, Rodi and Park1995) and triangular prism (Csiba & Martinuzzi Reference Csiba and Martinuzzi2008). Significantly, the values obtained between the two planes are within the experimental uncertainty, suggesting that the vortex formation and shedding process is similar over much of the base region. This observation is consistent with that of Feng et al. (Reference Feng, Cui and Liu2019) suggesting that the actuation along a slit tends to reduce 3-D effects.
The observation that the circulation of the shed vortices is independent of the actuation frequency lends itself to the concept of a natural vortex formation time proposed by Gharib, Rambod & Shariff (Reference Gharib, Rambod and Shariff1998). Briefly, as the forming vortex approaches a critical circulation, it is increasingly prone to shedding. Thus, the perturbations due to the actuation jet are expected to be most effective for triggering shedding when occurring at intervals approaching the natural formation time, approximately  ${1}/{f_0}$. At
  $f_a=2f_{sh}$, the condition is nearly ideal (this is the most effective actuation for two-sided, symmetric actuation) because an actuation pulse is present to trigger the shedding of the vortices alternately from opposing shear layers. The interim pulses, occurring between the triggering pulses, do not trigger the shedding events because the formation time is not approached. However, these pulses perturb the formation process downstream. The interim pulse vortices alter the vorticity concentration in the forming vortices and thus modify the formation time such that
  $f_{sh}$ differs from
  $f_0$.
It thus follows that the presence of an actuation pulse at  ${1}/{f_{sh}}$ intervals is needed for synchronization and lock-on. For the two-sided actuation, a pulse is present to synchronize both shear layers for
  $f_a=4f_{sh}$ and, thus, lock-on is observed (figure 13). The three interim pulses act to perturb the formation process, resulting in a deviation of
  $f_{sh}$ from
  $f_0$. The presence of these interim vortices is expected to perturb the formation process more severely than for the case
  $f_a=2f_{sh}$, with one interim vortex, leading to a spectral broadening about
  $f_{sh}$ as observed in the fluctuating surface pressure spectra in figure 13(b) and shorter synchronization interval.
When the actuation frequency corresponds to odd multiples of the shedding frequency, the conditions for synchronization can only be satisfied on one side of the obstacle. On the opposing side, the vortex from  $180^\circ$ out-of-phase and, thus, an actuation pulse can never coincide with the formation time. Hence, on the opposing side, the actuation pulses only disturb the formation process, making synchronization unlikely.
The observations for the single-sided actuation are consistent with this synchronization model. Since actuation occurs only on one side, the opposing side develops naturally so that the shedding event is not triggered, but is determined by the disturbed formation time  ${1}/{f_0}$. This observation explains why
  $f_{sh} \approx f_0$ at the beginning of the lock-on intervals for one-sided actuation, unlike the two-sided case. The primary synchronization interval occurs for
  $f_a=f_{sh}\approx f_0$. Unlike for two-sided actuation, there is no pulse perturbing the opposing-side formation and, thus, a longer lock-on interval is observed. For the synchronization at
  $f_a=2f_{sh}\approx 2f_0$, the second interim pulse occurs
  $180^\circ$ later in the shedding cycle, when the opposing side vortex is about to shed and, thus, weakens the synchronization resulting in a slightly shorter lock-on interval compared with two-sided actuation (see figure 16). As the actuation frequency is further increased, the number of interim pulses increases, which increasingly disturbs the opposing vortex formation, such that synchronization becomes increasingly difficult; in contrast to two-sided actuation where a triggering pulse is present on both sides.
4. Conclusion
An experimental investigation of the influence of weak low-frequency actuation on the 3-D turbulent wake of a cantilevered triangular prism of aspect ratio 4 protruding a thin boundary layer is carried out at  $Re=12\,000$. Zero-net-mass-flux actuation using synthetic jets is employed to excite the flow through two slits, symmetrically located on the leeward face along the vertical edges of the obstacle. This work focuses on identifying the physical processes involving weak actuation pulses. These pulses trigger vortex shedding, leading to the lock-on phenomenon and the downstream interactions underlying vortex splitting.
Results of surface pressure measurements on the leeward face and in the wake as well as PIV measurements of the wake velocity over selected planes are presented. Detailed investigation of the phase-resolved velocity field show that the effect of actuation are similar in the planes  ${z}/{H}=$ 0.25 and 0.50. Above a minimum actuation momentum coefficient
  $C_\mu$, the wake response to actuation depends mainly on the actuation frequency
  $f_a$. Spectra of the pressure and velocity fluctuations show that the vortex shedding frequency,
  $f_{sh}$, locks-on to
  $f_a$ over intervals for which
  $f_{sh} = f_a$,
  $f_a/2$ or
  $f_a/4$. During lock-on, compared with the unactuated flow: (i) the mean base pressure coefficient,
  $\bar {C}_{pb}$, is significantly lower while the fluctuating coefficient,
  $C_{pb}^ \prime$, is significantly higher; (ii) the magnitude of velocity fluctuations in the wake increases significantly while the recirculation length decreases by as much as 60 %; (iii) the spectral energy is concentrated in a much narrower frequency band about
  $f_{sh}$; and (iv) splitting of the shed vortices is observed in the wake.
The vortex synchronization mechanism is described and a phenomenological model is presented for the existence of vortex shedding lock-on regimes over several actuation frequency intervals for both two-sided and one-sided actuation. Synchronization occurs when the actuation pulses are injected at intervals approaching the natural vortex formation time (Gharib et al. Reference Gharib, Rambod and Shariff1998). As this time is approached, the rate at which vorticity from the shear layers is fed to the forming (Kármán) vortex is very low. The weak perturbations due to the actuation pulse interrupt this feeding mechanism, thereby triggering the shedding event. Hence, the weak low-momentum pulses perturb critical stages of the vortex formation process, which explains why above a very low minimum  $C_\mu$ the wake response depends mainly on the actuation frequency, rather than the pulse strength.
It is shown that the circulation of the shed vortices is insensitive to the actuation frequency, while the average rate at which circulation is convected to the wake increases with the actuation frequency. Consequently, the formation time is reduced allowing synchronization to occur over a range of actuation frequencies observed as lock-on regimes. Due to the anti-symmetric nature of the shedding process, the necessary conditions for synchronization and lock-on are met when the actuation frequency is even multiples of the shedding frequency, but are generally not satisfied for odd multiples. This model further implies that the interim pulses, occurring between the triggering pulses, cannot trigger shedding. These are transported downstream and interact with the large-scale vortices, leading to vortex splitting. This process is consistent with observations in the wake of co-rotating vortex pairs on the actuation side.
The present model proposes a fundamental mechanism by which very weak perturbations can result in a strong wake response, in particular, the existence of lock-on regimes and complex wake shedding patterns, without changing the basic Kármán shedding mode. Similar responses of the wake to low-amplitude actuations have been observed for other geometries using different actuation methods. For example, similarities observed in the wake response to weak actuations using streamwise oscillating cylinders (Nishihara, Kaneko & Watanabe Reference Nishihara, Kaneko and Watanabe2005; Leontini et al. Reference Leontini, Jacono and Thompson2013) or on-coming flow perturbations (Kim et al. Reference Kim, Yoo and Sung2006; Konstantinidis & Liang Reference Konstantinidis and Liang2011) suggest a broader relevance of the proposed model.
This work contributes to the understanding of the physics underlying the wake response to weak perturbations, which differs from the more commonly studied wake forcing using high-momentum injection or large-amplitude perturbations which generally result in a change of the shedding mode. More generally, this work provides insights into the optimization of mixing processes using low energetic cost actuation. The design of a feedback control system, for example, relies on a description of the actuation mechanism, which is addressed in the present model, and a model describing the response of the wake. This model should account for important differences in the wake response to actuation observed for the different actuation methods. For perturbed on-coming flows, for example,  $f_{sh}$ decreases below
  $f_0$ at the start of the lock-on interval, in contrast to the present results. For weak perturbations, the response of the shedding frequency should be related to changes in the vorticity transported along the separated shear layers and the vorticity concentration in the forming vortices (Ahlborn et al. Reference Ahlborn, Lefrancois and King1998). Hence, relating the actuation parameters to vorticity generation and concentration in the forming vortices for different geometric and actuation configurations is a focus of on-going investigations.
Acknowledgements
The authors wish to thank Professor D.H. Wood for his advise and many discussions.
Funding
The authors acknowledge the financial support of the Natural Sciences and Engineering Research Council (NSERC) of Canada through the Discovery (DG) and the Research Tools and Instrumentation (RTI) grant programs.
Declaration of interests
The authors report no conflict of interest.