I. INTRODUCTION
Hypoxanthine is a natural purine derivative and deamination product of adenine [C5H5N5, one of the two purine bases found in deoxyribonucleic acid (DNA), and ribonucleic acid (RNA)], forming as an intermediate product prior to uric acid (C5H4N4O3) during metabolic breakdown (Sarkar and Nahar, Reference Sarkar and Nahar2007). Defects in purine metabolism can result in significant uptake of hypoxanthine in DNA and RNA, which may impede RNA function and gene expression (Pang et al., Reference Pang, McFaline, Burgis, Dong, Taghizadeh, Sullivan, Elmquist, Cunningham and Dedon2012), and hypoxanthine has been observed as a constituent in riboswitches, which acts as control mechanisms for cellular metabolism (Batey et al., Reference Batey, Gilbert and Montange2004). The levels of purine metabolites are highly regulated in the body and hypoxanthine imbalances may be linked with numerous issues from the formation of crystalline hypoxanthine in muscle tissue (Parker et al., Reference Parker, Snedden and Watts1969) to the occurrence of gout (Puig et al., Reference Puig, Mateos, Jimenez and Ramos1988).
The structure of hypoxanthine was originally determined by Schmalle et al. (Reference Schmalle, Hänggi and Dubler1988) using single-crystal X-ray diffraction (XRD). Figure 1 shows the structure, corresponding to the keto N9H tautomer, illustrating two crystallographically independent molecules (molecules A and B) in the triclinic unit cell. Currently, a single low-precision, unindexed, experimental powder diffraction pattern appears for hypoxanthine in the Powder Diffraction File (ICDD, Reference Kabekkodu2013) (PDF 00-007-0712), although an additional pattern (PDF 02-064-3532) calculated from the crystal structure of Schmalle et al. (Reference Schmalle, Hänggi and Dubler1988) is included in the PDF-4 Organics database. A second calculated entry in the PDF-4 Organics database, based on a recent single-crystal study by Yang and Xie (Reference Yang and Xie2007), suggests the existence of an additional monoclinic polymorph of hypoxanthine. This paper examines the Rietveld refinement of hypoxanthine using rigid body refinement with the Rietveld package GSAS/EXPGUI, and provides a complete reflection list for phase identification, as well as a comparison of experimental proton nuclear magnetic resonance (1H-NMR) data with theoretical density functional theory calculations.

Figure 1. (color online) An illustration of the atomic labeling of hypoxanthine (N9H tautomer, left) and the triclinic unit cell of hypoxanthine, with both independent molecules labeled (right).
II. EXPERIMENTAL
Adenine (≥99%) was purchased from Sigma-Aldrich (Sigma A8626) and used without further purification. Hypoxanthine was produced by slow spontaneous deamination of adenine in an aqueous solution under ambient conditions. After 10 weeks of slow reaction, adenine was fully converted to hypoxanthine. Hypoxanthine was crystallized by slow evaporation from aqueous solution at 80 °C on a hot plate. No detectable by-products were observed by Raman spectroscopy.
X-ray absorption near edge structure (XANES) spectra were collected using the Spherical Grating Monochromator beamline (SGM or 11ID-1) at the Canadian Light Source (CLS). 11ID-1 employs a 45 mm planar undulator source with a spherical grating Dragon-type monochromator using three gratings to cover the energy range between 250 and 2000 eV. The nominal beam size on the sample was 100 × 1000 μm2. An aqueous solution of hypoxanthine was drop coated onto a gold-coated silicon wafer, and then air dried prior to data collection. Two to four spectra were collected in partial fluorescence yield step scanning at the carbon and oxygen K-edges using a step size of 0.1 eV and a 1 s dwell time. The spectra were normalized by dividing by the incident flux (I 0), which was obtained by measuring the total electron yield from a gold mesh. The photon energy was calibrated using graphite for the C K-edge (285.5 eV, Zhou et al., Reference Zhou, Hu, Li, Wang and Zuin2014) and using Li2O2 for the O K-edge (532.3 eV, Gallant et al., Reference Gallant, Mitchell, Kwabi, Zhou, Zuin, Thompson and Shao-Horn2012).
1H-NMR data were collected at the Saskatchewan Structural Sciences Center (SSSC) using a Bruker Advance 500 MHz NMR spectrometer. The spectrum was acquired using 256 scans so as to maximize the signal-to-noise ratio for accurate integration of broadened amine and/or hydroxyl peaks. Six mg of hypoxanthine powder was transferred into a NMR tube using a spatula, and the sample was dissolved in approximately 1 ml of deuterated dimethyl sulfoxide (DMSO). To completely dissolve the sample in DMSO, the tube was sonicated in an ultrasonic water bath at room temperature for approximately 30 min until no undissolved powder was visible. The spectrum was processed and analyzed using the Spinworks 4.0 software package (Marat, Reference Marat2014).
Powder X-ray diffraction (PXRD) patterns were collected using a Canadian Macromolecular Crystallography Facility beamline (CMCF-BM or 08B1-1) at the CLS. 08B1-1 is a bending magnet beamline where the photon energy is selected with a Si (111) double-crystal monochromator. The hypoxanthine powder was loaded, with no grinding, into a 0.5 mm ID Kapton capillary which was sealed at both ends with a Loctite adhesive. Two-dimensional (2D) PXRD patterns were obtained using a Rayonix MX300HE detector with an active area of 300 × 300 mm2. The patterns were collected at an energy of 18 keV (λ = 0.688 80 Å) and capillary–detector distance of 250 mm.
The 2D PXRD patterns were calibrated and integrated using the GSASII software package (Toby and Von Dreele, Reference Toby and Von Dreele2013). The sample–detector distance, detector centering, and tilt were calibrated using a lanthanum hexaboride (LaB6) standard reference material (NIST SRM 660a LaB6) and the calibration parameters were applied to all patterns. After calibration, the 2D patterns were integrated to obtain the standard PXRD patterns. A pattern from an empty 0.5 mm ID Kapton capillary (collected using the same conditions) was subtracted from the sample data during integration. The integrated LaB6 pattern was used to obtain the instrument resolution of the beamline for the refinement of the hypoxanthine sample.
The single-crystal structure of Schmalle et al. (Reference Schmalle, Hänggi and Dubler1988) was used as an initial model for the refinement. Rigid body Rietveld refinement was performed with the GSAS/EXPGUI program (Toby, Reference Toby2001; Larson and Von Dreele, Reference Larson and Von Dreele2004). The implementation of rigid body refinements in GSAS and EXPGUI has been described previously in the literature (Dinnebier, Reference Dinnebier1999; Lake and Toby, Reference Lake and Toby2011). Rigid bodies were created for both independent hypoxanthine molecules, including the hydrogen atoms. The carbon, nitrogen, and oxygen atoms were refined with an overall isotropic displacement parameter (U iso), whereas the hydrogen atoms were constrained to a U iso value of 1.3 times the heavier atoms. Toward the end of the refinement, the positions of the hydrogen atoms were optimized with the Mercury 3.3 module of the Cambridge Structural Database (Allen, Reference Allen2002). The background was refined using an orthogonal Chebyschev polynomial. The crystal data, data collection, and refinement details are summarized in Table I.
Table I. The crystal data, data collection, and refinement parameters obtained for the hypoxanthine refinement.
Ab initio calculation of the 1H isotropic magnetic shielding was carried out at the B3LYP/6-311+G(d,p) theory level (Becke, Reference Becke1988; Lee et al., Reference Lee, Yang and Parr1988) using Q-Chem 4.1 (Krylov and Gill, Reference Krylov and Gill2013). The chemical shifts were converted from the isotropic magnetic shielding:
 $$\eqalign{\delta_{\rm H} = & \delta _{\hbox{isotropic (DMSO)}} \cr & - \delta _{\scriptstyle {\rm H}\ \hbox{(calculated isotropic magnetic shielding)}}}$$
where δ isotrophic(DMSO) is 32. No hydrogen bonding or anisotropic effects were taken into account in the calculations.
III. RESULTS AND DISCUSSION
Hypoxanthine can exist in either its keto or enol tautomer. Figure 2 shows the structure of both of these tautomers for hypoxanthine, differentiated by protons H1 and H6. In addition, two keto tautomers have been observed with protons on either the N7 (N7H tautomer) or N9 (N9H tautomer) sites. To verify which tautomer of hypoxanthine was present in the sample, C and O K-edge XANES and 1H-NMR spectra were obtained.
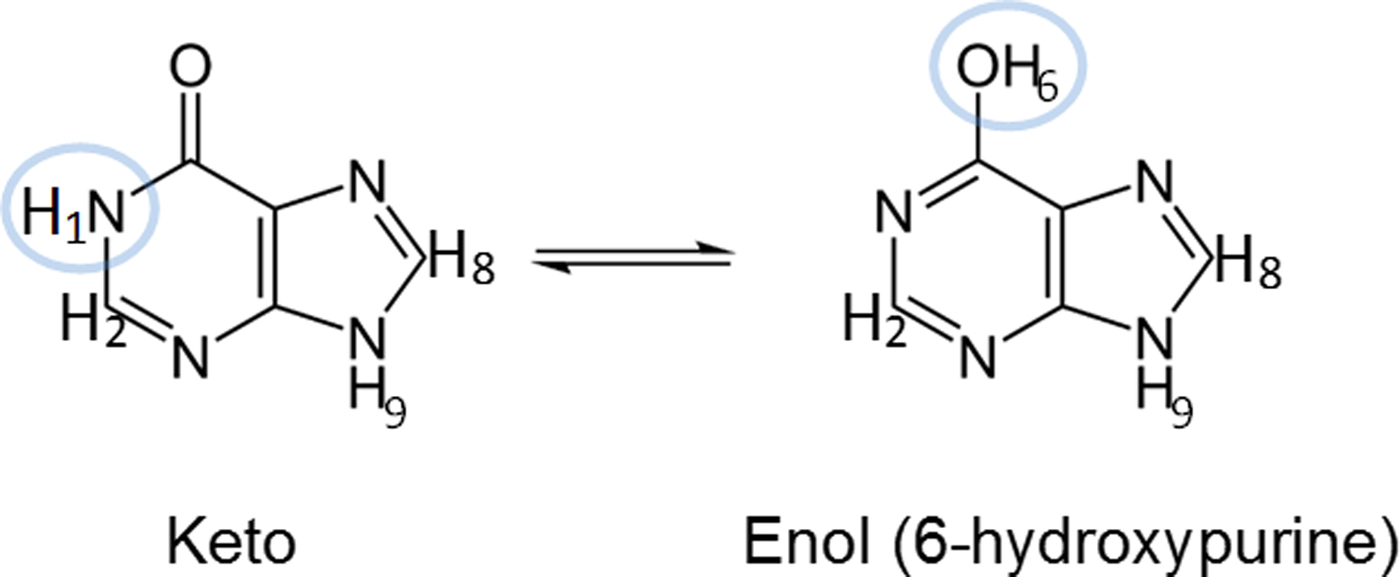
Figure 2. (color online) Structures of the keto and enol N9H tautomers of hypoxanthine. The highlighted protons give rise to expected differences in their respective 1H-NMR spectra.
Figures 3(a) and 3(b) illustrate the XANES spectra for the C and O K-edges, respectively. The prominent peaks at 287.8 eV in the C K-edge and 532.2 eV in the O K-edge have been studied previously in purines (Samuel et al., Reference Samuel, Lee, Gamble, Fischer and Castner2006; Zubavichus et al., Reference Zubavichus, Shaporenko, Korolkov, Grunze and Zharnikov2008) and assigned to π * carbonyl (C=O) bonding, suggesting that the keto tautomer of hypoxanthine is present in the solid.

Figure 3. (color online) The carbon (a) and oxygen (b) K-edge XANES spectra obtained for hypoxanthine. The strong peak at 286.5 eV is because of π * C–N bonding (Samuel et al., Reference Samuel, Lee, Gamble, Fischer and Castner2006).
The single-crystal XRD study of Schmalle et al. (Reference Schmalle, Hänggi and Dubler1988) concluded that both crystallographically independent hypoxanthine molecules A and B were predominantly the N9H tautomer in the solid state, but could not definitively exclude the minor presence of other tautomers based on the final difference Fourier synthesis. In the work presented here, the N9H starting model was used for the PXRD refinement, but tests were also performed by adding the H7 proton in ideal positions for both molecules, and constraining the H7 and H9 occupancies to be equal to 1 (starting with an equal fraction between them). Although the results were sensitive to the stage of refinement and starting conditions, the H7 occupancy always yielded a negative value for molecule B (with a corresponding H9 occupancy greater than 1), and generally yielded either a negative or quite small value for molecule A. Given the low atomic scattering factor for hydrogen with X-rays, this result is not definitive, but the final refinement was conducted assuming both molecules are present as the N9H tautomer. Figure 4 illustrates the final Rietveld refinement of hypoxanthine obtained with GSAS, whereas the refined atomic coordinates are shown in Table II. Similar to previous 2D data obtained for curcumin (Reid et al., Reference Reid, Kaduk, Garimella and Tse2015), hypoxanthine exhibited graininess but even mild grinding resulted in significant reflection broadening, making the 2D detector crucial for obtaining reasonable intensity estimates.

Figure 4. (color online) A plot of the final Rietveld refinement for hypoxanthine (χ 2 = 1.32). The vertical scale has been multiplied by a factor of 10 for 2θ > 14°.
Table II. The refined crystal structure of hypoxanthine (χ 2 = 1.32, R p = 0.0624, R wp = 0.0831).

The refined lattice parameters obtained are a = 7.1179 (2) Å, b = 9.7830 (3) Å, c = 10.4009 (3) Å, α = 58.876 (1)°, β = 67.609 (1)°, and γ = 71.937 (2)°. All atom positions, in space group P
 $\bar 1$
(#2), correspond to 2i Wyckoff sites with full occupancy.
$\bar 1$
(#2), correspond to 2i Wyckoff sites with full occupancy.
A comparison of hydrogen-bonding distances from the PXRD and single-crystal refinement of Schmalle et al. (Reference Schmalle, Hänggi and Dubler1988) are given in Table III. The single-crystal and powder results are quite consistent, with only slight discrepancies observed in the bond lengths greater than 3 Å.
Table III. A comparison of the hydrogen bonding values for hypoxanthine from PXRD refinement and the single-crystal structure of Schmalle et al. (Reference Schmalle, Hänggi and Dubler1988).

A reflection list for hypoxanthine was prepared by summing adjacent reflections with relative integrated intensities larger than 0.1% and closer than 0.02° 2θ as multiple reflections and assigning a weighted average reflection position. The final reflection list in Table IV contains all reflections with relative integrated intensities greater than or equal to 0.3%.
Table IV. The reflection list obtained for hypoxanthine from the Rietveld refinement, including integrated intensities ≥ 0.3%, after summing reflections closer than 0.02° as multiple reflections and using a weighted average reflection position.

The 1H-NMR spectrum of hypoxanthine in solution was acquired at room temperature using deuterated DMSO as the solvent. Figures 5(a) and 5(b) show the 1H-NMR spectrum of the hypoxanthine sample with labeled chemical shifts and integral values. The two singlet peaks shown in Figure 5(a) at 7.97 and 8.11 ppm correspond to the expected shifts and splitting patterns of protons H2 and H8, respectively. The integral of the peak at 8.11 ppm was calibrated to a value of 1.00, which was used to calculate relative integral values of the other peaks. The peak at 7.97 ppm integrated to a value of 1.02, which is also consistent with the expected proton assignment. A comprehensive NMR study of hypoxanthine by Deng et al. (Reference Deng, Cahill, Abad, Lewandowicz, Callender, Schramm and Jones2004) indicates that the separation in chemical shift between these two aryl peaks is quite different for the N9H tautomer (0.01 ppm) and N7H tautomer (0.18 ppm). This has also been demonstrated using deuterated dimethylformamide as a solvent (Bartl et al., Reference Bartl, Zacharová, Sečkářová, Kolehmainen and Marek2009). Our observed separation of 0.14 ppm suggests that N7H tautomer is predominantly present in the DMSO solution and the N9H tautomeric form is negligible under the current experimental conditions. In contrast, the ratio of N7H and N9H tautomers was reported to be 58/42 (Chenon et al., Reference Chenon, Pugmire, Grant, Panzica and Townsend1975), evaluated from the C4 and C5 chemical-shift Carbon-13 NMR data of hypoxanthine in DMSO at elevated temperature (37 and 58 °C). Deng et al. (Reference Deng, Cahill, Abad, Lewandowicz, Callender, Schramm and Jones2004) obtained a similar ratio (55/45), evaluated from the intensity ratio of N7H and N9H peaks in the proton NMR spectrum of hypoxanthine in a mixture of 55% DMSO and 45% acetonitrile at low temperature (−40 °C). It is noted that the two aryl peaks of hypoxanthine appear at 8.17 and 8.20 ppm in aqueous solution, suggesting that the N9H tautomer is predominantly present in water.

Figure 5. (color online) The 1H-NMR spectrum observed for the hypoxanthine sample for chemical shifts between (a) a narrow range of 7.92 and 8.18 ppm and (b) a wide range of 7.5–15 ppm.
Figure 5(b) shows a very broad peak found at 12.70 ppm, with a relative integral value of 2.08 (integrated from 12.0 to 13.6 ppm), which is characteristic of a highly de-shielded amine. It is interesting to note that a broad peak was also observed at 12.8 ppm in the proton NMR spectrum of 4(3H)-pyrimidinone in DMSO, which corresponds to the chemical shift of H1 (Saladino et al., Reference Saladino, Crestini, Costanzo, Negri and Di Mauro2001). Our ab initio calculations predicted that the chemical shifts of H1, H7, and H9 in the keto form should be very similar, whereas that of H6 from the enol form would be located further upfield by 2–3 ppm (see Tables V–VII). The experimental chemical shifts of the H9, H7, and H1 protons tabulated by Deng et al. (Reference Deng, Cahill, Abad, Lewandowicz, Callender, Schramm and Jones2004) for the keto form of hypoxanthine fall between 12.4 and 13.7 ppm, which are consistent with the location of the broad peak observed in this work. The differences between the calculated and observed chemical shifts are because of the strong hydrogen bonding in DMSO, which is not accounted for in the ab initio calculations. As N9H is negligible, an integral of 2 indicates that the broad peak in our NMR spectrum can be attributed to H1 and H7 (each with an integral of 1), which further suggests that hypoxanthine is predominantly in its keto form in DMSO at room temperature. The small peak at 10.77 ppm with an integral value of 0.12 may be attributed to H6, which suggests a minor presence of the enol form of hypoxanthine under these conditions.
Table V. The calculated 1H chemical shifts of the keto N9H tautomer of hypoxanthine in DMSO.
Table VI. The calculated 1H chemical shifts of the keto N7H tautomer of hypoxanthine in DMSO.
Table VII. The calculated 1H chemical shifts of the enol N9H tautomer of hypoxanthine in DMSO.
ACKNOWLEDGEMENTS
The authors thank the Saskatchewan Structural Sciences Centre (SSSC) for access and assistance with the collection of the NMR data. Research described in this paper was performed using beamlines 08B1-1 and 11ID-1 at the Canadian Light Source, which is supported by the Canadian Foundation for Innovation, the Natural Sciences and Engineering Research Council of Canada, the National Research Council of Canada, the Canadian Institutes of Health Research, the Government of Saskatchewan, Western Economic Diversification Canada, and the University of Saskatchewan.