INTRODUCTION
Miyake et al. (Reference Miyake, Nagaya, Masuda and Nakamura2012, Reference Miyake, Masuda and Nakamura2013, Reference Miyake, Masuda, Hakozaki, Nakamura, Tokanai, Kato, Kimura and Mitsutani2014) described rapid and short-lasting increases of radiocarbon (14C) concentration in the annual tree rings of the Japanese cedar (Cryptomeria japonica) and Hinoki cypress (Chamaecyparis obtusa) between AD 774 and 775 and AD 993 and 994, respectively. In both these analyzed periods, the sudden increase was observed almost in a single year. The increase in the 14C content was about 12‰ in the period AD 774–775 (Miyake et al. Reference Miyake, Nagaya, Masuda and Nakamura2012) and between 9.1‰ and 11.3‰ in the period AD 993–994 (Miyake et al. Reference Miyake, Masuda and Nakamura2013, Reference Miyake, Masuda, Hakozaki, Nakamura, Tokanai, Kato, Kimura and Mitsutani2014).
The sudden increase between AD 774–775 seemingly took place within a single year, as has been confirmed by other authors, e.g. Rakowski et al. (Reference Rakowski, Krapiec, Huels, Pawlyta, Dreves and Meadows2015) in English oak (Quercus robur) from southern Poland, Usoskin et al. (Reference Usoskin, Kromer, Ludlow, Beer, Friedrich, Kovaltsov, Solanki and Wacker2013) in deciduous oak (Quercus spp.) from Germany, Güttler et al. (Reference Güttler, Beer, Bleicher, Boswijk, Hogg, Palmer, Vockenhuber, Wacker and Wunder2013, Reference Güttler, Adolphi, Beer, Bleicher, Boswijk, Christl, Hogg, Palmer, Vockenhuber, Wacker and Wunder2015) in kauri pine (Agathis australis) from New Zealand, and Jull et al. (Reference Jull, Panyushkina, Lange, Kukarskih, Myglan, Clark, Salzer, Burr and Leavitt2014) in bristlecone pine (Pinus longaeva) from the United States and larch (Larix sibirica) from northwest Siberia, demonstrating that this was a global event.
14C is one of the cosmogenic nuclides, which is formed during collisions between thermal neutrons and nitrogen nuclei in the nuclear reaction 14N(n,p)14C. 14C formed in the atmosphere is immediately oxidized to produce 14CO2 and through photosynthesis is incorporated into plants. The concentration of this radioisotope in plants reflects its concentration in the atmosphere during the growing season, which is different for different plants and locations.
The global average production rate of 14C is of the order of 2 atoms·cm–2·s–1 (Castagnoli and Lal Reference Castagnoli and Lal1980) and strongly depends on the intensity of the cosmic ray flux. Radiocarbon production varies due to changes in the intensity of the solar magnetic field, the interplanetary magnetic field, and Earth’s magnetic field, which modulate the flux of cosmic rays. The production rate may also increase due to extraterrestrial high-energy events, such as solar proton events (SPE), supernova explosions, or gamma-ray bursts (GRB), which all increase the intensity of cosmic rays reaching the upper atmosphere. The resulting increases in 14C production due to such phenomena will be recorded in trees’ annual growth rings as increasing 14C concentrations.
Rapid changes in 14C concentration are very important in 14C dating. Both events, AD 774/775 and AD 993/994, fall in a period for which there are detailed historical records in Europe, Asia, and North Africa, as well as absolutely dated dendrochronological sequences from other regions. Both 14C spikes must therefore be taken into account when interpreting 14C results from this period. A short-lived 14C sample formed in AD 775, such as a leaf or seed, could appear to date to the early 10th century if its 14C age is calibrated using the international consensus calibration curve for the Northern Hemisphere (Reimer et al. Reference Reimer, Bard, Bayliss, Beck, Blackwell, Bronk Ramsey, Buck, Cheng, Edwards, Friedrich, Grootes, Guilderson, Haflidason, Hajdas, Hatté, Heaton, Hoffman, Hogg, Hughen, Kaiser, Kromer, Manning, Niu, Reimer, Richards, Scott, Southon, Staff, CSM and van der Plicht2013). Due to the steepness in the calibration curve in the early 11th century, a precisely measured short-lived sample from AD 994 may only appear to be a few decades too young, but with typical AMS measurement errors, a significant proportion of bones and seeds of this date would appear to date after ca. AD 1040, and often after ca. AD 1160. On the other hand, at sites with floating or insecurely dated dendrochronological sequences, the identification of the AD 993–994 event could be helpful for precise dating (Wacker et al. Reference Wacker, Guttler, Goll, Hurni, Synal and Walti2014), given the rich historical record for 11th-century Europe, for example. It is thus important to establish whether the AD 993–994 event noted by Miyake and colleagues was global in character, and of sufficient magnitude to be detected by routine AMS measurements. For this reason, we have extended our earlier work on oak from Poland to also cover the decades around AD 981–1000 (Rakowski et al. Reference Rakowski, Krapiec, Huels, Pawlyta, Dreves and Meadows2015). Whether the AD 993–994 event is detectable in oak is particularly relevant to archaeological research in our region, as this species was widely used by carpenters in medieval Europe, surviving in structural timbers, furniture, and fittings, and is therefore often studied by dendrochronologists.
SAMPLES AND METHOD
Samples of sub-fossil oak (Quercus robur), 5–10 cm slices of 98 trunks, were taken in the late 1990s for dendrochronological studies from the Vistula River in the village of Kujawy, near Kraków (50.0522 N, 20.1035 E; Figure 1), from earthworks beneath the sewage plant. After sample preparation to disclose visible anatomic structures and to enable the identification of annual growth rings, measurement tracks along 2–4 trunk radii were delineated. Measurements were made with 0.01 mm accuracy using a DENDROLAB 1.0 apparatus, and then the ring-width sequences were processed with a set of computer programs TREE-RINGS (Krawczyk and Krąpiec Reference Krawczyk and Krąpiec1995), TSAP (Rinn Reference Rinn2005), and DPL (Holmes Reference Holmes1999). A 928-yr local chronology spanning the years AD 387–1316, KUAA1AL, was constructed from the 73 individual sequences (Krąpiec Reference Krąpiec2001). Sample KU13, which was selected for 14C analysis (Figures 2 and 3), spanned AD 908–1051 and was dendrochronologically dated using the standard for southern Poland oak, POLSKA 2 (Krąpiec Reference Krąpiec2001), with t=8.1, GL=73%, where the t-value represents the significance of the correlation of two series in relation to their overlap, which should not drop below 3.5 to maintain dating confidence (Baillie and Pilcher Reference Baillie and Pilcher1973). The GL (Gleichläufigkeit) was developed as a special tool for the cross-dating of tree-ring series. The degree of similarity based on the positive or negative trend of each width is expressed as a percentage of the number of intervals (Eckstein and Bauch Reference Eckstein and Bauch1969).
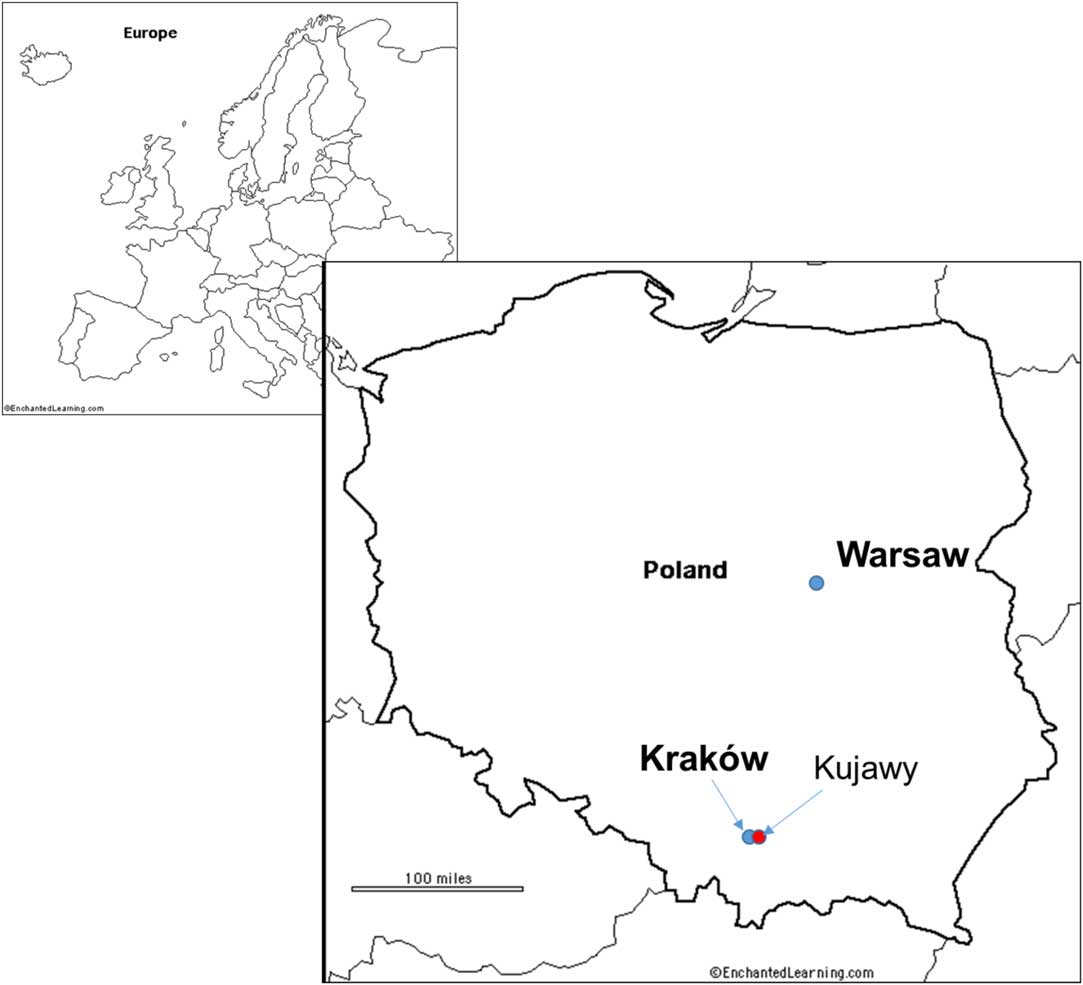
Figure 1 Location of Kujawy (50.0522 N, 20.1035 E) near Kraków, SE Poland.

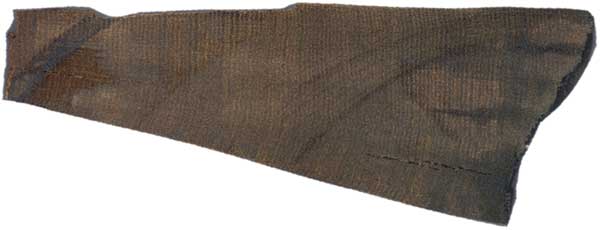
Figure 2 Cross-section of the tree (Quercus robur) used for analysis of the changes in carbon composition between AD 981 and AD 1000. The whole section covers the years between AD 908 and AD 1051 and was dendrochronologically dated using the standard for southern Poland oak, POLSKA 2 (Krąpiec Reference Krąpiec2001).
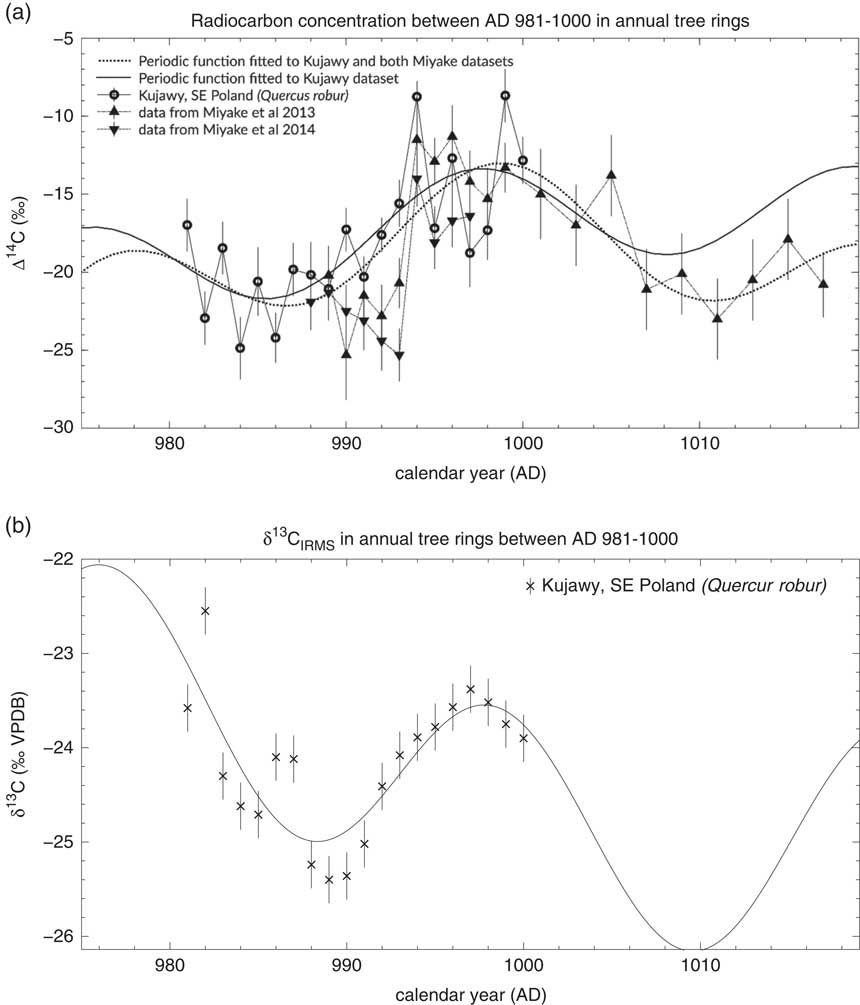
Figure 3 Values of Δ14C (a) and δ13CIRMS (b) for the period AD 981–1000. Smooth lines are periodic functions fitted to the data (see Table 2). All δ13CIRMS data were obtained from measurements with IsoPrimeTM IRMS. Data from Miyake et al. (Reference Miyake, Masuda and Nakamura2013, Reference Miyake, Masuda, Hakozaki, Nakamura, Tokanai, Kato, Kimura and Mitsutani2014) were used to compare the magnitude of the effect in Europe and Japan.
Each annual tree ring from AD 981–1000 was washed in distilled water, and α-cellulose was extracted using a method described by (Green Reference Green1963). To expedite the separation of single cellulose fibers from wood samples, and thus to increase the penetration of reagents, an ultrasonic bath was used (Pazdur et al. Reference Pazdur, Korput, Fogtman, Szczepanek, Hałas, Krąpiec and Szychowska-Krąpiec2005). Around 4 mg of α-cellulose extracted from each sample was combined with cupric oxide and silver wool, sealed in a quartz tube, and evacuated with a rotary oil pump. For each sample, the prepared cellulose material was sealed at least two times for subsequent CO2 conversion and 14C AMS measurements. The flame-sealed tubes were then placed in an electric furnace for 4 hr at 900ºC. The carbon dioxide produced from the samples was released under vacuum, cryogenically purified and collected, and graphitized by reaction with H2 at 600ºC on an Fe catalyst (Nadeau et al. Reference Nadeau, Grootes, Schleicher, Hasselberg, Rieck and Bitterling1998).
The resulting mixture of graphite and iron powder was pressed into a target holder and measured with the AMS system at Leibniz Laboratory Kiel (Germany). The 12C3+ and 13C3+ currents were kept at around 200 nA. The 14C contents are reported as Δ14C in per mil (‰) deviations from the standard sample, 0.7459 activity of NBS oxalic acid (SRM-4990C). Age correction and isotopic composition correction were calculated following the formulas presented in (Stuiver and Polach Reference Stuiver and Polach1977). The correction for isotopic composition was made based on δ13C measured with the AMS system. The age calculation was presented in Nadeau and Grootes (Reference Nadeau and Grootes2013).
The stable carbon isotope ratio (δ13C) was also measured in an aliquot of the α-cellulose extracts using a continuous-flow isotope ratio mass spectrometer system (EuroVectorTM EA3000 elemental analyzer, coupled to an IsoPrimeTM mass spectrometer) at the Gliwice Radiocarbon Laboratory (Institute of Physics CSE, Silesian University of Technology, Gliwice, Poland). All the measurements were carried out in duplicate. 60–70 μg of cellulose was weighed for each sub-sample, which was then wrapped in tin foil. The positions of the sample duplicates in the measurement queue were randomized. The elemental analyzer combustion furnace was heated to 1020°C, but, because of the presence of tin and a massive excess of oxygen, the effective combustion temperature exceeded 1300°C. The combustion gases were carried by helium through a magnesium perchlorate-filled water trap and separated on a packed GC column. For each dozen sub-samples, two reference samples were measured. All the isotopic ratio calculations were carried out using the one-point calibration method (Coplen et al. Reference Coplen, Brand, Gehre, Groning, Meijer, Toman and Verkoutern2006). FLCELL, Fluka commercial cellulose intercalibrated within the ISONET project, was used as the laboratory standard (Boettger et al. Reference Boettger, Haupt, Knöller, Weise, Waterhouse, Rinne and Loader2007). The results for the stable carbon isotope ratio were calculated as an arithmetic average for duplicates and expressed in the δ13CVPDB notation on the VPDB scale (IAEA 2014). The uncertainty for δ13C was estimated as the standard deviation of replicated measurements for samples of known isotopic composition (FLCELL samples).
RESULTS
The measured results (F14C, Δ14C, and δ13C) with their corresponding uncertainties are presented in Table 1. Figures 3a and 3b show Δ14C and δ13C values for the period AD 981–1000. For comparison, samples from AD 990–995 were measured separately at the Royal Institute for Cultural Heritage in Brussels, Belgium (KIKIRPA, Laboratory identifier RICH). The final results shown in Table 1 and Figure 3a were calculated as a weighted mean of the measured 14C concentrations.
Table 1 F14C, Δ14C, and δ13CPDB values for annual tree rings of Quercus robur from Kujawy village near Kraków (SE Poland).

On a broad scale, the Kujawy tree ring sequence between AD 981–AD 1000 showed a comparable pattern to that seen in conifers in Japan (Miyake et al. Reference Miyake, Masuda and Nakamura2013, Reference Miyake, Masuda, Hakozaki, Nakamura, Tokanai, Kato, Kimura and Mitsutani2014), e.g., a rapid increase in Δ14C from AD 993 to AD 994 (Figure 3a). However, in contrast to the Japanese conifer records, we observed a more gradual increase from AD991 to AD993 of ≈ 4.7‰, followed by a 6.8‰ increase between AD 993 and 994 (ΔΔ14CAD991–993 ≈ 11.5‰). After AD 994, the 14C concentration decreased gradually until AD 998 to ≈ –17.3‰, followed by a second jump in Δ14C to –8.7‰ (ΔΔ14C ~ 8.6‰). This second increase of 14C concentration after AD 998 is difficult to explain,
The δ13C signal of the Kujawy cellulose sequence showed a quasi-periodic distribution pattern between AD 881 to AD 1000 (Figure 3b). The δ13C values decreased from ≈ –23.8‰ in AD 981 to minimum values around AD 989–990 of ≈ –25.4‰ and increased between AD 989 and AD 997 (Δ ≈ 2.2‰).
DISCUSSION
As a cause for the observed 14C excursions in AD 994 and AD 775, one (or a series of) strong solar proton event (SPE) has been suggested (Usoskin and Kovaltsov Reference Usoskin and Kovaltsov2012; Mekhaldi et al. Reference Mekhaldi, Muscheler, Adolphi, Aldahan, Beer, McConnell, Possnert, Sigl, Svensson, Synal, Welten and Woodruff2015; Park et al. Reference Park, Southon, Fahrni, Creasman and Mewaldt2017).
The Kujawy sequence showed a significant increase in Δ14C from AD 991 to AD 994 (Figure 3a) of 11.5 (≈7σ confidence level), which corresponds well with the values reported for the Japanese conifers’ records (ΔΔ14C=9.2±2.6‰ and 11.3±2.5‰; Miyake et al. Reference Miyake, Masuda and Nakamura2013, Reference Miyake, Masuda, Hakozaki, Nakamura, Tokanai, Kato, Kimura and Mitsutani2014) and Danish oak (ΔΔ14C=10.5±3.5‰ (late wood data); Fogtmann-Schultz et al. Reference Fogtmann-Schulz, Ostbo, Nielsen, Olsen, Karoff and Knudsen2017), albeit distributed over 3 years instead of a single year. This may suggest that there was not only one SPE event around AD 993–994, but at least one more around AD 992–993, which contributed to the early (AD 992–993) Δ14C increase.
Preceding the 991–994 Δ14C excursion, a decreasing Δ14C trend from AD 981 to AD 986 was observed in the Kujawy sequence. A similar decreasing trend was observed for the AD 775 event and the longer lasting (3–4 yr) Δ14C excursion around BC 660 by Park et al. (Reference Park, Southon, Fahrni, Creasman and Mewaldt2017), which the authors took as an indication for elevated solar activities (and low 14C production due to larger heliomagnetic shielding against galactic cosmic rays). The authors suggested that a combination of coronal mass ejection events (CME) and associated SPEs could have been a common cause for all three Δ14C excursion events, e.g., the events around BC 660, AD 775, and AD 994.
A periodic function y(t)=b+x
1(t)+x
2(t), where
 $x_{i} \left( t \right){\equals}A_{i} sin\left( {{{2\pi } \over {T_{i} }}t{\plus}{{2\pi } \over {T_{i} }}\varphi _{i} } \right)$
was fitted to both the Δ14C and δ13C time series. The periods T
i
were given a priori as the best known solar cycle periods, 22 (Hale cycle) and 88 (Gleissberg cycle) years (Peristykh and Damon Reference Peristykh and Damon2003; Lassen and Friis-Christensen Reference Lassen and Friis-Christensen1995). The 11-yr cycle was rejected during periodic function fitting because the cycles with periods of 22 and 88 years described both time series adequately. The fitted functions are presented in Figure 3, while the values of the fitted parameters are given in Table 2. While the periodic functions were fitted to Δ14C from the Kujawy dataset only, a constant level b was estimated as an average Δ14C of all the Kujawy and both Miyake datasets (Miyake et al. Reference Miyake, Masuda and Nakamura2013, Reference Miyake, Masuda, Hakozaki, Nakamura, Tokanai, Kato, Kimura and Mitsutani2014) (Figure 3a).
$x_{i} \left( t \right){\equals}A_{i} sin\left( {{{2\pi } \over {T_{i} }}t{\plus}{{2\pi } \over {T_{i} }}\varphi _{i} } \right)$
was fitted to both the Δ14C and δ13C time series. The periods T
i
were given a priori as the best known solar cycle periods, 22 (Hale cycle) and 88 (Gleissberg cycle) years (Peristykh and Damon Reference Peristykh and Damon2003; Lassen and Friis-Christensen Reference Lassen and Friis-Christensen1995). The 11-yr cycle was rejected during periodic function fitting because the cycles with periods of 22 and 88 years described both time series adequately. The fitted functions are presented in Figure 3, while the values of the fitted parameters are given in Table 2. While the periodic functions were fitted to Δ14C from the Kujawy dataset only, a constant level b was estimated as an average Δ14C of all the Kujawy and both Miyake datasets (Miyake et al. Reference Miyake, Masuda and Nakamura2013, Reference Miyake, Masuda, Hakozaki, Nakamura, Tokanai, Kato, Kimura and Mitsutani2014) (Figure 3a).
Table 2 Parameters of the periodic function y(t)=b+x
1(t)+x
2(t), where
$x_{i} \left( t \right){\equals}A_{i} sin\left( {{{2\pi } \over {T_{i} }}t{\plus}{{2\pi } \over {T_{i} }}\varphi _{i} } \right)$
fitted to the Δ14C and δ13CIRMS time series. Periods of 88 and 22 yr were selected a priori. b in the Δ14C function fitted to the Kujawy only data was calculated as an average of the Kujawy and Miyake et al (Reference Miyake, Masuda and Nakamura2013, Reference Miyake, Masuda, Hakozaki, Nakamura, Tokanai, Kato, Kimura and Mitsutani2014) datasets.
Although the Δ14C and δ13C time series visually appeared to be correlated, the correlation between them was only r=0.363 (the critical value is equal to 0.3673 for df=18, p=0.1). The amplitudes of the fluctuation as revealed from the fitted periodic functions were about 2.3‰ for the δ13C time series and about 5.5‰ for the Δ14C time series. The periodic function amplitude of the 88-yr cycle fitted to the Kujawy Δ14C time series was estimated to be 2.7±3.8‰, which is in agreement with the average 88-yr cycle amplitude of Δ14C fluctuations for the last 11 ka, which was estimated to be about 1‰ as stated by Peristykh and Damon (Reference Peristykh and Damon2003). For both the Δ14C and δ13C of the Kujawy sequence, a comparably close agreement with a fitted 22-yr+88-yr solar cycle periodicity can be observed, suggesting that during the investigated period the environmental conditions of the tree-ring growth and carbon fixation were significantly influenced by solar activity. Treydte et al. (Reference Treydte, Frank, Esper, Andreu, Bednarz, Berninger, Boettger, D’alessandro, Etien, Filot and Grabner2007) suggest that for the 20th century in Central Europe, the δ13C signal in alpha-cellulose extracted from tree-rings positively correlates to maximum summer temperature. On the other hand, lower solar activity may lead to decrease of the temperature, as was observed during the Maunder Minimum (Lean et al. Reference Lean, Skumanich and White1992). The δ13C periodic behavior following the solar activity cycle supports the hypothesis that the AD 993 and 994 14C excursion was caused by increased solar activity within the solar cycle. Nevertheless, more data from other regions as well as longer records would be advantageous to confirm our suggestions.
CONCLUSIONS
The results of our study confirm that the abrupt increase in 14C concentration during the AD 993–994 event is shown in annual tree rings of oak from Poland. The increase of 6.8±1.8‰ in Δ14C in the tree rings between AD 993 and 994 is the same (the t-statistic is equal to 0.747) as reported in the literature for Japan (Miyake et al. Reference Miyake, Masuda and Nakamura2013, Reference Miyake, Masuda, Hakozaki, Nakamura, Tokanai, Kato, Kimura and Mitsutani2014). Also, the total increase in Δ14C of 11.5±1.6‰ from AD 991 to 994 corresponds well with the values reported in Miyake et al. (Reference Miyake, Masuda and Nakamura2013, Reference Miyake, Masuda, Hakozaki, Nakamura, Tokanai, Kato, Kimura and Mitsutani2014). The similar and simultaneous increase in 14C in two distant locations in the Northern Hemisphere is accompanied by the high 36Cl/10Be ratio observed in polar ice both in Greenland and the Western Antarctic (Mekhaldi et al. Reference Mekhaldi, Muscheler, Adolphi, Aldahan, Beer, McConnell, Possnert, Sigl, Svensson, Synal, Welten and Woodruff2015). The changes in the production rate of three cosmogenic isotopes found in four different locations strongly support the hypothesis of the global character of the phenomena. The identification of excursions in 14C production may be of great use for precise dating, for example by using the wiggle-match method (Wacker et al. Reference Wacker, Guttler, Goll, Hurni, Synal and Walti2014). The hypothesis that the excursion was caused by solar activity is supported by the periodic fluctuations also seen in the δ13C data, which probably reflect solar-caused environmental changes.
ACKNOWLEDGMENTS
We express our thanks to all the staff of the Leibniz Laboratory of University of Kiel for their kind support; thanks are due, in particular, to Katrin Paap-Meiss, Monika Gumz, and Nicole Möckel. This work was supported by the National Science Centre, Poland, grant UMO-2017/25/B/ST10/02329.