INTRODUCTION
Harvesting activities influence forest structure, composition, function and dynamics. Managed forests are often simplified ecosystems with fewer favourable habitats and resources for forest dwelling species (Bauhus et al. Reference Bauhus, Puettmann and Messier2009; Bollmann & Braunisch Reference Bollmann, Braunisch, Kraus and Krumm2013). In Europe, after centuries of logging and deforestation, primeval forests have almost completely disappeared (Bengtsson et al. Reference Bengtsson, Nilsson, Franc and Menozzi2000). Furthermore, unmanaged old-growth forests represent less than 1% of the current forested area (Parviainen Reference Parviainen2005). As a result, strict forest reserves are progressively being set up (Parviainen et al. Reference Parviainen, Bücking, Vandekerkhove, Schuck and Päivinen2000) to restore old-growth forest dynamics and enhance specialized forest biodiversity (Norton Reference Norton and Hunter1999). In western temperate Europe, however, these reserves are generally small – possibly too small – to meet these objectives (Meffe & Carrol Reference Meffe and Carrol1997; Norton Reference Norton and Hunter1999), especially for vertebrates such as bats and birds that require large territories to breed and forage (Loehle et al. Reference Loehle, Wigley, Rutzmoser, Gerwin, Keyser, Lancia, Reynolds, Thill, Weih, White and Wood2005), and to sustain viable populations. One solution advocated by some authors is to mimic old-growth forest attributes such as deadwood or large trees in managed forests (Bauhus et al. Reference Bauhus, Puettmann and Messier2009), but the success of such actions has, to date, rarely been assessed in terms of biodiversity on large datasets. To promote scientifically-based conservation measures in managed areas (Sutherland et al. Reference Sutherland, Pullin, Dolman and Knight2004), a better understanding of the link between biodiversity and forest composition and structure is necessary.
Despite the growing literature comparing managed and unmanaged forests, little work has been carried out in temperate regions. In their meta-analysis, Paillet et al. (Reference Paillet, Bergès, Hjälten, Odor, Avon, Bernhardt-Romermann, Bijlsma, De Bruyn, Fuhr, Grandin, Kanka, Lundin, Luque, Magura, Matesanz, Meszaros, Sebastia, Schmidt, Standovar, Tothmeresz, Uotila, Valladares, Vellak and Virtanen2010) reviewed 49 European papers dealing with the overall impact of forest management on total species richness in flora, fauna and fungi. They showed that (i) data on flora and arthropods (mostly saproxylic beetles) is abundant, while data on some other groups including bats, is scarce; that (ii) the response of bird species groups varied greatly among studies, probably due to factors other than management (for example, landscape features); and that (iii) studies were much more numerous in boreal than in temperate regions.
We therefore adopted a multi-scale approach to further investigate two taxonomic groups (bats and birds) that have shown unclear responses to forest management elsewhere. Birds and bats are highly mobile species that quickly respond to changes in their environment. They are influenced by landscape structures such as forest cover (Villard et al. Reference Villard, Kurtis Trzcinski and Merriam1999), stand age distribution within a given forest, and proximity to edges (McCollin Reference McCollin1998; Ansell et al. Reference Ansell, Edwards and Hamer2011), urban or aquatic areas (Barataud Reference Barataud2012 a), but they may also depend on specific forest features to nest and forage (Erickson & West Reference Erickson and West2003; Imbeau et al. Reference Imbeau, Drapeau and Mönkkönen2003; Zellweger et al. Reference Zellweger, Braunisch, Baltensweiler and Bollmann2013). Besides their degree of specialization to forest ecosystems, their trophic and nesting preferences, or their conservation status, may affect their response to forest management and to stand and landscape features.
In this study, we first explored the differences in bird and bat communities between managed and unmanaged stands. We then related these differences to various stand and landscape attributes reported to be influential. For birds, we hypothesized that (i) the response of total species richness varies with either forest management and landscape variables such as total forest cover (McCollin Reference McCollin1998; Ansell et al. Reference Ansell, Edwards and Hamer2011); that (ii) forest specialist species are more sensitive to local forest attributes than to landscape attributes; and that (iii) the reverse is true for more generalist species groups (Jokimäki & Huhta Reference Jokimäki and Huhta1996). Forest specialist bird richness is also expected to be higher in unmanaged than in managed forests (Gregory et al. Reference Gregory, Vorisek, Van Strien, Gmelig Meyling, Jiguet, Fornasari, Reif, Chylarecki and Burfield2007; Devictor et al. Reference Devictor, Julliard and Jiguet2008), while cavity-nesting species richness is more dependent on deadwood than on other forest attributes (Smith Reference Smith2007; Kroll et al. Reference Kroll, Lacki and Arnett2012). For bats, we hypothesized that (i) total richness increases with deadwood as they use it for roosting (Kroll et al. Reference Kroll, Lacki and Arnett2012) and (ii) edge-dwelling species richness increases at the vicinity of internal or external forest edges (Adams et al. Reference Adams, Law and French2009; Archaux et al. Reference Archaux, Tillon, Fauvel and Martin2013). In addition to these main hypotheses, the response of different ecological groups (notably feeding guilds), threatened species (according to red-list classification) and individual species was tested against the same set of variables in order to better understand the patterns at play and the conservation issues. Finally, by identifying the features that influence bird and bat communities, we aim to provide managers with sustainable forest management guidelines that better integrate biodiversity-friendly practices.
MATERIALS AND METHODS
Study sites and plot selection
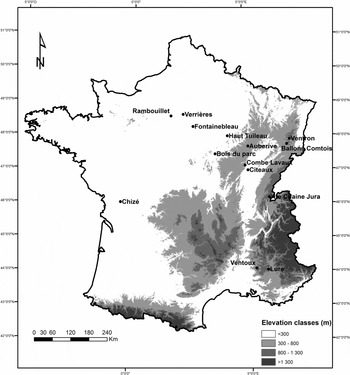
Our study was carried out in 14 French forests (Paillet et al. Reference Paillet, Pernot, Boulanger, Debaive, Fuhr, Gilg and Gosselin2015): nine lowland forests and five mountain forests for birds; and seven out of the nine lowland forests for bats (Fig. 1).

Figure 1 Location of the study sites. Each forest contained both managed and unmanaged areas. Bats were sampled in seven lowland forests only (elevation <800 m): Auberive, Chizé, Citeaux, Fontainebleau, Haut-Tuileau, Rambouillet and Verrières.
Each forest contained both managed stands and strict reserves where no trees had been harvested for 43.5 years on average (standard deviation [SD]: 37.1 years; Table 1). The mean total surface area of reserves was 678 ha (SD: 792 ha), but most of the time the reserved area was divided in smaller units (mean: 187 ha, SD: 254 ha; Table 1). Study stands were deliberately chosen to reflect native tree species composition only. They were dominated by beech (Fagus sylvatica) and oaks (Quercus robur and Q. petraea) in the lowlands; and beech, white fir (Abies alba) and Norway spruce (Picea abies) in the mountains.
Table 1 Characteristics of the sites used to compare birds and bats in managed and unmanaged French forests. MAN = Managed; NA: Data not available; SD: Standard deviation; UNM = Unmanaged.

In each lowland forest, plots were randomly located in unmanaged stands and in managed stands within 5 km of a reserve boundary (Table 1). For safety reasons, bat sampling was only performed in the lowland forests. Overall, 201 plots were selected for birds and 121 for bats (Table 1). The plots were drawn on a regular square 100x100 m grid in the managed forests surrounding the reserves. In the field, we controlled for site conditions in the unmanaged and managed plots within the same forest to avoid site condition biases. In the mountain forests, plot location was randomized only in the strict reserves and corresponding plots in the managed forest were specifically chosen to reflect similar site conditions (soil, elevation, aspect) and to avoid systematic biases (Paillet et al. Reference Paillet, Pernot, Boulanger, Debaive, Fuhr, Gilg and Gosselin2015).
Forest structure characterization
We characterized stand composition and quantified living and deadwood on each plot as fully described in Paillet et al. (Reference Paillet, Pernot, Boulanger, Debaive, Fuhr, Gilg and Gosselin2015). In addition, the cover of three different vegetation layers (height: 2–8 m, 8–16 m and above 16 m) was visually estimated within a radius of 18 m from the plot centre (1017.4 m2). To obtain a cumulative cover index for each plot, we summed the percentages of the three layers. As a result, in our analyses the cumulative cover index could be greater than 100%.
We calculated six stand structure variables for each plot: (i) total volume per hectare of living trees based on single-entry volume tables; (ii) total volume per hectare of dead trees; (iii) density (number per hectare) of living trees; (iv) density (number per hectare) of standing dead trees and snags; (v) living tree species richness per plot (trees with diameter at breast height >7.5 cm); and (vi) cumulative vegetation cover.
Landscape variables
Forest cover may positively influence forest birds and bats (Villard et al. Reference Villard, Kurtis Trzcinski and Merriam1999), while the vicinity of edges (either internal or external) or water bodies may facilitate the foraging activity of many bats (Adams et al. Reference Adams, Law and French2009; Barataud Reference Barataud2012 a; Archaux et al. Reference Archaux, Tillon, Fauvel and Martin2013). Using GIS (ESRI© ArcMap™ 10.0), we derived the following variables from the French National Geographic Institute's (IGN) BD Topo© map layers: (i) forest cover within a radius of 1000 m from each plot; distances between each plot and nearest (ii) paved or unpaved roads and (iii) water body. Internal edges included gaps (>300 m2) and roads or paths without canopy cover on aerial photos (IGN). In addition, distances to nearest external edges (ecotone between wooded areas and either urban or farmed area) were calculated using the CORINE Land Cover 2006 maps, grouping the following land cover types into wooded areas: deciduous, coniferous and mixed forests; sclerophyllous vegetation and forests; and shrub vegetation in mutation.
Bird and bat censuses
Birds were inventoried following the French Breeding Bird Survey protocol (Jiguet et al. Reference Jiguet, Devictor, Julliard and Couvet2012). Each plot was surveyed twice a year, in April–May for early nesters and in May–June for late breeders. Each count lasted 5 minutes and took place within 1–4 hours of sunrise. All birds seen or heard within 100 m of the plot centre were counted. Wetland and farmland birds (<0.5% of the birds recorded) were excluded from our analyses as their habitat preferences are likely to be independent of the structural and landscape features targeted in this study. We also excluded raptors (<1% of the birds recorded) for which the point count method is inappropriate.
Bats were recorded by their echolocation calls (heterodyne and time expansion). Pettersson D980 and D240x detectors were used, associated with portable Marantz PMD620 digital recorders. Unknown and unsure heterodyne signals were analysed with Batsound 3.31 software (Barataud Reference Barataud2012 a). For each species, bat activity was assessed in terms of number of contacts per minute. A contact was either a single signal or a short sequence of signals over a maximum duration of 5 seconds. Each bat count was carried out by a team of two experienced chiropterologists for 30 minutes, three times in April–May, June–July and August–September the year of the census. Recording occurred at sunset on nights with no rain or wind and with temperatures above 5°C, when bat activity was more intense. No recording occurred within 5 days of a full moon since moonlight can negatively impact the amount of signalling (Römer et al. Reference Römer, Lang and Hartbauer2010). Individuals that were only identified at genus level were not included in the analyses (this represented 130 occurrences in a total of 417 distributed over 121 plots).
Different trained ornithologists and chiropterologists participated in the bird and bat counts between 2009 and 2013, but all the plots in the same forest were sampled by the same person the same year (so that the observer effect is partly embedded in forest and year effect, but is not confounded with our main factors of interest).
Data were treated at three levels: total species richness; species richness per ecological and threatened species group; and the presence/absence (occurrence) of common bird and bat species. For occurrence analyses, we included species whose frequency in our dataset was between 15 and 90% (Supplementary Material, Table S1). We extended the more typical 20–80% frequency range (Verheyen et al. Reference Verheyen, Vellend, Van Calster, Peterken and Hermy2004) in order to include six bat species and two bird species whose frequency was either slightly below 20% or slightly above 80%. In addition, bird species that were represented in less than 15% of the total censuses but in more than 15% of the censuses in one of the two elevation classes (lowland or mountain) were also analysed but only for the corresponding elevation classes. This was the case for Coccothraustes coccothraustes, Streptopelia turtur, Dendrocopos medius and Oriolus oriolus in the lowlands and Periparus ater in the mountains (Supplementary Material, Table S1).
Bird species were classified into three ecological groups (Supplementary Material, Table S1) for which we expected contrasted responses based on habitat specialization, nesting site and diet as in Gregory et al. (Reference Gregory, Vorisek, Van Strien, Gmelig Meyling, Jiguet, Fornasari, Reif, Chylarecki and Burfield2007).
Bat species ecological groups were derived from Barataud (Reference Barataud2012 b) based on their hunting behaviour (gleaner species and edge species; Supplementary Material, Table S2). The ecological groups used for birds could not be fully extended to bats because (i) the information on habitat specialization for bats is very scarce; (ii) the bat species in our study breed either in tree (or artificial) cavities but not in foliage nor on the ground; and (iii) all are insectivores.
For both groups, ‘threatened species’ comprised extinct, critically endangered, vulnerable and near threatened species according to French national red-list classification (UICN France et al. 2011).
Statistical analyses
All data exploration and analyses were performed with R software version 2.15.2 (R Core Team Reference Core Team2012). Data exploration was conducted following the recommendations of Zuur et al. (Reference Zuur, Ieno and Elphick2010): we checked for the absence of outliers and the homogeneity of variance, collinearity and interactions between variables. In particular, collinear variables (R2>0.7) in our dataset were not included in the same models in the analyses. Thirteen explanatory variables were tested including management type (managed vs. unmanaged), elevation (lowland vs. mountain), six structural variables (total living tree volume and density, total deadwood volume, snag density, tree species richness and vegetation layer) and five landscape variables (forest cover within 1000 m, distances to the nearest internal and external edge, water body and road). We excluded the variable ‘time since last harvesting’ from our final analyses because data was not available for 12 plots (Table 1) and this would have led us to reduce our sample size. Including this variable did not improve our models in preliminary analyses (Supplementary Material, Table S3); therefore, we preferred to keep the original dataset and use management type as the main variable of anthropogenic pressure. Silvicultural treatment was also excluded, since it was biased by elevation: most of the uneven-aged forests were located in the mountains whereas the even-aged forests were all located in lowlands.
Patch occupancy and generalized linear mixed models both have advantages and disadvantages when analysing species community data. A number of studies evidenced that heterogeneity in detectability may lead to spurious conclusions (Archaux et al. Reference Archaux, Henry and Gimenez2012) and that detectability varies greatly among bird and bat species, and is due to many factors (for example habitat structure, sampling date and hour; Kéry & Schmidt Reference Kéry and Schmidt2008; Archaux et al. Reference Archaux, Tillon, Fauvel and Martin2013). To ensure that the results at the species level were not flawed by detection heterogeneity, we first applied patch occupancy models to analyse the effects of management type on detection probability (package unmarked, function occur; Fiske & Chandler Reference Fiske and Chandler2011). In such models, probability of occurrence is explained by an occupancy component (in our case, the intercept only) and a detection probability component (in our case, a function of management type). Preliminary analyses showed very limited detection bias on some bird species due to management type, while bat species were devoid of such bias (Supplementary Material, Table S4). Finally, we preferred generalized linear mixed models (GLMM; Bolker et al. Reference Bolker, Brooks, Clark, Geange, Poulsen, Stevens and White2009) over patch occupancy models as we assumed that the nested structure of our sampling design (plots nested within sites) was more important to take into account than observed detection probabilities. In addition, it is currently not possible to account for both random effects and detection probability in a frequentist approach. The potential problem has, however, not been overlooked and the results are discussed accordingly (Supplementary Material, Table S4).
To process the GLMMs, we used the lme4 package (function: glmer; Bates et al. Reference Bates, Maechler, Bolker and Walker2013). As plots from the same forests are more likely to be similar than plots from different forests, we incorporated ‘forest’ as a random effect to take this source of spatial auto-correlation into account. We used Poisson error distribution for count data (total and group richness) and binomial error distribution for species occurrence (presence/absence). An additional ‘plot’ random effect was systematically added on to the intercept for every model to take into account potential over-dispersion in the data.
As our sample was relatively small, we selected the best models based on Akaike Information Criteria corrected for small samples (AICc; Burnham et al. Reference Burnham, Anderson and Huyvaert2011). We did a forward stepwise variable selection, stopping the procedure when the model was not improved by at least two points in AICc by any additional variable (Zhong et al. Reference Zhong, Zhang, Zhu and Liu2012).
Finally, we completed this approach by similarity analyses (package vegan, function adonis with Bray-Curtis distances; Oksanen et al. Reference Oksanen, Blanchet, Kindt, Legendre, Minchin, O'Hara, Simpson, Solymos, Stevens and Wagner2015) and indicator species analyses (package indicspecies, function multipatt using Indval.g option; De Cáceres & Legendre Reference De Cáceres and Legendre2009) comparing managed and unmanaged forests for both groups.
RESULTS
General data structure
A total of 57 birds and 19 bat species were recorded in the study sites (Supplementary Material, Tables S1 and S2). Mean bird species richness per plot was 10.6 species, and ranged from 3 to 20. Mean bat species richness per plot was 3.5 species, and ranged from 0 to 13. The most commonly contacted species are listed in Supplementary Material, Tables S1 and S2.
For birds and bats richness analyses, all the selected models had AICc values at least two points lower than the null model except for tree foliage bird nesters and threatened and gleaner bats (Table 3). Patch occupancy modelling suggested these results were not flawed by detection heterogeneity (Supplementary Material, Table S4).
Table 2 Summary of the forest structure and landscape variables used in the analyses. Densities, volumes and species richness of living trees were calculated for individuals with a diameter at breast height greater than 7.5 cm.

Table 3 Results of the generalized linear mixed models with Poisson error distribution and forest and plot as random effects. Threatened species comprise the following red-list species categories: extinct, critically endangered, vulnerable and near-threatened. ***p < 0.001; **p < 0.01; *p < 0.05; (*)p < 0.1. AICc = Akaike Information Criterion corrected for small samples for the best and null models, and models with management as a single variable; MON = Mountain stands; ns = Non-significant result; SE = Standard error derived from the model; UNM = Unmanaged stands.

For occurrence analyses, the 22 most frequent bird species and the eight most frequent bat species were analysed (Table 4). Elevation significantly explained the variations of occurrences for seven species. There were higher occurrences in lowlands than in mountains for five species (Certhia brachydactyla, Cyanistes caeruleus, Parus major, Poecile palustris and Dendrocopos major) and conversely, lower occurrences for two species (Erithacus rubecula and Regulus ignicapillus). The null model performed better than all the other models tested for Fringilla coelebs and P. ater only.
Table 4 Presence/absence of species of bats and birds. Results of the generalized linear mixed models with Binomial error distribution and forest as random effect. ***p < 0.001; **p < 0.01; *p < 0.05; (*)p < 0.1. MON = Mountain stands; ns = Non-significant result; SE = standard error derived from the model; UNM = Unmanaged stands.

Globally, despite lower levels of significance, the magnitude of the effects for individual species was generally higher than for species groups (Table 4).
Effects of forest structure
Total bird richness increased significantly with total deadwood volume (Table 3) but the magnitude was low: an increase in deadwood from 0 to 40 m3 ha−1 corresponded to a mean increase of only 0.46 species per plot (+4.3%; Figure 2). Insectivorous and ground nester birds decreased significantly with increasing density of living trees: 0.53 and 0.54 fewer species between 0 and 500 stems, respectively.

Figure 2 Relationship between total species richness for birds and bats and total deadwood volume. The solid line represents the model and dashed lines the corresponding 95% confidence intervals. MAN = Managed plots; UNM = Unmanaged plots.
Total bat richness increased significantly with total deadwood volume but only by 0.33 species from 0 to 40 m3 ha−1 (+9.4%; Table 3 and Fig. 2). The same significant effect was detected for edge-species richness but with an even lower magnitude (0.16 species from 0 to 40 m3 ha−1).
Threatened bird species richness decreased with increasing tree species richness but not significantly (p = 0.07; Table 3).
For occurrence analyses, structural variables were selected in the best models as a single variable for three species (Garrulus glandarius, O. oriolus, Sylvia atricapilla) or coupled with other variables for six other species (C. caeruleus, D. medius, Phylloscopus sibilatrix, S. turtur, Troglodytes troglodytes and Turdus merula). However, the effect of structural variables was significant for only four out of these nine species: D. medius and T. troglodytes occurred more in stands with high volumes and low densities of living wood. T. merula occurred more in stands with high volumes of living trees whereas G. glandarius occurred less, but both showed higher detection probabilities in unmanaged forests (Supplementary Material, Table S4).
Structural variables were also the best predictors for four bat species but the effect was significant for only two: Nyctalus leisleri preferred stands with high tree densities and Pipistrellus pigmaeus occurred more in stands with a larger volume of deadwood.
Effects of management abandonment
Phytophagous and omnivorous birds were both significantly more numerous in unmanaged stands (0.20 and 0.72 more species, respectively). Similarly, species richness of cavity nesters was significantly higher in unmanaged stands (0.49 more species), with an additional negative effect of elevation.
Six bird species were significantly more frequent in unmanaged stands (C. brachydactyla, Columba palumbus, D. major, P. major, T. merula and Turdus philomelos), but significantly higher detection probabilities in unmanaged forests were detected for three of these species (Supplementary Material, Table S4).
Similarity analyses showed significant results with small explanatory power for both birds (R2 = 0.008, p = 0.004) and bats (R2 = 0.023, p = 0.008). Four bird species were significantly associated with managed forests (Luscinia megarhynchos, p = 0.03; Hippolais polyglotta, p = 0.03; Anthus trivialis, p = 0.02; and Phylloscopus bonelli, p = 0.04) and one with unmanaged forests (Columba oenas, p = 0.03). No bat species was associated with either managed or unmanaged forests.
Effects of landscape features
The richness of specialist forest birds increased significantly (p = 0.02) with the distance to the nearest external edge, but only by 0.36 species from 0 to 600 m inside the forest. The richness of gleaners was positively related to the distance to the nearest water body but not significantly (p = 0.08).
A total of eight bird species were influenced by landscape variables (either as a single parameter or combined with other variables; Table 4). The most frequently selected landscape variable was distance to the nearest road: P. major was significantly more frequent near roads whereas P. palustris showed the opposite trend. Distance to internal edge significantly influenced the occurrence of four species: (i) E. rubecula, P. sibilatrix and Turdus viscivorus all occurred more frequently away from internal edges; and (ii) Sitta europaea occurred significantly more often in forest cores.
For bats, landscape variables were selected for five species, but the effect was never significant.
DISCUSSION
The purpose of our study was to assess the relative importance of stand structure, management abandonment and landscape on birds and bats. We showed a clear effect of deadwood on total richness of bats but, otherwise, few of our hypotheses were verified. Both total richness of bats and birds increased with deadwood volume, while structural variables and management abandonment had a greater influence on ecological groups (guilds): out of nine ecological groups, five responded to structural variables and three to management abandonment. Individual species responded differently to environmental gradients and were more influenced by landscape features in combination with structural and management variables. However, the magnitude of the effects we detected was generally low for total species richness and ecological group richness, though it was higher at the individual species level. We did find a significant effect of elevation in some cases, but this is likely to be related to the different bio-geographical affinities of groups and species, and will not be discussed further here.
Deadwood and living tree quantities drive bird and bat species richness
Among the studied variables, deadwood was the main factor positively affecting total species richness for birds and bats, including edge bat species. However, we hypothesized that deadwood would be the best predictor for bat species richness only (Erickson & West Reference Erickson and West2003). Deadwood provides food, shelter and roosting sites for several bird (for example, woodpecker and tits) and most European forest bat species (Regnery et al. Reference Regnery, Couvet, Kubarek, Julien and Kerbiriou2013). Both over-mature and dead trees provide essential microhabitats (for example, cavities, cracks and coarse bark) where specialized species can nest and feed in forests (Laiolo et al. Reference Laiolo, Rolando and Valsania2004; Regnery et al. Reference Regnery, Couvet, Kubarek, Julien and Kerbiriou2013).
While the importance of deadwood is well-known for bird species nesting in cavities or primarily foraging on saproxylic insects (Zarnowitz & Manuwal Reference Zarnowitz and Manuwal1985), the fact that this effect extends to other ecological groups is more surprising (Laiolo et al. Reference Laiolo, Rolando and Valsania2004; Khanaposhtani et al. Reference Khanaposhtani, Kaboli, Karami and Etemad2012). The reason for this might be that the total amount of deadwood is associated with increasing stand maturity, which may in turn favour breeding bird density and richness (however, see the results obtained by Donald et al. Reference Donald, Fuller, Evans and Gough1998; Hobson & Bayne Reference Hobson and Bayne2000). However, the most surprising result related to deadwood in our study was its apparent lack of influence on cavity nesters, both at the group and species levels, even though our data set included two woodpeckers and six cavity nesting species. In our studied forests, deadwood may only be a limiting factor for species abundance, not for the overall diversity of the guild, and other factors not taken into account in this study (for example, densities of cavities) may play a role.
As density of living trees increased, the richness of insectivores and ground nesters decreased. Most ground nesting bird species such as Phylloscopus collybita or S. atricapilla, need the presence of a well-developed shrub and herbaceous vegetation to breed and forage (Fuller & Whittington Reference Fuller and Whittington1987). Forest trees compete with these two vegetation layers for light and water resources; thus, a high density of living trees is generally detrimental to lower-stratum vegetation and, as a consequence, to the birds that depend upon it. Assuming that the density of living trees is a proxy for canopy closure (mean vegetation cover; Table 2), we may also expect closed stands to limit the availability of insects through negative indirect effects on ground herbs and shrubs, thereby reducing bird densities and nesting success (Bakermans et al. Reference Bakermans, Rodewald and Vitz2012). At the species level, living trees (either in terms of density or volume) had contrasting effects, being positive for T. merula but detrimental to G. glandarius.
Among bats, we expected gleaner species to be influenced by the vertical structure of living trees for they hunt within the canopy or close to the ground (Dietz et al. Reference Dietz, Von Helversen and Nill2009) but this hypothesis was not confirmed by our analyses. We also expected edge species to be associated with the proximity of internal or external edges, but instead, their richness actually increased with the total amount of deadwood. One possible explanation is that, at the stand scale, decaying trees create temporary gaps in the canopy. For instance, the foraging activity of Myotis species has been experimentally shown to be higher in open or semi-open canopy conditions where they hunt more efficiently (Brigham et al. Reference Brigham, Grindal, Firman and Morissette1997), than for Pipistrellus and nyctaloids species (Müller et al. Reference Müller, Brandl, Buchner, Pretzsch, Seifert, Strätz, Veith and Fenton2013). Furthermore, bats may be more easily detected in more open forest: indeed, dense foliage reduces the chances of detection from the ground when intercepting calls of all species (Kalcounis et al. Reference Kalcounis, Hobson, Brigham and Hecker1999; Menzel et al. Reference Menzel, Menzel, Kilgo, Ford, Edwards and McCracken2005; Adams et al. Reference Adams, Law and French2009). Archaux et al. (Reference Archaux, Tillon, Fauvel and Martin2013) revealed a similar problem with the detection probability of most edge species. However, in our case, no noticeable detectability bias linked with management type was observed for bats (Supplementary Material, Table S4). Finally, the positive role of deadwood was only weakly supported by the analyses at the species level. Indeed, only P. pygmaeus preferred stands with larger amounts of deadwood, whereas N. leisleri was positively influenced by the density of living trees. None of the other species showed a clear pattern. In any case, the observed correlation with deadwood volumes could not be solely explained by the fact that bats may feed on saproxylic insects or deadwood dependent moths, as their abundance may be too scarce for opportunistic foragers such as bats (Dodd et al. Reference Dodd, Lacki, Britzke, Buehler, Keyser, Larkin, Rodewald, Wigley, Wood and Rieske2012).
Management abandonment favours most bird ecological groups
Management abandonment enhanced the richness of three ecological groups of birds (phytophages, omnivores and hole nesters) as well as the occurrence of six individual species (Table 4 and Supplementary Material, Table S4). In addition, C. oenas was significantly associated with unmanaged forests. The fact that the final models included management instead of single structural stand variables such as deadwood, suggests that either stand suitability depends on a combination of factors not revealed in our analyses, or that we failed to test the appropriate factor (Laiolo et al. Reference Laiolo, Rolando and Valsania2004). In particular for cavity nesters (apart from C. oenas), the presence of deadwood is not the only driver. Indeed, unmanaged stands may not only provide more favourable habitats and richer resources, but also less human disturbance from harvesting or leisure activities that may benefit bird species (Hagar et al. Reference Hagar, McComb and Emmingham1996; Riffell et al. Reference Riffell, Gutzwiller and Anderson1996). Interestingly, total species richness was not higher in unmanaged stands – a result previously found by Paillet et al. (Reference Paillet, Bergès, Hjälten, Odor, Avon, Bernhardt-Romermann, Bijlsma, De Bruyn, Fuhr, Grandin, Kanka, Lundin, Luque, Magura, Matesanz, Meszaros, Sebastia, Schmidt, Standovar, Tothmeresz, Uotila, Valladares, Vellak and Virtanen2010) – nor was total richness influenced by landscape variables as we had hypothesized. Finally, the positive effect of abandonment on phytophagous and omnivorous species is very surprising as these rather generalist species are known to adapt to a large array of trophic situations. In the reserves, they may benefit from a more favourable combination of resources and sites that increase their richness.
Despite clear structural differences between managed and unmanaged forests in our study (Paillet et al. Reference Paillet, Pernot, Boulanger, Debaive, Fuhr, Gilg and Gosselin2015), the magnitude of the differences in bird diversities remained weak for all groups. One explanation might be that the species have not yet had time to re-colonize the favourable niches available in the forest reserves. In other words, colonization credit may still exist for these species (Hanski Reference Hanski2000). However, birds’ good dispersal ability and relatively high growth rate make this hypothesis implausible for the time scale considered in our study. A second reason may be that management abandonment is too recent for the stands to have recovered old-growth forest characteristics and natural processes (Paillet et al. Reference Paillet, Bergès, Hjälten, Odor, Avon, Bernhardt-Romermann, Bijlsma, De Bruyn, Fuhr, Grandin, Kanka, Lundin, Luque, Magura, Matesanz, Meszaros, Sebastia, Schmidt, Standovar, Tothmeresz, Uotila, Valladares, Vellak and Virtanen2010). This was partially confirmed by the absence of result on the short gradient of time since the last harvesting we observed (Supplementary Material, Table S4). Indeed, many of the reserves studied may still bear the marks of past management practices and thus may still be very similar to their managed counterparts (Humes et al. Reference Humes, Hayes and Collopy1999; Ansell et al. Reference Ansell, Edwards and Hamer2011). This may be true despite the clear distinction in terms of deadwood attributes (three times more deadwood in forest reserves; Table 2). Finally, the reserves may be too small to have a significant effect on bird populations, whose territories are generally similar in size or even larger than the reserves; the benefits of a reserve could hence be diluted by nearby logging practices.
Landscape features have little influence on birds and bats
The landscape variables we tested had very limited influence on birds and bats at the community or group levels. Forest specialist birds showed higher richness in the forest interior than near the forest edges, but, contrary to our hypothesis, were not influenced by forest management. This suggests that our forest specialist group includes a number of forest edge-sensitive or interior forest birds (Germaine et al. Reference Germaine, Vessey and Capen1997). Yet among the forest specialist species, only S. europaea clearly avoided external edges. Forest birds probably prefer the forest core due to more favourable resource availability, microclimatic features, vegetation structure and lower disturbance levels (McCollin Reference McCollin1998). Our results also show that internal edges, which encompass a large array of types (canopy gaps, roads and clearcuts), seem to be detrimental to some forest specialists (P. palustris and P. sibilatrix) as well as to certain non-specialist species (E. rubecula and T. viscivorus). In particular, among the different types of edges we tested, roads only had a negative influence at the species level. More generally, it should also be noted that in the managed forest landscapes we studied, logging and roads caused a perforated, rather than a truly fragmented landscape (Laiolo et al. Reference Laiolo, Rolando and Valsania2004). This may partly explain why landscape features were not the main drivers of the communities we studied, contrary to the results obtained in numerous earlier studies (Devictor et al. Reference Devictor, Julliard and Jiguet2008).
CONCLUSIONS AND IMPLICATIONS FOR FOREST MANAGEMENT AND CONSERVATION
Our results showed a positive correlation between deadwood and forest dwelling bird and bat richness. However, the magnitude of this effect was low, as had already been demonstrated for saproxylic beetles and fungi in temperate forests (Lassauce et al. Reference Lassauce, Paillet, Jactel and Bouget2011). As the forest reserves we studied were relatively small, their effects on bird and bat communities may be diluted in the matrix of managed stands, especially for mobile species. Yet, large volumes of deadwood significantly – but slightly – improved species richness for both groups. In France, such large volumes can only be found in strict forest reserves where management has been abandoned for a long time (Paillet et al. Reference Paillet, Pernot, Boulanger, Debaive, Fuhr, Gilg and Gosselin2015). At the ecological group level, management abandonment was the main positive factor influencing several groups of birds; this further emphasizes the importance of setting aside forest reserves. Despite their relatively small size and recent management abandonment, the reserves we studied may play an important role in the conservation of certain ecological groups or even species, in particular specialized taxa such as cavity-nesting birds. Finally, the response to a given ecological gradient of species belonging to the same ecological group varied widely and showed strong, yet often noisy, responses to structure and landscape variables. Landscape patterns played stronger roles for species than for species groups or for the entire community. This emphasizes the limits of using ecological groups to predict species response and the need for larger datasets to precisely estimate species-level responses.
In terms of conservation and biodiversity-oriented integrated forest management, our results could help managers to adapt their practices to the target species. For example, if the local objective is to increase forest bird or bat populations in general, enhancing the levels of deadwood in managed areas in addition to setting aside strict forest reserves seems to be a valuable strategy, but threshold values remain to be defined. If the objective is to preserve a particular ecological group or species, such a strategy must be refined and adapted to the requirements of the group or the species. In particular, active habitat tree management may be a complementary measure to deadwood promotion (Bütler et al. Reference Bütler, Lachat, Larrieu, Paillet, Kraus and Krumm2013). Finally, tree species diversity does not seem to be as crucial as claimed in earlier studies (Donald et al. Reference Donald, Fuller, Evans and Gough1998; Zhang et al. Reference Zhang, Kissling and He2013), at least in our context where native tree species dominated.
Our findings may help managers use sound scientific knowledge in addition to their own field expertise to better orient their biodiversity-friendly practices. Such an approach could also be developed for red-listed species or species targeted by specific conservation measures, for which local structural features, management effects and landscape patterns could be integrated in multi-scale analyses. However, the biodiversity data required for such analyses remain difficult to gather and only long-term research and monitoring will help answer such complex conservation issues.
ACKNOWLEDGEMENTS
We are indebted to the many ornithologists and chiropterologists involved in the project. Without their implication, no data would have been available for this research. We thank A. Perthuis (Office National des Forêts; ONF), D. Barré (ONF), I. Bassi (ONF), J. Bernard (ONF), S. Coulette (RNN Ballons Comtois), T. Darnis (ONF), B. Devaux (ONF), C. Druesne (RNN Ventron), B. Fauvel (ONF), T. Freund (ONF), V. Godreau (ONF), J. L'Huillier (ONF), F. Malgouyres (ONF), C. Marck (ONF), P. Millarakis (ONF), J. Rosset (RNN Haute Chaine du Jura) and R. Truckenwald (ONF). We are grateful to B. Fritsch (RNN Bois du Parc), R. Lecomte (RNN Chalmessin) and L. Servières (RNN Combe-Lavaux) for organizing the field work. We also thank A. Villemey for careful review and constructive comments and V. Moore for polishing the language of this paper. This research was funded by the French Ministry in charge of Ecology (Convention Cemagref-DEB [MEEDDAT], Action GNB and the program “Biodiversité, Gestion Forestière et Politiques Publiques” [BGF], convention GNB 10-MBGD-BGF-1-CVS-092, no CHORUS 2100 214 651) and the Office National des Forêts (Convention ONF-Cemagref, Action 5, 2008).
Supplementary Material
To view supplementary material for this article, please visit http://dx.doi.org/10.1017/S0376892915000363