Introduction
Understanding and managing contaminated sites in Antarctica
The potential for anthropogenic disturbance and pollution is particularly acute in Antarctica, where natural environmental stresses and isolation make the marine and terrestrial fauna more sensitive to environmental contamination (e.g. Stark et al. Reference Stark, Gardner, Snape and McIvor2003a, Reference Stark, Riddle, Snape and Scouller2003b). The problem of anthropogenic contamination of sites in Antarctica has been the focus of research and policy development by Antarctic Treaty nations for some time (e.g. COMNAP 2007, Tin et al. Reference Tin, Fleming, Hughes, Ainley, Convey, Moreno, Pfeiffer, Scott and Snape2009). The assessment, remediation and monitoring of contaminated sites is necessary to ensure the preservation of biodiversity, environmental and aesthetic values of Antarctica. Contaminated sites are typically associated with waste disposal, storage and abandoned station sites (Deprez et al. Reference Deprez, Arens and Locher1999, Gore et al. Reference Gore, Revill and Guille1999, Snape et al. Reference Snape, Riddle, Stark, Cole, King, Duquesne and Gore2001a, Reference Snape, Scouller, Stark, Stark, Riddle and Gore2004, Townsend & Snape Reference Townsend and Snape2002, Scouller et al. Reference Scouller, Snape, Stark and Gore2006, Fryirs et al. Reference Fryirs, Snape and Babicka2013). Although waste management in the modern era includes treatment on-station or removal from Antarctica (e.g. Return to Australia (RTA)), significant sites of ‘legacy’ waste remain from a time when waste removal was not mandatory or practicable (Bargagli Reference Bargagli2008, Stark et al. Reference Stark, Snape, Graham, Brennan and Gore2008, Tin et al. Reference Tin, Fleming, Hughes, Ainley, Convey, Moreno, Pfeiffer, Scott and Snape2009, Fryirs et al. Reference Fryirs, Snape and Babicka2013).
The evaluation, monitoring and remediation of contaminated sites in Antarctica are carried out in accordance with the mandate outlined in the Antarctic Treaty and Annex I (Environmental Impact Assessment) and Annex III (Waste Disposal and Waste Management) to the Protocol of Environmental Protection to the Antarctic Treaty (1991), known as the Madrid Protocol. Article 1(5) establishes the obligation that: ‘Past and present waste disposal sites on land and abandoned work sites of Antarctic activities shall be cleaned up by the generator of such wastes and the user of such sites. This obligation shall not be interpreted as requiring: a) the removal of any structure designated as a historic site or monument, or b) the removal of any structure or waste material in circumstances where the removal by any practical option would result in greater adverse environmental impact than leaving the structure or waste material in its existing location’. The Madrid Protocol provides the policy platform, directing the identification of sites of concern, and the subsequent assessment, remediation and monitoring of these sites. Wilkes Station in East Antarctica is highlighted as a site of concern, and this paper reports a contaminated site assessment undertaken in the 2009–10 summer.
Location, geology and history of Wilkes Station
Wilkes Station is on Clark Peninsula (66°15'25.6"S, 110°31'32.2"E) in the Windmill Islands, East Antarctica (Fig. 1). It is c. 3 km north of Casey Station across Newcomb Bay. Clark Peninsula is dominated by mafic and ultramafic rocks with small areas of granite gneiss in the west (Paul et al. Reference Paul, Stuwe, Teasdale and Worley1995). Pre-deformational mafic rocks include amphibolites composed of varying proportions of hornblende and pyroxene-hornblende granulites.

Fig. 1 Location of Wilkes Station in East Antarctica.
The first human occupation on Windmill Islands was at Wilkes Station, established by the USA in 1957–58 as part of the International Geophysical Year. The primary aim of its construction was to provide a strategically located base in East Antarctica from which scientific research and exploration could be conducted. During its construction over 11 000 tonnes of supplies were landed including building materials, fuel and scientific equipment (McMahon Reference McMahon1967).
In February 1959, operational and administrative control of the station was transferred to Australia. As part of the handover, the Australian Government accepted custody of the equipment and installations at Wilkes Station without charge or liability (ADEF 1959). The property would be returned, upon mutual agreement, to the custody of the US in the future (ADEF 1959).
During its 10 years as an operational station, minor alterations and additions to existing buildings occurred. In total, around 45 buildings comprise the old Wilkes Station site to the north-west of waypoint W-08 (Figs 2 & 3). A fuel farm and landfill were established adjacent to the main landing site on Newcomb Bay and are noted on the 1967 air photographs. Additional building and fuel supplies were unloaded at Wilkes until 1969. Station records and reports indicate that surplus supplies shipped into Wilkes were not moved from their landing positions and became covered in snow (Clark & Wishart Reference Clark and Wishart1989). Wilkes Station was abandoned in favour of Casey Station in 1969, with much of the equipment, fuel and buildings left in situ.

Fig. 2 Layout of Wilkes Station buildings as of 1967 (Wilkes Development Plan). Photograph: K. Fryirs.

Fig. 3 The distribution of sediment and water sampling sites relative to waste across four zones on Clark Peninsula. Runoff flow paths observed during the 2009–10 summer are also shown.
Policy on Wilkes Station preservation and clean up
Wilkes Station is not on the list of Historical Sites and Monuments approved by the Antarctic Treaty Consultative Meeting (ATCM). However, Wilkes Station does have local value to the USA and Australia who spent time at the station, and to expeditioners who visit the site to view the remains (www.wilkesstationhistory.com). As such, Wilkes Station is listed as an ‘indicative place’ on the Register of the National Estate of the Australian Heritage Commission (AHC 2011). This raises significant questions about the heritage status and value of the site, and the protocols relevant to protection, clean up and waste treatment operations at Wilkes Station (Camenzuli et al. Reference Camenzuli, Fryirs, Gore and Freidman2014). Although Wilkes is not listed as a historical site, guidelines exist for interim protection of pre-1958 sites to provide time for relevant Parties to consider their inclusion in the protection system under Annex V to the Protocol on Environmental Protection (SCAR 2002).
There was sporadic clean up from after the station was abandoned until 1987 when a more formal policy was adopted. In response to growing concerns over the environmental impact and preservation of historically significant buildings at the Wilkes Station site, the Australian Antarctic Division (AAD) and the Antarctic Historical Sites and Monuments Advisory Committee (AHSMAC) proposed a phased clean up in accordance with the ATCM in 1987 (Anon 1994). It suggested that only hazardous or environmentally unacceptable items be removed and recommended limited clean up. These operations occurred from 1969–94. Australia’s adoption of the Madrid Protocol in 1991 meant the AAD became obliged to clean up all wastes generated by past and present activities. Given the uncertainty of Wilkes’ heritage status, and risks posed to human health and the environment, ‘clean ups’ since 2007 have been limited to ‘opportunistic pick up of windblown debris’ under AAD policy (AAD 2010).
The types of potential contaminants on Clark Peninsula are highly varied, ranging from chemically inert rubbish to hazardous substances left over from the occupation of the station (Fryirs et al. Reference Fryirs, Snape and Babicka2013). The volume of waste at Wilkes’ landfill site alone is c. 20 000 m3, and 538 sites with one or more pieces of waste are strewn over an area of 1.5 x 1.0 km (Fryirs et al. Reference Fryirs, Snape and Babicka2013). Much waste remains buried under ice, yet to be recorded, some of which may be historically significant.
Recent evidence suggests that meltwater from sites at Wilkes flowing into the marine environment contains heavy metals and petroleum hydrocarbons at concentrations well in excess of the Australian and New Zealand (ANZECC) guidelines for fresh and marine water quality (ANZECC 2000, Snape et al. Reference Snape, Riddle, Stark, Cole, King, Duquesne and Gore2001a, Stark et al. Reference Stark, Gardner, Snape and McIvor2003a, Scouller et al. Reference Scouller, Snape, Stark and Gore2006, Townsend & Snape Reference Townsend and Snape2008). Immediately east of the station site is an Antarctic Specially Protected Area (ASPA No. 136), established for the protection and study of mosses and lichens, which also contains an Adélie penguin (Pygoscelis adeliae (Hombron & Jacquinot)) colony and breeding grounds of Wilson’s storm petrel (Oceanites oceanicus (Kühl)), south polar skua (Catharacta maccormicki Saunders) and snow petrel (Pagodroma nivea Forster) (ATCM 2009). These animals are frequently spotted foraging in or traversing through the waste at Wilkes, exposing them to heavy metals and other hazardous substances.
Although several AAD reports from the 1980s recognise that there are contaminated sites at Wilkes, there had been no systematic attempt to establish the degree and extent of terrestrial contamination in sediment and meltwaters. Such information is necessary for the development of strategies for the systematic clean up and preservation of the Wilkes site (Fryirs et al. Reference Fryirs, Snape and Babicka2013).
Methods
Field methods
To quantify the concentration of metal and metalloid contaminants across Clark Peninsula, sampling sites were chosen where waste material has previously been identified and classified (Fryirs et al. Reference Fryirs, Snape and Babicka2013). Four main zones were identified: remembrance ridge, fuel farm, ‘Wilkes Hilton’ and old station (Fig. 3). In each zone, sediment and water samples were collected between 18–22 January 2010 at sites of visible waste and contamination. All samples were collected adjacent to waste materials including fuel drums, battery packs, scrap metal (e.g. machinery), plastics, buildings and other construction waste (Fryirs et al. Reference Fryirs, Snape and Babicka2013). This sampling strategy provides a systematic assessment of contamination across all four zones of Clark Peninsula.
For the analysis of metals and metalloids (hereafter referred to collectively as ‘metals’), 67 sediment samples and 93 water samples were collected across all four zones. All sediment samples were exposed (i.e. not covered in snow or ice), sampled with a plastic trowel, double bagged in zip-lock bags and stored at 4°C for return to Australia. Water samples were collected from meltwater around buildings, in flowing streams and in ponds using plastic syringes. Samples were filtered through a 0.45 µm cellulose acetate-membrane (Sartorius and Cole-Parmer, 47 mm diameter cartridge) at the sampling site and stored in a 50 ml cylindrical polypropylene sample vial (Sarstedt and Cole-Parmer). Samples were preserved with analytical grade concentrated HNO3 (at 1% v/v, pH<2) and stored at 4°C for return to Australia.
Twenty-seven sediment and 18 water samples were collected for analysis of petroleum hydrocarbons. Sites were selected where there was visible oil staining of soil, a sheen on ponded water or an odour present. These sites were concentrated in the fuel farm and old station zones. Water samples were collected in hexane-washed amber glass bottles and frozen for return to Australia. Sediment samples were collected in plastic sample bags, double bagged and frozen for return to Australia.
For metals analysis, eight background water and five background sediment samples were collected from a meltwater stream and adjacent ridge on the downstream side of ASPA No. 136 (Fig. 3). This site was accessed by foot and is 1 km from the landfill site, 1.5 km from the ‘Wilkes Hilton’ hut and 600 m from the nearest route and waypoint. The site is typical of the geology and topography of Clark Peninsula.
Analytical methods and quality control: metals in sediment and water
Sediment samples for metals analysis were oven dried for 24 hours at 105°C, then sieved to <2 mm to remove the gravel fraction. The fraction <2 mm is most appropriate for metals analysis as it gives a realistic estimate of metals in whole sediment and not just in a concentrated fine fraction such as <63 μm (ANZECC 2000, Stark et al. Reference Stark, Gardner, Snape and McIvor2003a). Twenty grams of the <2 mm fraction was milled for 90 seconds in a Retsch MM301 mill with tungsten carbide pots. Between each sample the mill was cleaned with acid-washed quartz sand and ethanol. Nine grams of powdered sample was well mixed with 1 g of Licowax (C38H76O2N2) binder. This sample was pressed at 60 kN for 45 seconds using a Herzog press.
Samples were analysed in a vacuum using a PANalytical Epsilon 5 cartesian geometry energy dispersive x-ray fluorescence spectrometer (XRF), with a dual anode W/Sc tube, and six measurement conditions. Measurements were made in triplicate and averaged for each site. For elemental quantification, ‘Auto Quantify’, PANalytical’s automated qualitative spectrum analysis was used combined with a fundamental parameters model. All data are reported as elements and the analytical sum was set to 100%. The following elements are reported: Ag, As, Cr, Cu, Fe, Hg, Mn, Ni, Pb, Sb, Sn and Zn. The accuracy and precision of the XRF calibrations were assessed using four United States Geological Survey (USGS) certified reference materials (CRM). Over the analytical period each CRM was analysed six or seven times. In addition, three samples were used as replicates, each being analysed up to five times across separate runs. The certified values for the CRM were achieved 100±6.6% for ten metals, indicating long-term stability of the instrument. Better accuracy was achieved for Cr, Mn, Fe and Ni. Zinc had a±6.6% upper limit and Pb±7.8%. The poorest accuracy was obtained for As and Ag (±20%), analytical performance was limited by low concentrations, and the determination of As may have been affected by spectral overlap with Pb. Analytical precision was measured as the relative standard deviation (RSD) of sample replicates. Precision for the 12 elements in these sediment samples was <10% RSD with Cu, Fe, Mn, Sb, Sn, Zn and Pb performing better than Ni (10%). The poorest results were obtained for Cr (18%), As (20%) and Ag (35%) at their upper limits.
Water samples were analysed for 13 elements (Al, As, Cd, Cr, Cu, Fe, Mn, Ni, Pb, Sb, Se, Sn and Zn) by inductively coupled plasma atomic emission spectroscopy (ICP-AES) at the AAD within three months of collection. A Varian 720-ES instrument measured elements simultaneously using standard operating conditions recommended by the manufacturer for power, argon flow, and signal stabilization and delay times. A CsCl matrix modifier (0.75% w/v in 10% v/v nitric acid) spiked with 5 mg l-1 Y internal standard was mixed 1:1 with samples in-line prior to nebulization. Calibration was with standard solutions 0–20 mg l-1 (performed for a total of 28 elements). The method detection limit (MDL) was calculated at the 99% confidence level from replicate measurements of a 20 µg l-1 quality control (QC) standard and ranged from 0.2–5 µg l-1 (mean 2±2 µg l-1), with the exception of Se (14 µg l-1),
To monitor accuracy, QC standards covering the calibration range were measured routinely throughout the analysis, most regularly at 20 µg l-1 and 10 mg l-1. This indicated acceptable accuracy, e.g. 103–104% recovery of elements at 10 mg l-1 but (typically) greater bias in the Al result (88%). Excellent recovery of analytes (100–105%, but Al only 73%) was also achieved for a water CRM with metal concentrations 0.2–1.6 mg l-1 (Inorganic Ventures, Z-QCP07046). Analytical precision was measured as the RSD of sample duplicates and QC replicates. Over most of the calibration range this was typically 0.1–1% RSD, increasing at low concentrations approaching the MDL (e.g. for the 20 µg l-1 QC sample, 0.3–11% RSD for all elements, except Se at 26%).
Analytical methods and quality control: total petroleum hydrocarbons in sediment and water
Hydrocarbons were extracted from sediment and water samples using chromatography-grade hexane and dichloromethane (DCM), respectively. For sediments, a 12 g sub-sample of homogenized wet material was placed into a 40 ml glass headspace vial, mixed with 10 ml of deionized water, 10 ml of hexane, and 1 ml of an internal standard hexane solution, and tumbled overnight. Samples were then centrifuged for 10 minutes at 1000 rpm. Following removal of the hexane extract, sediment remaining in the vial was dried at 105°C for 24 hours and weighed to determine the dry matter fraction. Water samples of volume 180–190 ml were extracted directly in the sample bottle by shaking for 1 minute following addition of 4 ml of DCM and 100 µl of an internal standard DCM solution. The internal standard solutions contained 1,4-dichlorobenzene,p-terphenyl and deuterated tetracosane (C24D50) at 50 mg l-1, and bromoeicosane and cyclooctane at 250 mg l-1.
Extracts were analysed for total petroleum hydrocarbons (TPH) by gas chromatography using flame ionization detection (GC-FID; Agilent 6890 N with a split/splitless injector) and an auto-sampler (Agilent 7683 ALS). Separation was achieved over 26 minutes using a SGE BP1 column (25 m x 0.22 mm ID, 0.25 µm film thickness). One µl (sediment samples) or 4 µl (water samples) of extract was injected into a pulsed split flow (ratio 1:15 or 1:5 for sediment and water extracts, respectively) at 310°C and 30 psi of helium carrier gas. After 1.3 minutes, the carrier gas pressure was adjusted to maintain constant flow at 1.3 ml min-1 for 17 minutes; flow was then accelerated (0.25 ml min-2) to 3.0 ml min-1, and held constant for 7 minutes. Oven temperature was started at 50/36°C (sediment/water), held for 3 minutes, then ramped (18°C min-1) to 320°C and held constant for 7 minutes. Detector temperature was 330°C.
Processing of chromatograms was performed using MATLAB. The QC of retention times for hydrocarbon compounds was achieved using in-house standards and the Florida TRPH CRM (Restek). Hydrocarbon concentrations were quantified using a calibration curve generated from standard solutions of Special Antarctic Blend (SAB; a dewaxed diesel) and standard diesel fuel. The TPH level was measured using the ratio of the total detector response of all hydrocarbons to the internal standard peak response.
Analysis of results
Assessment of metal contamination in sediment and water was carried out using the ANZECC guidelines for fresh and marine water quality (ANZECC 2000). These provide a proxy for Antarctic ecotoxicology-based contamination guidelines, which are, with very few exceptions, non-existent. Sediment samples were compared to the ANZECC interim sediment quality guidelines, which provide a lower trigger level value (ISQG-Low) and an upper guideline concentration value (ISQG-High) for each element. These guidelines state that for ecosystems considered of high conservation value, a precautionary approach should be adopted. In these ecosystems, chemicals originating from human activities should be undetectable, and naturally occurring toxicants (e.g. metals) should not exceed background sediment concentrations. For the latter, a conservative approach has been adopted whereby only those sites that sit below the ISQG-Low value for any given contaminant are considered uncontaminated, while sites above the ISQG-High value are noted as significantly contaminated (potentially initiating remedial action). Sites that are within the range between ISQG-Low and ISQG-High are considered to show signs of contamination and should be assessed further against the background concentration levels, or control limits (BCL).
Water samples were compared to the ANZECC guidelines for freshwater trigger values for toxicants which provide protection to 99% of species (ANZECC 2000). This high level of protection was chosen due to the high conservation value of the Antarctic environment.
Petroleum hydrocarbons in sediment were compared to guidelines derived from ecological screening levels (ESL) set in Schedule B1: guideline on investigation levels for soil and groundwater to the National Environmental Protection (Assessment of Site Contamination) Measure (NEPM (ASC)) 1999 (NEPC 1999). The ESLs for coarse to fine textured soil located in areas of ecological significance or (where the former are unavailable) urban residential and public open spaces have been used. The ESLs are assigned to four specific hydrocarbon size-fractions and these have been aligned as closely as possible to the TPH fractions reported. For hydrocarbons in water samples, a guideline value of 10–100 μg l-1 for TPH has been adopted based on ANZECC recommendations and as used by Stark et al. (Reference Stark, Gardner, Snape and McIvor2003a). This is considered a low reliability trigger level by ANZECC.
The BCL for contaminants in sediment and water were calculated as described in the ANZECC guidelines, following the procedure in Stark et al. (Reference Stark, Gardner, Snape and McIvor2003a). These were evaluated from sediment and water samples collected in an undisturbed location on Clark Peninsula. The BCL is derived from the mean concentration value determined for the background samples and incorporates the variance in the data (i.e. BCL=mean concentration value+2s, where s=standard deviation). Where the measured value in the background sample is lower than the MDL, BCL=MDL. Therefore, the BCL represents a site-specific investigation or decision level that accounts for local geology and other environmental factors for use in combination with the ANZECC guidelines. This approach also allows the assessment of elements for which there are no ANZECC guidelines available (e.g. Fe, Mn and Sn in sediments). Five sediment and eight water samples were taken to calculate BCLs. For each element of interest, the concentration at 2 x BCL, 5 x BCL and 10 x BCL are calculated. Those sites with concentrations <2 x BCL are considered marginally elevated and within the limits of natural geochemical variability, while those with concentrations 2–10 x BCL are considered significantly elevated and attributable to anthropogenic contamination (Stark et al. Reference Stark, Gardner, Snape and McIvor2003a).
Results
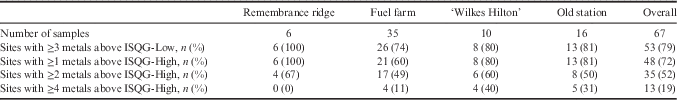
Contamination of sediment by metals
All 67 sites had at least one metal at a concentration between ISQG-Low and ISQG-High (Table I). Moreover, 72% of sites were contaminated with at least one metal exceeding the ISQG-High or 2 x BCL (for other elements of interest, i.e. Mn, Fe, Sn) (Table II), 52% of sites were contaminated with two or more metals, and 19% with four or more. Furthermore, 79% of all sites contained at least three metals above ISQG-Low (and sometimes exceeding ISQG-High). This suggests a significant degree of contamination across a large range of sites.
Table I Sites with sediments contaminated by metals and metalloids above the upper and lower ISQG trigger levels in the ANZECC guidelines.

Table II Summary of results for sediments (n=67) contaminated with metals and metalloids relative to ANZECC guidelines. Data presented as mg kg-1 except where noted.

* No ANZECC guidelines available, comparison to background concentration level only; n/a=not applicable.
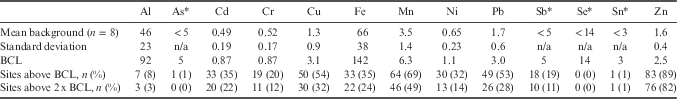
The results for each element across the sites are shown in Fig. 4. The ISQG-Low and ISQG-High values are indicated, as well as the 2 x BCL (which are also plotted). The 2 x BCL typically falls either within or just above the ANZECC range. For the elements where no ANZECC guidelines are defined (Fe, Mn and Sn), only the 2 x BCL value is shown. The concentrations of some metals were below the detection limit in the background samples (i.e. As, Sb, Hg and Sn) thus the 2 x MDL is shown. These elements, if detected in samples, are probably anthropogenic in origin at Wilkes.

Fig. 4 Results for sediments contaminated with various metals and metalloids relative to the ANZECC guidelines and background concentration level (BCL), and sorted according to location/zone.
On the basis of the number of sites exceeding the ISQG-High values, metals of importance at Wilkes can be listed in the following order (Table II):
 $${\rm Pb}\,\gt\, {\rm Ni}\,\gt\, {\rm Ag}\,\gt\, {\rm Cr}\approx{\rm Sb}\,\gt\, {\rm Zn}\,\gt\, {\rm Cu}\approx{\rm Hg}\,\gt\, {\rm As}.$$
When compared to BCLs and with the inclusion of other elements of interest, the metals that were found at concentrations >2 x BCL at the highest number of contaminated sites were (Table III):
 $${\rm Pb}\approx{\rm Zn}\approx{\rm Cu}\,\gt\, {\rm Fe}\,\gt\, {\rm Sn}\,\gt\, {\rm Cr}\,\gt\, {\rm Sb}\,\gt\, {\rm Cr}\,\gt\, {\rm Ni}\,\gt\, {\rm As}\,\gt\, {\rm Hg}.$$
Across the four zones, remembrance ridge contained the highest percentage of sites contaminated with one or more metals above ISQG-High, although only six sites were sampled (Table II). Of more significance are the levels of contamination around ‘Wilkes Hilton’ and within the old station zones. Immediately adjacent to ‘Wilkes Hilton’, 80% of sediment samples were contaminated with one or more metals and 40% of sites had four or more metals above ISQG-High values. Although the fuel farm has a lower proportion of contaminated sites than the other zones, most effort was concentrated in the sampling here with more than double the number of samples taken in this area relative to the others. The levels of contamination here were also high with 60% of sites containing at least one contaminant above the ISQG-High value. Overall, seven sites were heavily contaminated, containing five or more metals above ISQG-High values or 2 x BCL for other elements of interest. These sites were located in the fuel farm, or around the ‘Wilkes Hilton’ and old station zones.
Table III Summary of results for sediments (n=67) contaminated with metals and metalloids relative to background concentration level (BCL).

BCL>method detection limit (MDL), except for those marked with * where BCL=MDL.
All of the study zones contained a significant number of sites with levels of Ag, Pb, Fe, Cr, Ni and Cu in excess of ISQG-Low, ISQG-High, and/or 2 x BCL (Fig. 4). For Pb, all but three sites were above the ISQG-Low trigger level, with 91% having some degree of Pb contamination. A small number of sites were also contaminated with As, Sb and Zn.
For Ag, Pb, Cr and Ni, the 2 x BCL sits above the ANZECC guidelines, suggesting naturally elevated levels of these elements in this setting. This significantly reduces the number of sites judged as contaminated compared to results obtained using the ANZECC guidelines alone.
Across the zones, there is variability in the elements that contaminate sites. Arsenic was only detected at eight sites. While two of these were above the ISQG-Low trigger value, five sites have values in excess of the 2 x MDL. Similarly, Hg and Sb were detected at six and 12 sites, respectively, the majority of which sit above the ISQG-Low trigger value and 2 x MDL. Tin was detected at 15 sites with all but one above the 2 x MDL. The old station and fuel farm zones contain most of the sites contaminated with As, Hg, Sb and Sn. For Cu, Cr, Ni, Ag and Pb, more than half of the sites were above the ISQG-Low trigger value and these are relatively evenly spread across the four zones. However, the background levels of Cr, Ni, Ag and Pb are relatively high and most sites do not exceed 2 x BCL. Although Zn is detected across all zones, only eight sites have concentrations in excess of the ISQG-Low trigger value and 2 x BCL. These sites are concentrated around the ‘Wilkes Hilton’ and old station. No zone contains Mn contamination as all sites returned values below 2 x BCL. Iron is naturally enriched on Clark Peninsula but almost half of the sites, across all four zones, were found to be contaminated with elevated levels of Fe above 2 x BCL.
Contamination of water by metals
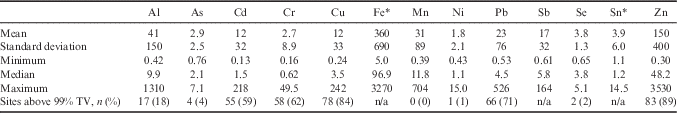
Metal concentrations in water collected from meltstreams and from meltwater around buildings and other waste products are shown in Tables IV–VI. Of the 93 sites sampled, all but one was contaminated with at least one metal at a concentration exceeding the guidelines, 96% were contaminated with two or more metals, and 60% of samples were contaminated with more than three metals. Thirteen sites were contaminated with six metals exceeding the guidelines, and two sites were contaminated with seven metals above guideline values; all these sites are in the old station zone (Table I).
Table IV Sites with waters contaminated by metals and metalloids above ANZECC guidelines or background concentration levels (for other elements of interest).
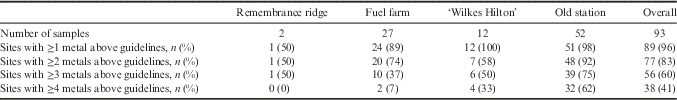
Table V Summary of results for waters (n=93) contaminated with metals and metalloids relative to ANZECC 99% protection trigger values (TV) for freshwater ecosystems. Data presented are μg l-1 except where noted.
* No ANZECC guidelines available, comparison to background concentration level only.
Table VI Summary of results for waters (n=93) contaminated with metals and metalloids relative to background concentration level (BCL). Data presented are μg l-1 except where noted.

BCL>method detection limit (MDL), except for those marked with * where BCL=MDL.
The results for each element across the sample sites are shown in Fig. 5. Background samples are also plotted, along with the ANZECC 99% trigger value and the 2 x BCL. In most cases, the 2 x BCL level is above ANZECC guidelines (Al, Cd, Cr, Cu, Pb and Zn) but in others (Mn and Ni) it sits below. Some of the elements are below detection in the background water samples (As, Sb, Se and Sn) and therefore MDL is used. For other elements of interest where no ANZECC guidelines are available (Fe, Sb and Sn) only the 2 x BCL value is shown.

Fig. 5 Results for water contaminated with various metals and metalloids relative to the ANZECC guidelines (99% trigger value) and background concentration level (BCL), and sorted according to location/zone.
The metals exceeding the ANZECC 99% trigger values found at the highest number of sites at Wilkes are (Table V):
 $${\rm Zn}\,\gt\, {\rm Cu}\,\gt\, {\rm Pb}\,\gt\, {\rm Cr}\,\gt\, {\rm Cd}\,\gt\, {\rm Al}\,\gt\, {\rm As}\,\gt\, {\rm Se}\,\gt\, {\rm Ni}.$$
However, levels of Al and Cr were naturally high in the background water samples from the uncontaminated stream. Considering all elements of interest on the basis of background concentration only, the order of the metals that are at contaminant levels >2 x BCL at the highest number of sites (Table VI) is:
 $${\rm Zn}\,\gt\, {\rm Mn}\,\gt\, {\rm Cu}\,\gt\, {\rm Pb}\,\gt\, {\rm Fe}\,\gt\, {\rm Cd}\,\gt\, {\rm Ni}\,\gt\, {\rm Cr}\,\gt \,{\rm Sb}\,\gt\, {\rm Al}\,\gt\, {\rm Sn}.$$
For those elements where the 2 x BCL value is greater than the ANZECC guidelines (except Se), significant numbers of sites were considered to be contaminated; if the 99% trigger value is used alone, an even greater number of sites are considered contaminated. For those elements where the ANZECC value is >2 x BCL (Ni and Mn) only one site was considered contaminated with Ni. However, at 2 x BCL c. 25% of sites were assessed as being contaminated with Ni and Mn.
Across all the study zones, meltwater was significantly contaminated at 2 x BCL and ANZECC levels (Fig. 5 and Tables V–VI). All samples at remembrance ridge had at least two or more metals above ANZECC guidelines. ‘Wilkes Hilton’ and old station are particularly contaminated. In both zones, water samples were contaminated with two or more metals, and over 50% were contaminated with four or more metals with concentrations in excess of the ANZECC guidelines.
Aluminium concentrations at 17 sites (18%) are above the ANZECC guideline, but because of the high background, only three sites have levels in excess of 2 x BCL (Fig. 5, Tables V–VI). These sites are mostly in the old station area. A similar pattern is apparent for Cd, although in this case, all samples in which this element was detected are well above the ANZECC guideline, and the bulk of samples in the old station area are above 2 x BCL. Arsenic was detected at five sites in the fuel farm, ‘Wilkes Hilton’ and old station zones. All but one were above the ANZECC guidelines and one was above 2 x BCL. All sites where Cr was detected had values above the ANZECC guidelines and 11 sites (12%) were above 2 x BCL. These sites are concentrated in the old station area. For Cu and Pb, most sites had values well above the ANZECC guidelines (78 (84%) and 66 (71%), respectively). If the 2 x BCL values, which are above the guidelines, are considered, fewer sites were judged as contaminated (30 (32%) and 26 (27%), respectively). The most significant Cu and Pb contamination occurs in the old station area, followed by the fuel farm and ‘Wilkes Hilton’. No site was contaminated by Mn with all samples falling below the ANZECC guidelines. However, 46 sites (49%) had values above 2 x BCL. The same pattern emerges for Ni, with all but one site below the ANZECC (2000) guideline but 13 sites (14%) above 2 x BCL. Only two sites have Se concentrations above the ANZECC (2000) guideline but none are above 2 x BCL. For Zn, the ANZECC guidelines and 2 x BCL are very similar and 89% of samples were in excess of these values. The old station zone had, on average, the highest levels of Zn contamination. Iron levels were not defined in the ANZECC guidelines, but 22 sites (24%) had concentrations in excess of 2 x BCL. Again, these sites are concentrated in the old station zone. For both Sb and Sn, ANZECC guidelines do not exist, but one site was contaminated with Sn and ten sites with Sb in the old station zone at levels in excess of 2 x BCL.
Contamination of sediment and water by petroleum hydrocarbons
More than 40 years after Wilkes was abandoned, hydrocarbon fumes permeate the fuel farm and sites across the old station zones. Fuel slicks have also been recorded in the bays surrounding Wilkes. Of the 1023, 55 gallon (205 litres) drums located and surveyed in 1999, 222 contained either SAB diesel fuel, light fuel petrol, lube oil, kerosene or liquid water that was rusty or contaminated (I. Snape, unpublished field notes). A conservative estimate of 8900 litres of these liquids remained within the drums.
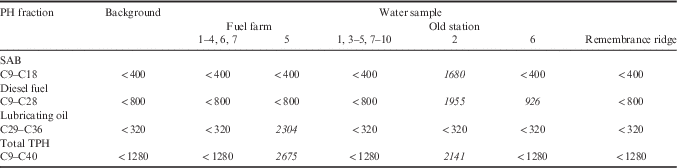
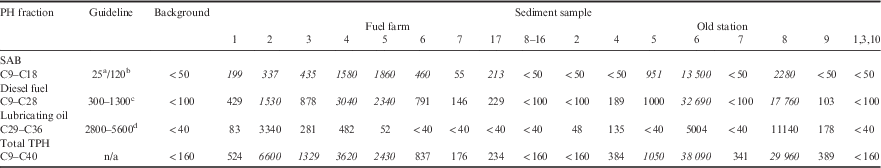
Twenty-seven sites with visible sediment contamination were sampled. Contaminated patches extend up to several square metres in size and are predominantly located in conjunction with leaking or rusting fuel drums. The depth of infiltration of oil and fuel into the sediment has not been examined. Despite the extent of visible contamination, the concentration of petroleum hydrocarbons in the sediment was not high, except in eight of the 27 samples analysed (Table VII). Ten recorded readings of C9–C18 (SAB fuel) above NEPM (ASC) 1999 guidelines. Five samples contained C9–C28 (diesel fuel) above guidelines, and one sample had C29–C36 (lubricating oil) above guidelines. All samples that exceeded guidelines had a C9–C40 TPH concentration close to or above 1000 mg kg-1. Of the eight contaminated samples, five were located adjacent to barrels at the fuel farm, and three were next to old fuel bladders and drums at the old station. The two background sediment samples taken from a clean meltwater stream had values below quantitation limits for hydrocarbons.
Table VII Petroleum hydrocarbon (PH) concentrations for sediment samples. All data are mg kg-1 on a dry matter basis (total concentration for defined PH fractions). Italics indicate values in excess of NEPM (ASC) 1999 guidelines for soil (coarse-fine texture).
SAB=Special Antarctic Blend diesel, TPH=total petroleum hydrocarbon.
a Ecological screening level (ESL) for F2 (>C10–C16) fraction in coarse or fine soil from area of ecological significance.
b ESL for F2 (>C10–C16) fraction in coarse or fine soil from urban residential and public open space (UR&POS).
c ESL for F3 (>C16–C34) fractions in coarse-fine soil from UR&POS.
d ESL for F4 (>C34–C40) fractions in coarse-fine soil from UR&POS.
Nineteen sites with visible hydrocarbon slicks on standing water meltponds were sampled. However, all but three of the samples were below quantitation limits for dissolved hydrocarbons (Table VIII). One recorded high levels of C29–C36 (lubricating oil), one contained high levels of C9–C18 (SAB fuel), and two contained high levels of C9–C28 (diesel fuel). Only two of these three samples had a high total signal of C9–C40 (TPH). One site is located in the fuel farm zone in landfill material, and the other two are located in the old station zone and are associated with old fuel bladders or drums within meltwater lakes.
Table VIII Petroleum hydrocarbon (PH) concentrations for waters. All data are μg l-1 (total concentration for defined PH fractions). Italics indicate value is quantified in excess of the ANZECC low reliability trigger value of 10–100 μg l-1.

SAB=Special Antarctic Blend diesel, TPH=total petroleum hydrocarbon.
These results indicate that while visible contamination of sediment and water is widely evident at Wilkes, and significant volumes of sediment and water have been affected, the concentration of hydrocarbons present is often low. There may be several reasons for these results: i) water sample volumes were low, resulting in relatively high quantitation limits, hence many of the samples might have been found to be in excess of the trigger value for TPH if the analysis had been more sensitive, ii) the visible contamination and odour are due in part to other (non-petroleum hydrocarbon) organic compounds, iii) the decades since abandonment may have seen evaporation, dispersal or biotic degradation of these substances in this environment. Clearly, more detailed investigation is required to definitively assess the extent and intensity of TPH contamination on the Clark Peninsula.
Discussion
Comparison of sediment and water contamination and relationships to runoff
Across Clark Peninsula, both water and sediment surrounding and downstream of waste sites are significantly contaminated. High concentrations of dissolved contaminants are present in meltwaters of Clark Peninsula, suggesting that contaminants are mobilized from sediment sources during melt on an annual and ongoing basis, and the contaminated soils and waste products will be an ongoing source of contaminated runoff across this area.
For metal contaminants, studies of water–contaminant–sediment interaction at abandoned Antarctic landfill (or ‘tip’) sites show that dispersal of water-borne contaminants occurs by both surface and subsurface runoff (Sheppard et al. Reference Sheppard, Claridge and Campbell2000, Snape et al. Reference Snape, Riddle, Stark, Cole, King, Duquesne and Gore2001a, Reference Snape, Morris and Cole2001b). Surface runoff through the tip occurs in ephemeral channels that develop in ice and sediments, usually either at the ice–sediment or active-layer–permafrost interfaces. Contaminated subsurface water movement occurs through pervasive dispersal and advection, but also via small channels within the sediment profile, usually at the base of the active layer (Snape et al. Reference Snape, Riddle, Stark, Cole, King, Duquesne and Gore2001a, Reference Snape, Morris and Cole2001b). At the Thala Valley tip site at Casey Station, metal concentrations in both surface and subsurface waters typically increased >1000-fold as meltwater passed through the waste (Snape et al. Reference Snape, Riddle, Stark, Cole, King, Duquesne and Gore2001a, Stark et al. Reference Stark, Snape, Graham, Brennan and Gore2008).
At Wilkes, similar processes occur at the landfill site and runoff discharges into Newcomb Bay at Tip Cove. This runoff impacts the local marine environment and high concentrations of metals are present several hundreds of metres into the bay (Stark et al. Reference Stark, Riddle, Snape and Scouller2003b, Reference Stark, Snape, Riddle and Stark2005). For example, discarded batteries, paint and leaded petrol spills (from drums) are the primary sources of anthropogenic Pb in the environment (Townsend & Snape Reference Townsend and Snape2008, Townsend et al. Reference Townsend, Snape, Palmer and Seen2009). In the sediments of Newcomb Bay/Tip Cove immediately downstream of the discharge point of the landfill site, Pb concentrations are 13–40 mg kg-1 above background levels (Townsend & Snape Reference Townsend and Snape2008). Other metals such as Cd, Cu and Zn have dispersed into the surrounding marine environment, affecting soft-sediment benthos (Stark et al. Reference Stark, Riddle, Snape and Scouller2003b). The impacted areas are characterized by fewer benthic taxa, lower diversity and lower species richness (Stark et al. Reference Stark, Riddle, Snape and Scouller2003b). Unfortunately, there has been no research conducted in other coves that directly drain Clark Peninsula. Other point sources of contamination would be expected from the old station zone that drains into Noonan and Powell coves.
Figure 3 shows the major runoff pathways observed during the 2009–10 summer. This is a hydrologically active and dynamic environment. Clark Peninsula contains a number of small catchments that have variable runoff characteristics for short (2–3-month) periods in the peak of summer. Surface runoff is concentrated into small streams that drain into Powell Cove, Noonan Cove and Newcomb Bay. Many small streams also flow under ice, through station buildings and the landfill site. Volumes of discharge are not known; however, in the 2009–10 summer, running water was observed over the ice surface, in pipes within the ice, at the ice–bedrock interface and flowing over the rocky coastline at downstream discharge points. Given the widespread distribution of potential contaminants over the peninsula and the various runoff discharges from the area, the pattern of the contamination is probably diffuse rather than concentrated.
To test the effect of surface runoff on contaminant dispersal locally, water samples W115–W119 were taken in a downstream sequence, draining c. 150 m east from the old station buildings towards Noonan Cove (Fig. 3). Samples W115–W118 were taken from the ice surface, from ponds and areas of channelled, flowing water. Sample W119 was taken from water discharging into a pond at the bedrock–ice interface (i.e. deeper within the profile). None of the surface water samples were taken adjacent to waste and were expected to be relatively ‘clean’. The water ponding or flowing at these locations is a direct result of runoff from the old station site. Figure 6 shows that all these samples contained concentrations of Cd, Cr, Cu, Pb and Zn that were above their respective ANZECC guidelines. Over this relatively short distance there is no clear pattern of dispersal, suggesting that high concentrations of these metals can be transported to the coast along this drainage line (the most downstream site was 130 m from the coast). For the subsurface sample, concentrations are also high. We hypothesize that this water is sourced directly from the ‘bathtub-type’ melt zone in which the old station sits, with water draining below the surface along flow paths at the bedrock–ice interface. This water drains directly from the soil and waste that is buried under ice. Figure 7 shows the severe melt season of 1992, which exposed significant waste that has not been fully recorded or tested for contamination due to burial under snow, firn and ice.

Fig. 6 Downstream changes in concentration of metals in a meltwater runoff zone at the old station site.

Fig. 7 Summer melt at Wilkes Station in 1992, exposing significant volumes of waste that is near-permanently buried. Photographs by Graeme Snow, Australian Antarctic Division, Copyright Commonwealth of Australia. Reproduced with permission. a. Looking east along buildings 32 and 33, building 21 on right, b. Looking south-west, buildings 18 and 19 in foreground on left, buildings 15 and 17 on right. Note the amount of scrap metal, fuel drums and construction waste that is normally buried which is sitting in meltwater.
Recognising that particulate entrainment, followed by surface and subsurface water transport, is a key process of contaminant dispersal at Wilkes, motivates the need for further research to identify hydrological pathways across Clark Peninsula, and to quantify both water flow and contaminant loads in the dissolved and suspended phases. Furthermore, little is known about the spatial extent, either across the surface or vertically within the profile, of sediment and ice around areas of major waste storage. This study provides a baseline for targeting areas of concern. At some sites, such as surface bedrock depressions, contamination may be relatively well contained. In contrast, dispersal may be significant in more open areas, particularly if legacy waste, such as battery acid residue, is present; lowering pH and, therefore, enhancing dissolution and mobilization of metal contaminants (Stark et al. Reference Stark, Riddle, Snape and Scouller2003b). Similarly, little is known about the volumes of waste and contaminated sediments across Clark Peninsula (Fryirs et al. Reference Fryirs, Snape and Babicka2013). The residence time of contaminants and their persistence in the environment also requires quantification. All of these questions are important for catchment management, site clean up and remediation.
Implications for clean up and remediation
Wilkes is a large, complex contaminated site, situated in a remote and environmentally sensitive area that lies just outside ASPA No. 136 in close proximity to penguin colonies and regionally significant moss beds. As a consequence, management of the site will take years to achieve. Moving beyond the typical logistical problems associated with personnel, equipment, transport and finance, climate (including melt, ice removal), geography (access), the large area of contamination, the wide range of flow paths of dispersal and the variety of evident contamination, makes containment of the site, and planning and implementation of remediation, particularly difficult at Wilkes. Furthermore, the historical importance of the peninsula and the heritage value of the old station site, as well as stakeholder issues associated with ownership and responsibility for the waste, provide unique challenges for development and management of any containment, clean-up or remediation operation. These issues are not exclusive to Wilkes. Kennicutt et al. (Reference Kennicutt, McDonald, Sericano, Boothe, Oliver, Safe, Presley, Liu, Wolfe, Wade, Crockett and Bockus1995), Gore et al. (Reference Gore, Revill and Guille1999), Poland et al. (Reference Poland, Riddle and Zeeb2003), Stark et al. (Reference Stark, Gardner, Snape and McIvor2003a, Reference Stark, Riddle, Snape and Scouller2003b) and Blanchette et al. (Reference Blanchette, Held, Jurgen, Aislabie, Duncan and Farrell2004) all report on metal, hydrocarbon and other forms of contamination at stations and places of historical value in Antarctica and the sub-Antarctic (e.g. McMurdo Sound, Casey Station, Davis Station, Cape Royds Hut, Discovery Hut, Atlas Cove on Heard Island, French Port-Martin Base, Port Lockroy Base on Goudier Island, East Base on Stonington Island and Aguirre Cerda Station on Deception Island).
At Wilkes, as at other stations, removal, containment/treatment and preservation of various types of waste will be required as part of a multi-year, multi-strategy approach (Fryirs et al. Reference Fryirs, Snape and Babicka2013). Clean-up operations will require strategic removal of non-heritage waste, containment and treatment of contaminated waste, sediment and meltwater runoff, and preservation of heritage items and buildings. New techniques may need to be developed for treatment and removal of waste across a large, complex site with various types of waste and extent of contamination.
Removal activities will probably involve extraction of the waste products and contaminated soil, as employed in the clean up of Thala Valley tip at Casey Station (Stark et al. Reference Stark, Snape and Riddle2006, Stark et al. Reference Stark, Snape, Graham, Brennan and Gore2008). Side effects include soil disturbance, contaminant mobilization and dispersal, and air emissions (Snape et al. Reference Snape, Gore, Cole and Riddle2002). If heavy machinery is used, there is significant potential for a temporary increase in contaminant mobilization and dispersal due to excavation (Snape et al. Reference Snape, Gore, Cole and Riddle2002).
In many areas containment and treatment of contaminated waste and runoff will be required. One option is to install permeable reactive barriers or other water treatment options on major drainage lines to treat runoff that is more easily contained (e.g. Snape et al. Reference Snape, Morris and Cole2001b, Northcott et al. Reference Northcott, Snape, Connor and Stevens2003). Permeable reactive barriers have been used successfully to remove hydrocarbons from fuel spills at other contaminated sites in Antarctica and other cold environments (e.g. Snape et al. Reference Snape, Morris and Cole2001b, Woinarski et al. Reference Woinarski, Snape, Stevens and Stark2003, Mumford et al. Reference Mumford, Rayner, Snape, Stark, Stevens and Gore2013). Chemical fixation of metals using orthophosphate at low temperatures (2°C) and during freeze-thaw cycling has been successfully tested (Hafsteinsdóttir et al. Reference Hafsteinsdóttir, White, Gore and Stark2011, White et al. Reference White, Hafsteinsdóttir, Gore, Thorogood and Stark2012). On-site treatment of metals in landfill waste using orthophosphate fixation has also been successfully applied in Antarctica. Both approaches require ongoing maintenance and monitoring until levels of contamination in source materials and surface and soil water reach near-background or below-guideline limits.
The preservation of heritage items, such as buildings, food items and other forms of memorabilia that provide a picture of life at Wilkes will also need to be carried out. This could occur through the designation of the site, or parts of the site, as a Historical Site and Monument (Camenzuli et al. Reference Camenzuli, Fryirs, Gore and Freidman2014). Preservation procedures, alongside treatment or removal of contaminants as part of a clean-up operation, in addition to ongoing deterioration and degradation of the buildings, provides a significant challenge. If the buildings are to remain in situ, it is probable that runoff from the buildings and other heritage items will continue for a considerable time, requiring long-term on-site containment and treatment.
Conclusion
During January 2010, water and sediment samples were collected for the analysis and assessment of metal, metalloid and petroleum hydrocarbon contamination at the derelict Wilkes Station, East Antarctica. Although no environmental contaminant guidelines exist specifically for Antarctica, this initial assessment indicates a high level of contamination when compared to ANZECC guidelines and Wilkes background control samples.
The results provide a baseline for future clean-up programmes at Wilkes Station. The work that is required at Wilkes is particularly challenging owing to the station’s location, the history of the site, difficult access for clean-up operations, repeated freeze-thaw conditions creating meltwater runoff which can mobilize contaminants, and the potential heritage value of buildings and items left on site. This contaminated site assessment will help with the identification of areas for which clean up is a high priority, and contribute information important for the management and planning of these future operations.
Author contribution statement
All authors authorise the publication of this paper and have reviewed the final version. Fryirs – experimental design, execution, data analysis, writing and intellectual contribution, Hafsteinsdottir – experimental design, execution, writing and intellectual contribution, Stark – data analysis, writing and intellectual contribution, Gore – data analysis and intellectual contribution.
Acknowledgements
We thank the Australian Antarctic Division (AAS2937) for logistical and financial support, and the Australian Research Council (LP0776373) and Macquarie University for financial support (RIBG and New Staff Grant to KF). We thank Greg Hince and Lauren Wise for analysis of sediments and waters for hydrocarbons, the Casey 2009–10 expeditioners (particularly Tim Spedding, Meenakshi Arora and Jill Williams) for field support. KF thanks Bill Burch and the ‘original’ Wilkes expeditioners for their stories about their time at the old station. We thank two anonymous reviewers for their comments.