INTRODUCTION
In the wild, frugivorous birds experience a constantly changing set of available diet options and a consequent variation in overall nutrient availability. Dietary needs vary with the demands of the breeding season, moulting and for many, migration (Dhondt & Hochachka Reference DHONDT and HOCHACHKA2001, García-Navas & Sanz Reference GARCÍA-NAVAS and SANZ2011, Herrera Reference HERRERA1982, Hobson et al. Reference HOBSON, SHARP, JEFFERIES, ROCKWELL and ABRAHAM2011, Karr Reference KARR1976, Leighton & Leighton Reference LEIGHTON, LEIGHTON, Sutton, Whitmore and Chadwick1983, Poulin et al. Reference POULIN, LEFEBVRE and MCNEIL1992). This study seeks to test the hypothesis that seasonal shifts in avian frugivore diets will track reproductive nutritional needs rather than fruiting patterns. A positive result will imply that avian frugivores are choosing a fruit diet based on nutritional needs rather than simple availability.
Previous studies have proposed that seasonal shifts in diet of tropical frugivorous birds are related to reproductive activity rather than to fruiting patterns (Kannan & James Reference KANNAN and JAMES1999, Karr Reference KARR1976, Kinnaird & O’Brien Reference KINNAIRD and O’BRIEN1999, Poonswad et al. Reference POONSWAD, TSUJI and JIRAWATKAVI2004, Poulin et al. Reference POULIN, LEFEBVRE and MCNEIL1992). Data from domestic birds indicate that individuals are capable of modifying their behaviour and diet choices to address changing mineral needs (Robbins Reference ROBBINS1993). Perhaps the most universal period of high mineral demand for birds is during the breeding season, particularly the time leading up to egg laying. Calcium requirements for egg laying are up to five times that of non-breeding birds. Birds have been known to go to great lengths to meet this requirement, including scavenging for bones and other high-calcium objects (Barclay Reference BARCLAY, Racey and Swift1995, Dhondt & Hochachka Reference DHONDT and HOCHACHKA2001, Graveland & VanderWal Reference GRAVELAND and VANDERWAL1996, Nager Reference NAGER2006, Robbins Reference ROBBINS1993, Tilgar et al. Reference TILGAR, MÄND and MÄGI2002).
Tropical avian frugivores may have a hard time meeting their mineral needs since many fruits are quite deficient in individual minerals (Robbins Reference ROBBINS1993). Thus we might expect to see behavioural responses to periods of mineral stress such as egg laying and moulting. Specifically, one might expect that during the time leading up to egg laying, a diet relatively high in calcium would be selected, perhaps at the expense of other nutrients. After eggs are laid, energetic requirements are high for brooding, so diet selection during this period might be for lipid-rich fruits, i.e. what have been traditionally considered high-quality fruits (Dunn Reference DUNN1980, McKey Reference MCKEY, Gilbert and Austin1975, Robbins Reference ROBBINS1993, Sibly et al. Reference SIBLY, WITT, WRIGHT, VENDITTI, JETZ and BROWN2012). When eggs have hatched and chicks are growing, protein becomes an important nutritional component, which may mean a switch to higher-protein fruits and/or more time spent foraging for invertebrates and other high-protein, non-fruit foods (Foeken et al. Reference FOEKEN, DE VRIES, HUDSON, SHEPPARD and DIERENFELD2008, Kinnaird & O’Brien Reference KINNAIRD and O’BRIEN1999, Poonswad et al. Reference POONSWAD, TSUJI and JIRAWATKAVI2004).
Traditionally, studies of avian nutrition have focused on macronutrient analysis and energetics (Herrera Reference HERRERA1982, McKey Reference MCKEY, Gilbert and Austin1975, Robbins Reference ROBBINS1993, Stiles Reference STILES1993). Existing studies concerning mineral nutrition tend to be relevant to captive populations and mineral deficiencies (Dierenfeld Reference DIERENFELD1996, Robbins Reference ROBBINS1993). Little work has been done regarding wild populations, diet selection and mineral nutrition (Barclay Reference BARCLAY, Racey and Swift1995, O’Brien et al. Reference O’BRIEN, KINNAIRD, DIERENFELD, CONKLIN-BRITTAIN, WRANGHAM and SILVER1998, Otten et al. Reference OTTEN, OROSZ, AUGE and FRAZIER2001, Ruby et al. Reference RUBY, NATHAN, BALASINGH and KUNZ2000, Wendeln et al. Reference WENDELN, RUNKLE and KALKO2000).
Our objective is to develop a method to quantify the nutritional content of a frugivore diet and to test hypotheses regarding temporal shifts in diet. First we introduce a pair of indices, and make a series of logical assumptions to simplify their calculation for field measurement. Second, we examine the question of whether shifts in diet are related to reproductive activity rather than fruiting patterns. If reproduction drives the diet of frugivorous birds, we expect that a shift in concentration of minerals and other nutrients should be related to periods of reproduction and not seasonal change. We use data for two frugivorous hornbill species, the black-casqued hornbill Ceratogymna atrata (Temminck, 1835) and the white-thighed hornbill Bycanistes albotibialis (Cabanis & Reichenow, 1877), to illustrate the effectiveness of our indices and to test whether reproduction or seasonal fruit availability drive their diets.
METHODS
Selected diet index
One way to analyse avian diet over time is to measure the total amount of each nutrient consumed during a given period. This method requires data on the mass of each food item eaten and the nutrient concentration of that item during that period. An equation for total intake of each nutrient would be:
where nti is the fraction of the nutrient in food item i during time t, and mti is the total dry mass of item i eaten during time t. To calculate mt would require estimating the foraging efficiency of the birds with respect to each fruiting species, the time the birds spend in mature individuals of each fruiting species and the average dry mass of the fruit of that species. Collection of these data for wild birds, particularly in the tropics, is complicated by the expansive diets of most birds (Kitamura Reference KITAMURA, THONG-AREE, MADSRI and POONSWAD2011, Poulsen et al. Reference POULSEN, CLARK, CONNOR and SMITH2002, Whitney et al. Reference WHITNEY, FOGIEL, LAMPERTI, HOLBROOK, STAUFFER, HARDESTY, PARKER and SMITH1998).
To ease data collection, we make a number of assumptions. First, we assume that birds are consuming a calorically adequate diet and thus, that we can represent the nutritional content of the diet on a fractional rather than total basis. Next, we assume that samples of fruit collected near peak ripeness make an acceptable substitute for a series of samples collected over time. Finally, we assume that a simple fraction of feeding observations could serve as a substitute for measurements of foraging efficiency and time spent in fruiting trees.
Incorporating these assumptions into the above equation, we get:
where Nt is the fraction of the diet represented by a given nutrient during time t, ni is the concentration of the nutrient in ripe fruit of species i, and pit is the proportion of the feeding observations represented by that species in that period over all the diet species for which there are nutritional data.
Neutral diet index
To provide a baseline for comparison with the selected diet, we calculate an index of the nutrient concentrations of the fruit of all species which we know these two hornbill species consume across the study area. This non-selective or neutral diet index allows us to assess whether hornbills are selecting the fruit in their diet based on nutrient concentration rather than simply randomly selecting a diet based on availability.
The neutral diet index begins with an estimate of the total quantity of fruit available from a given set of fruiting species in an area – the Fruit Availability Index (FAI; Fogiel Reference FOGIEL2007, Holbrook et al. Reference HOLBROOK, SMITH and HARDESTY2002, Stauffer & Smith Reference STAUFFER and SMITH2004).
where Di is the density of a given fruiting species in the area, Pti is the average proportion of the canopy of mature individuals in fruit and Fti is the average fraction of fruit which are ripe of those trees with ripe fruit and dbhi is the average diameter at breast height for the species in the area.
We converted the FAI into a Fruit Nutrition Index or FNI by dividing the FAI for each species i by the total FAI for each period t to produce a proportion. This fraction was then multiplied by the nutrient concentration of the fruit of species i. The resulting values were summed for all diet species and the sum divided by the sum of the proportions of all FAI values for which there were nutritional data.
 \begin{equation*}
\mathop {\it FNI}\nolimits_t = \frac{{\sum_i {\left( {\mathop n\nolimits_i \times \frac{{\mathop {FAI}\nolimits_{ti} }}{{\mathop {\it FAI}\nolimits_t }}} \right)} }}{{\sum_i {\frac{{\mathop {FAI}\nolimits_{ti} }}{{\mathop {\it FAI}\nolimits_t }}} }} = \frac{{\sum_i {\left( {\mathop n\nolimits_i \times \mathop {\it FAI}\nolimits_{ti} } \right)} }}{{\sum_i {\mathop {FAI}\nolimits_{ti} } }}
\end{equation*}
where the sums were taken for those species for which there were both FAI and nutrient data in a given period. The FNI was calculated for each month of the study period where there were data for both fruiting phenology and feeding observations, then a running 3-mo average of both diets was then further averaged by calendar month over the 5-y study period to produce monthly averages. Statistics were calculated using microsoft Excel version 2008 for Macintosh.
Study site and species
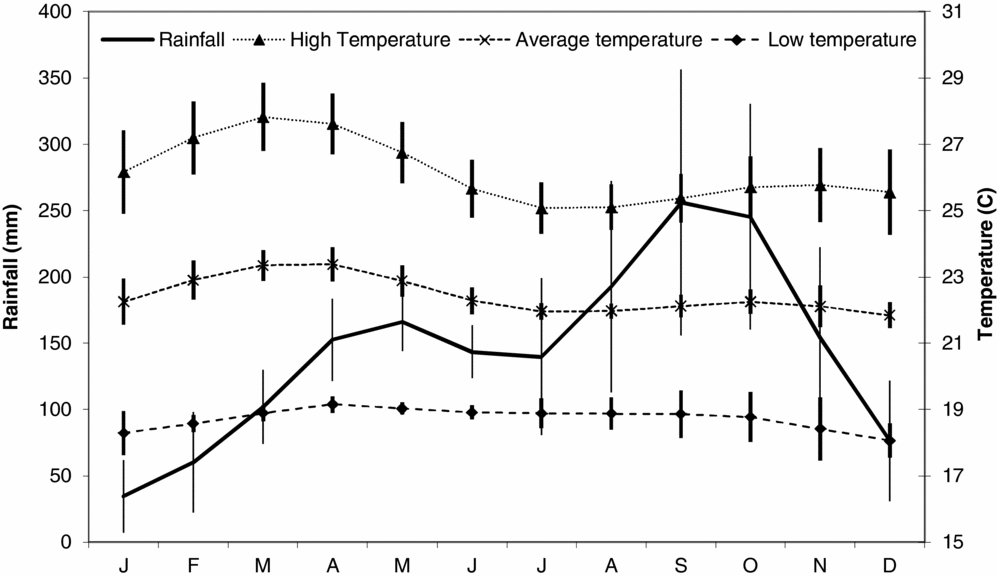
Diet observations were made between May 1994 and December 1999 at the Bouamir Research Station (BRS) in the Dja Faunal Reserve in southern Cameroon (3°11′27″N, 12°48′41″E). The Dja is a United Nations-designated biosphere reserve covering about 526000 ha and is surrounded on three sides by the Dja River, a tributary of the Congo. The area has never been commercially logged. Although legally protected, the area does suffer hunting pressure from villages to the north and west (Muchaal & Ngandjui Reference MUCHAAL and NGANDJUI1995, Reference MUCHAAL and NGANDJUI1999). Bouamir is a 25-km2 study site situated in the approximate centre of the reserve in semi-deciduous tropical rain forest. The study area includes areas of upland forest, Raphia swamp and rocky outcrops known as rochers. Annual rainfall is approximately 1600 mm and comes in two wet seasons, with rainfall peaks in late September and mid-May (Fogiel Reference FOGIEL2007, Lamperti Reference LAMPERTI2004, Poulsen et al. Reference POULSEN, CLARK, CONNOR and SMITH2002, Whitney et al. Reference WHITNEY, FOGIEL, SMITH, PARKER and STAUFFER1996, Reference WHITNEY, FOGIEL, LAMPERTI, HOLBROOK, STAUFFER, HARDESTY, PARKER and SMITH1998). Rainfall data were collected daily with a rain gauge placed in the centre of an approximately 0.5-ha clearing at the centre of the BRS (Figure 1).

Figure 1. Rainfall and temperature data from the Bouamir Research Station in the Dja reserve, Cameroon. Data were collected from 1994 to 1999. Error bars represent 1 SD, N = 6 for all months.
There are three species of large hornbill (Aves: Bucerotidae) within the Dja Reserve. Two are predomi-nantly frugivorous, the black-casqued hornbill (Ceratogymna atrata) and the white-thighed hornbill (Bycanistes albotibialis). The third species, the piping hornbill (C. fistulator sharpii), is smaller and has a somewhat more general diet (Kemp Reference KEMP, del Hoyo, Elliott and Sargatal2001).
There are approximately 230 tree species within the reserve. Ceratogymna atrata and B. albotibialis have been observed to eat the fruit of 22% of these species (Poulsen et al. Reference POULSEN, CLARK, CONNOR and SMITH2002, Whitney et al. Reference WHITNEY, FOGIEL, LAMPERTI, HOLBROOK, STAUFFER, HARDESTY, PARKER and SMITH1998).
The hornbill breeding season runs from early July to mid-October. Ceratogymna atrata and B. albotibialis begin to court and investigate nesting cavities in July. Females are walled into cavities by early August and eggs are presumably laid soon after. In 1995, pieces of egg shell appeared in traps placed below nest cavities by mid-August likely indicating that chicks were hatching at this time. In 1995, fledging was observed from the end of September to the middle of October (pers obs, Stauffer & Smith Reference STAUFFER and SMITH2004).
Vegetation survey
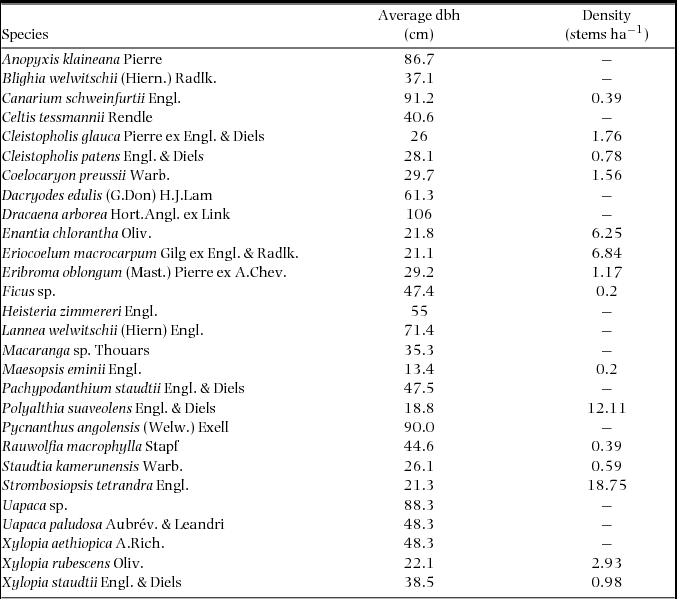
Vegetation data were collected in the study area in 1994. Average dbh and species density (Di) were estimated from surveys of mature trees (greater than 10 cm dbh) in two belt transects (10 × 400 m and 10 × 450 m), 32 40-m2 plots and three 100-m2 plots. Plots were randomly placed within the study area (Fogiel Reference FOGIEL2007). In all, almost 3300 stems were marked with approximately 304 species in 41 families identified (Appendix 1).
Fruiting phenology
Each month between December 1994 and November 1999, we surveyed approximately 450 reproductively mature trees representing over 40 hornbill-diet species for flowering and fruiting phenology. In all, we made nearly 20000 observations. As trees died or new diet species were added, mature trees were selected with a goal of surveying about 10 trees of each species each month. Selection methods varied by year. For example in 1995, three randomly generated numbers were used to select: (1) Which trail to leave camp on, (2) How far to go down that trail and (3) What compass bearing to take when leaving the trail. Then the first mature tree of the species encountered was added to the list.
Each tree was examined from the ground and given a score from 0 to 4 for each of four categories: (1) fraction of canopy in flower, (2) fraction of canopy in fruit, (3) fraction of flowers in bud and (4) fraction of fruit that were ripe. For flowers and fruit the scores translate as follows: 0 indicates no sign of fruiting or flowering, 1 = 1–25% of the crown in flower or fruit, 2 = 26–50%, 3 = 51–75% and 4 = 76–100% (relative to expectations for that species). For flower buds and ripe fruit the same scale was used except the score is relative to the fraction of canopy in flower or fruit, not to the full canopy. So, for example, a score of 3 for flower buds means that between 51% and 75% of the flowering was in bud. We also recorded observations of flowers and fruit on the ground to reinforce our observations from the canopy (Fogiel Reference FOGIEL2007, Hardesty Reference HARDESTY1999, Hardesty & Parker Reference HARDESTY and PARKER2003, Holbrook & Smith Reference HOLBROOK and SMITH2000, Lamperti Reference LAMPERTI2004, Whitney et al. Reference WHITNEY, FOGIEL, LAMPERTI, HOLBROOK, STAUFFER, HARDESTY, PARKER and SMITH1998).
Feeding observations
The diets of B. albotibialis and C. atrata were quantified in the following manner. A series of six trail loops within the BRS were each walked approximately five times per month for a total distance sampled of approximately 175 km mo−1 (Poulsen et al. Reference POULSEN, CLARK and SMITH2001). Trails were walked at a steady pace and species, numbers of individuals, sex and feeding behaviours were recorded for each group of arboreal frugivores encountered. Frugivores were located both visually and by sound and observers left the trail for short distances and times to collect data on groups not visible from the trail. Food species was recorded for each observation of explicit or likely (feeding behaviours and fruit present, but no observed consumption) feeding (Lamperti Reference LAMPERTI2004, Poulsen et al. Reference POULSEN, CLARK, CONNOR and SMITH2002, Whitney & Smith Reference WHITNEY and SMITH1998, Whitney et al. Reference WHITNEY, FOGIEL, LAMPERTI, HOLBROOK, STAUFFER, HARDESTY, PARKER and SMITH1998). Schoener's index was calculated to compare the diets of the two hornbill species (Schoener Reference SCHOENER1968).
Fruit collection/nutritional analysis
We collected samples of fruit pulp for nutritional analysis in 1995 and 1997. Ripe fruit were collected opportunistically from the canopy of fruiting individuals where possible and from the ground below fruiting individuals when necessary. Fruit pulp was mechanically removed from the seed(s) and placed in 70% ethanol for preservation. Samples of pulp were weighed, dried in a kerosene oven and reweighed to estimate water content.
Samples collected in 1995 were tested for crude protein, dry matter, ash, cell wall constituents (neutral and acid detergent fibre and lignin), water-soluble carbohydrates (or simple saccharides) and assorted minerals (Ca, Cu, Fe, Mg, Mn, Na, P, Zn) at the Department of Nutrition, Wildlife Conservation Society, Bronx, New York. Samples collected in 1997 were analysed for the same components with the addition of crude fat.
Crude protein was analysed using a macro-Kjeldahl method, which determined CP as total nitrogen × 6.25. Neutral detergent fibre, acid detergent fibre and lignin values were determined using Goering & Van Soest (Reference GOERING and VAN SOEST1970). Water-soluble carbohydrates were analysed by using a modification of Strickland & Parson (Reference STRICKLAND and PARSON1972). Samples were extracted with boiling water for 10 min and then 0.5 ml phenol and 2.5 ml sulphuric acid were added. After 1 h, sample absorption was determined on a Genysis 5 spectrophotometer. Crude fat was measured using a 1045 Tectaor Soxtec system to extract lipid fractions with petroleum ether, following procedures outlined in AOAC for feeds and foods.
Mineral analyses were performed using standard atomic absorption spectrophotometer methods for plants (Perkin Elmer Reference ELMER1982). Duplicate samples were ashed in a muffle furnace at 550ºC overnight, cooled in a desiccator and weighed to determine ash content. They were then dissolved in 20% HCl with heat and then diluted to 25 ml with a 1% lanthanum solution (when necessary samples were further diluted with 0.36 N HCl containing 1% La). Ca, Cu, Fe, Mg, Mn and Zn were individually run on a Perkin Elmer atomic absorption spectrophotometer (Model 3100) with an air acetylene flame and a 0.36 N HCl with 1% La blank. Phosphorus was measured using modified AOAC colorimetric methods (AOAC 1995).
RESULTS
Feeding observations
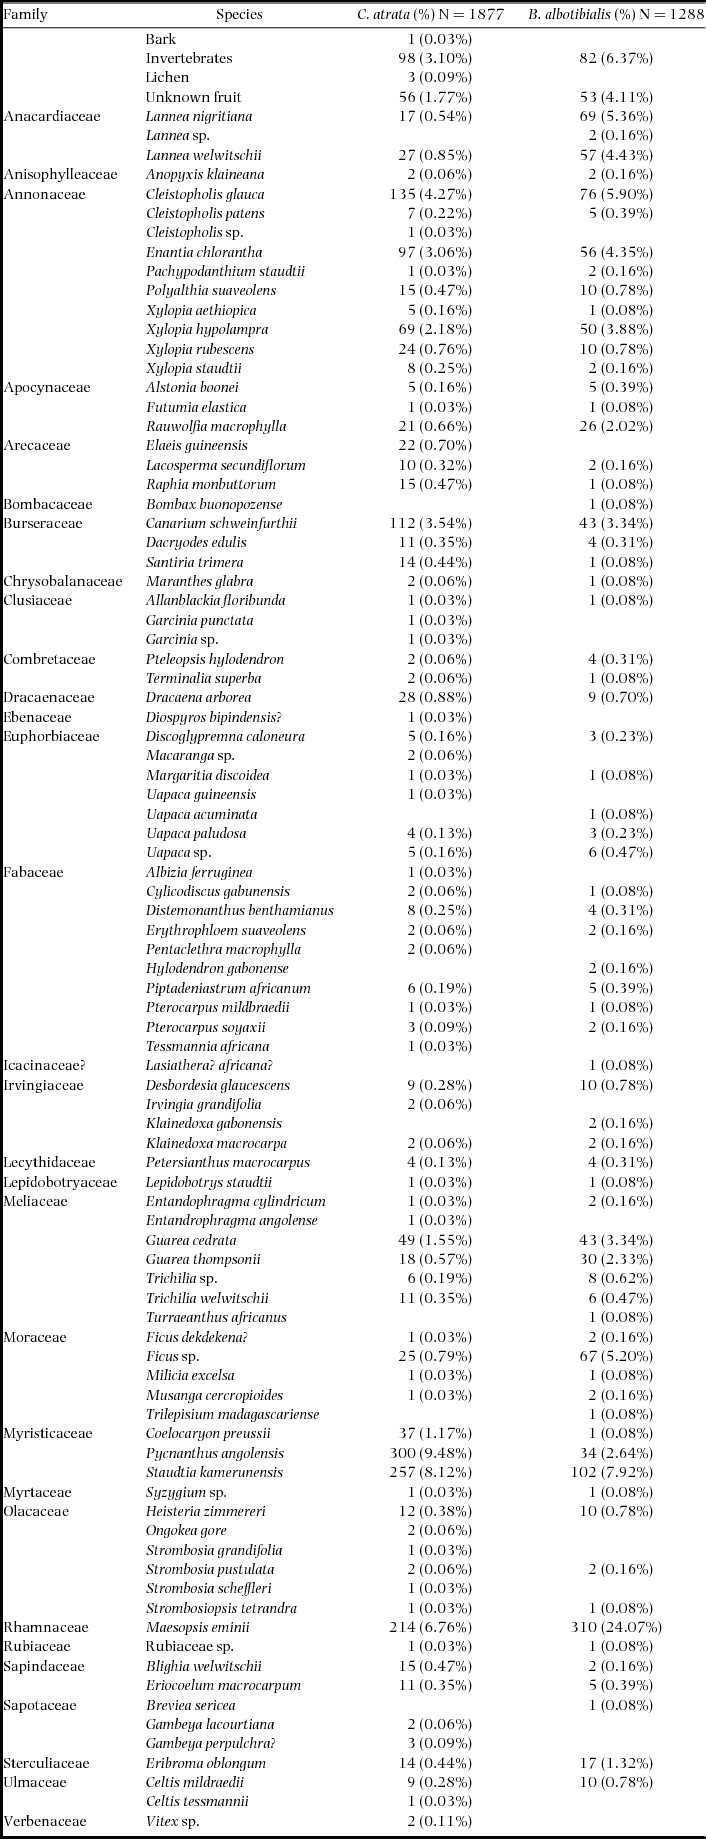
The number of feeding observations averaged 19.0 (range = 0–91) mo−1 (B. albotibialis) and 27.7 (0–74) mo−1 (C. atrata) for the study period. In total we collected 3165 feeding observations over 68 mo (Appendix 2). The hornbills were observed to eat an average of 7.5 (0–16) spp. mo−1 (B. albotibialis) and 9.8 (0–26) spp. mo−1 (C. atrata) over the same time period. The diets of the two species were substantially similar, with a diet overlap of 0.65 (Schoener's index) for all feeding observations over the study period. The difference between the diets was primarily due to two species which account for more than half of the difference between the diets: Maesopsis eminii and Pycnanthus angolensis. Bycanestes albotibialis appears to prefer Maesopsis eminii while Ceratogymna atrata prefers Pycnanthus angolensis.
Nutritional analysis
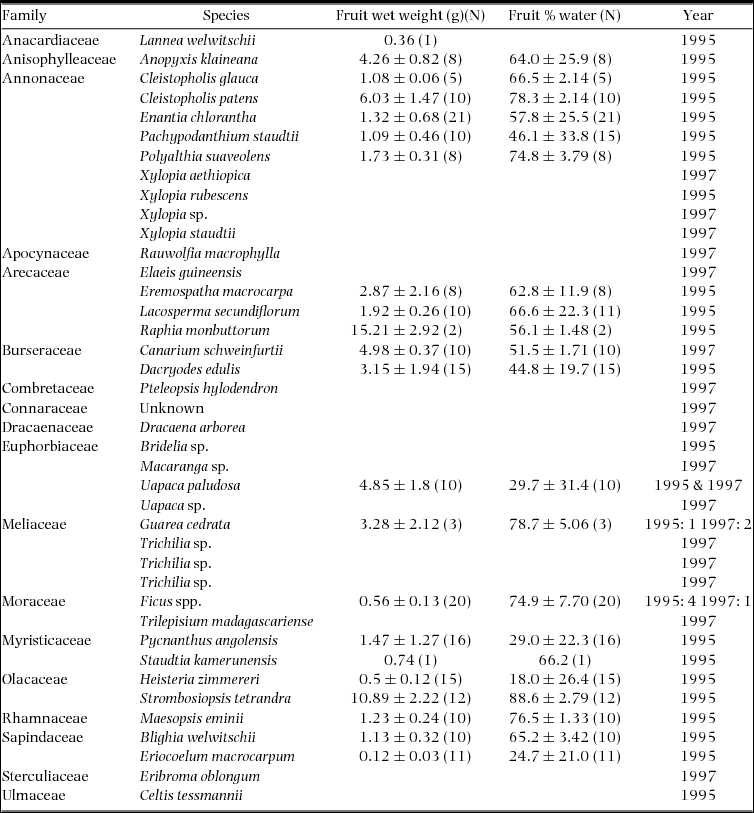
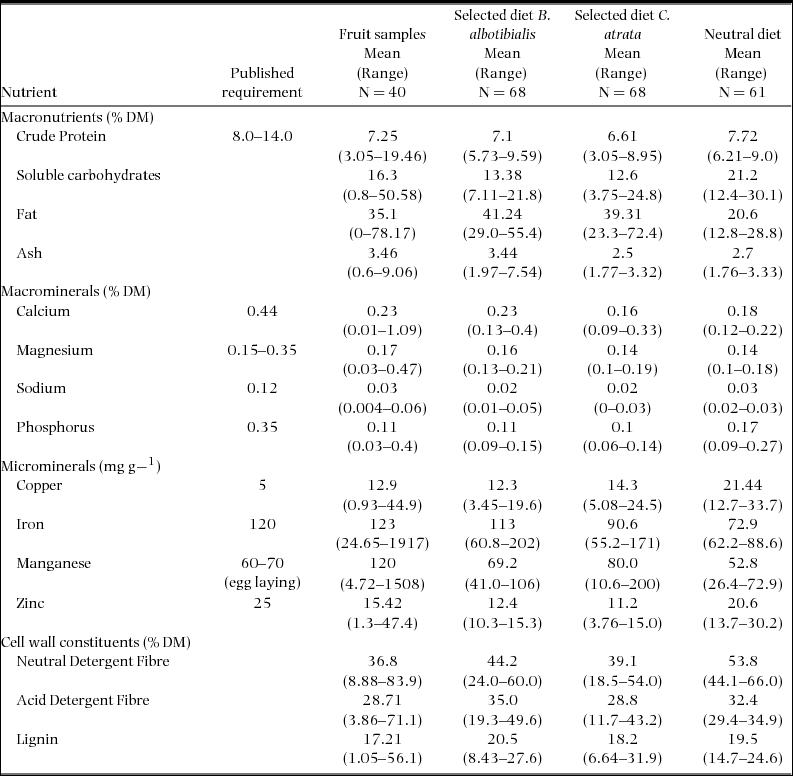
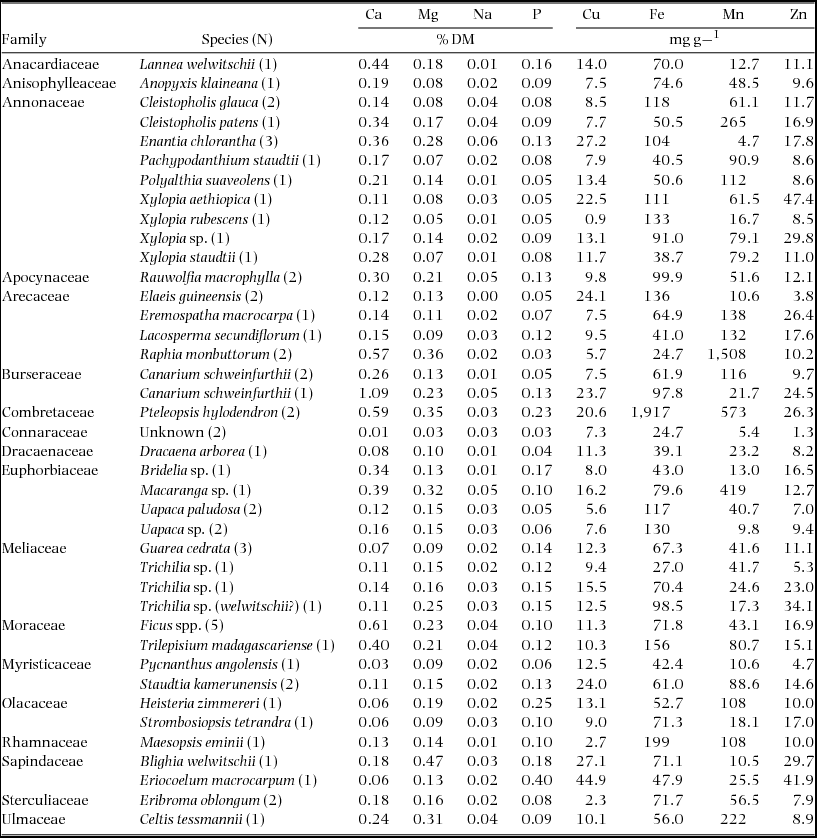
Samples of fruit tissue were collected from 78 trees of 40 species in 1995 and 1997. Some of these collections were combined in the laboratory to create an adequate sample for analysis. In all, 58 samples were analysed for their nutrient concentrations (Table 1). Together these samples provide nutritional data for 78.3% and 71.7% of the observed diet of C. atrata and B. albotibialis respectively (Appendix 2).
Table 1. Fruit tissue samples collected in the Dja reserve in 1995 and 1997. Samples were dried in a kerosene oven to measure water content.

Monthly selected and neutral diet nutritional content
The nutrient concentrations of both the neutral and the selected diet varied considerably over the 5-y period studied. For the 61 mo for which there are both neutral and selected diet data, the neutral and selected diets were significantly different from each other for all nutrients and for the two hornbill species except for crude protein and lignin for B. albotibialis and magnesium and lignin for C. atrata (P < 0.05, Student's t, N = 61, t = 2.19–17.9).
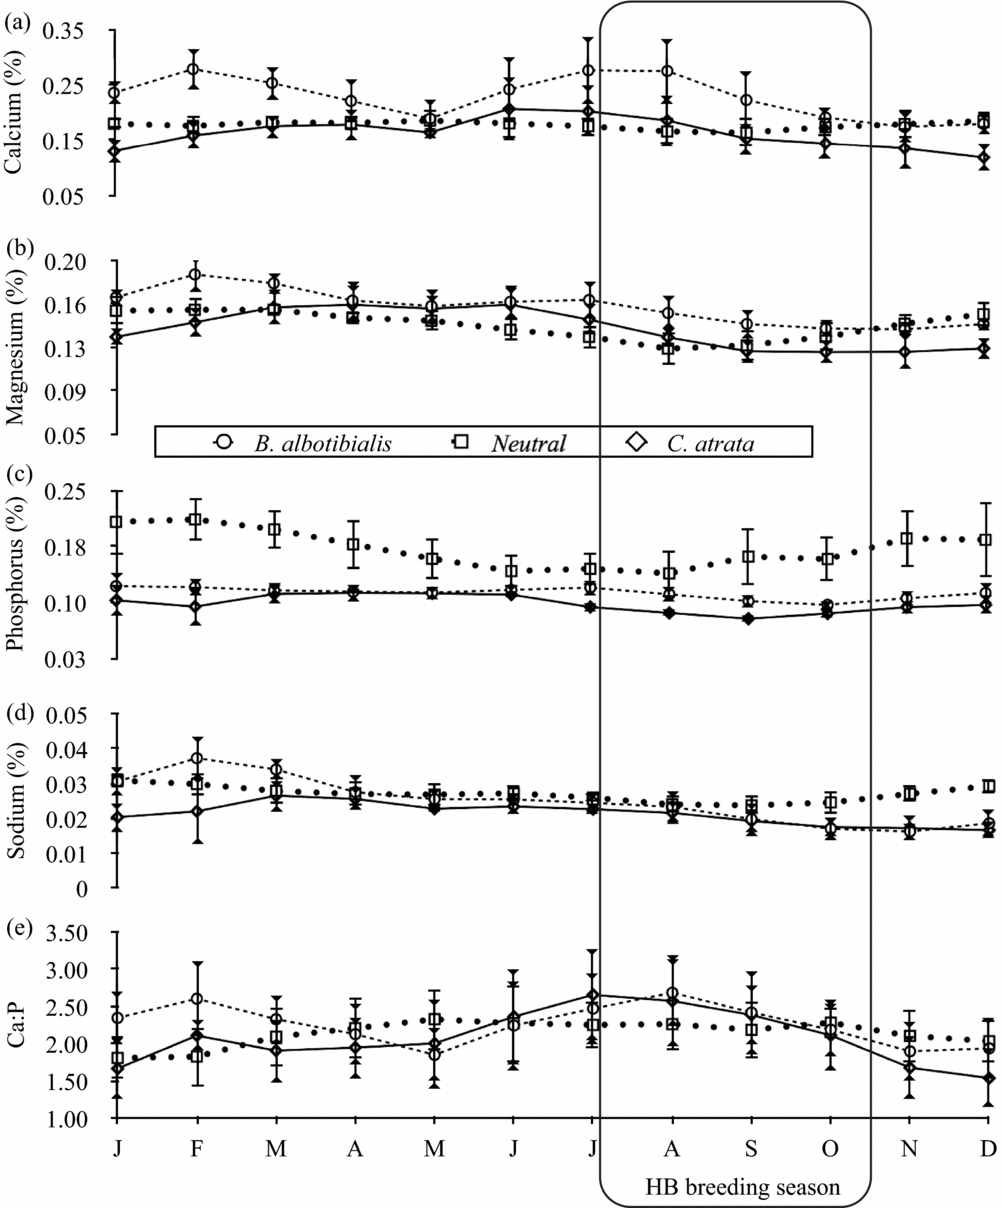
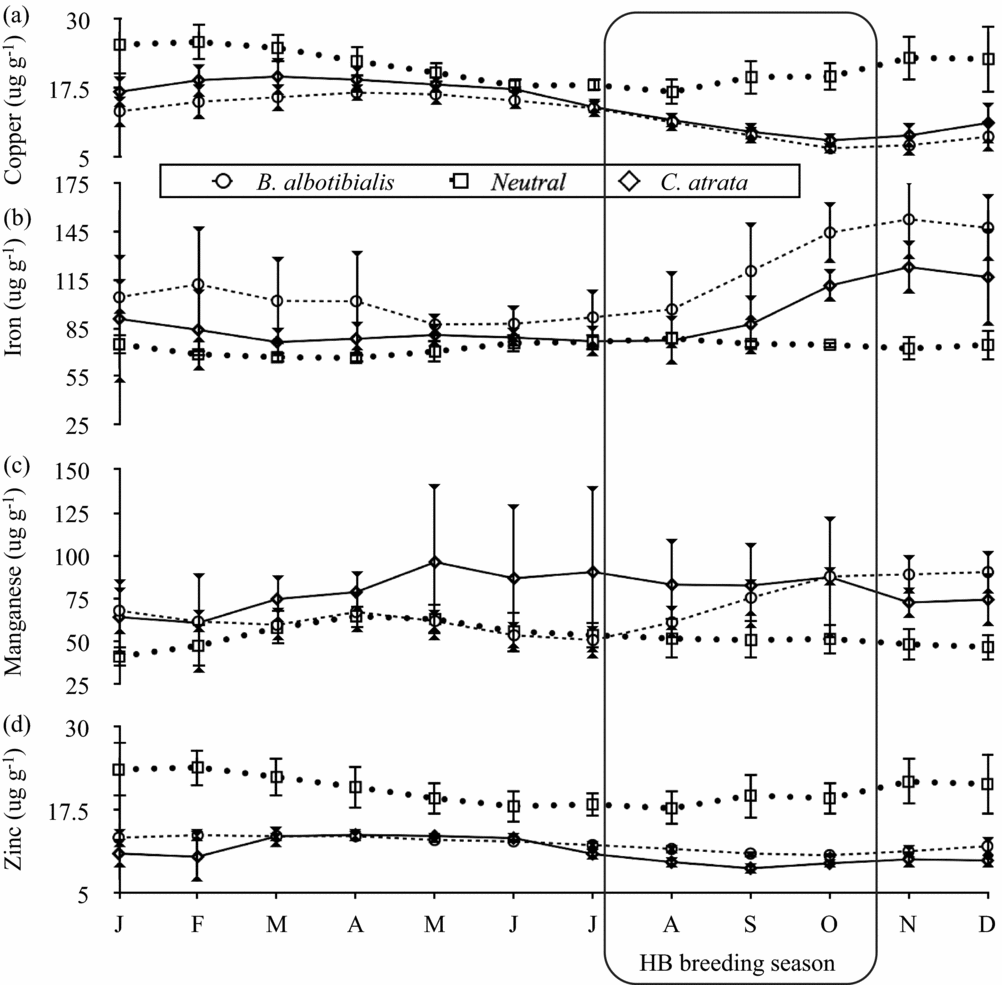
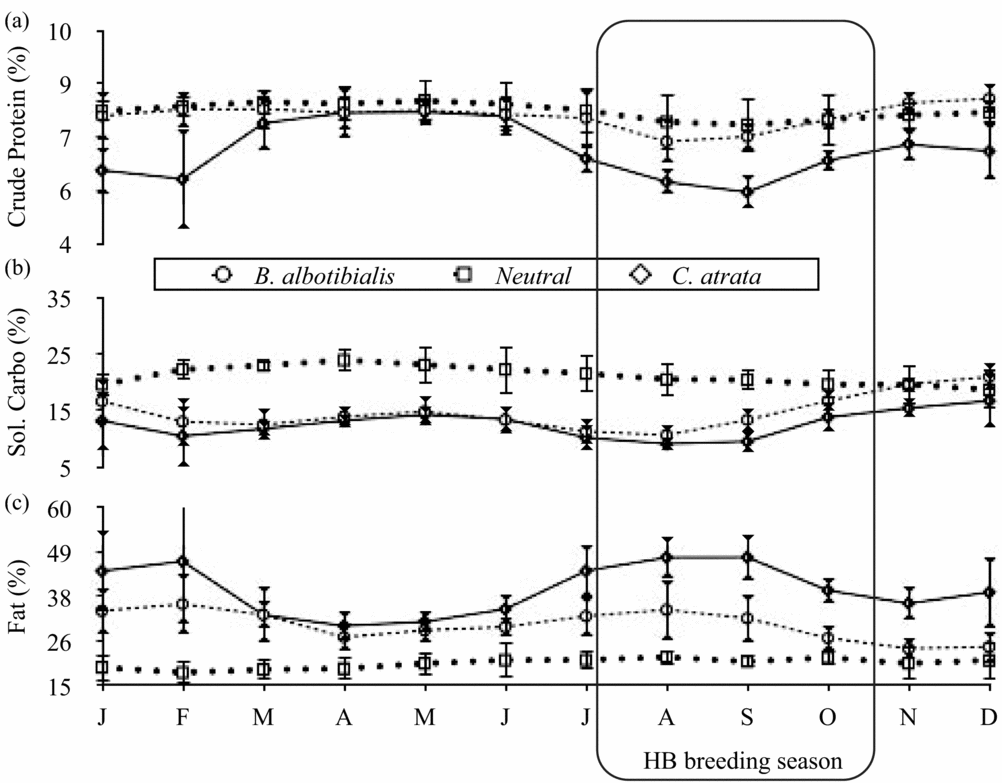
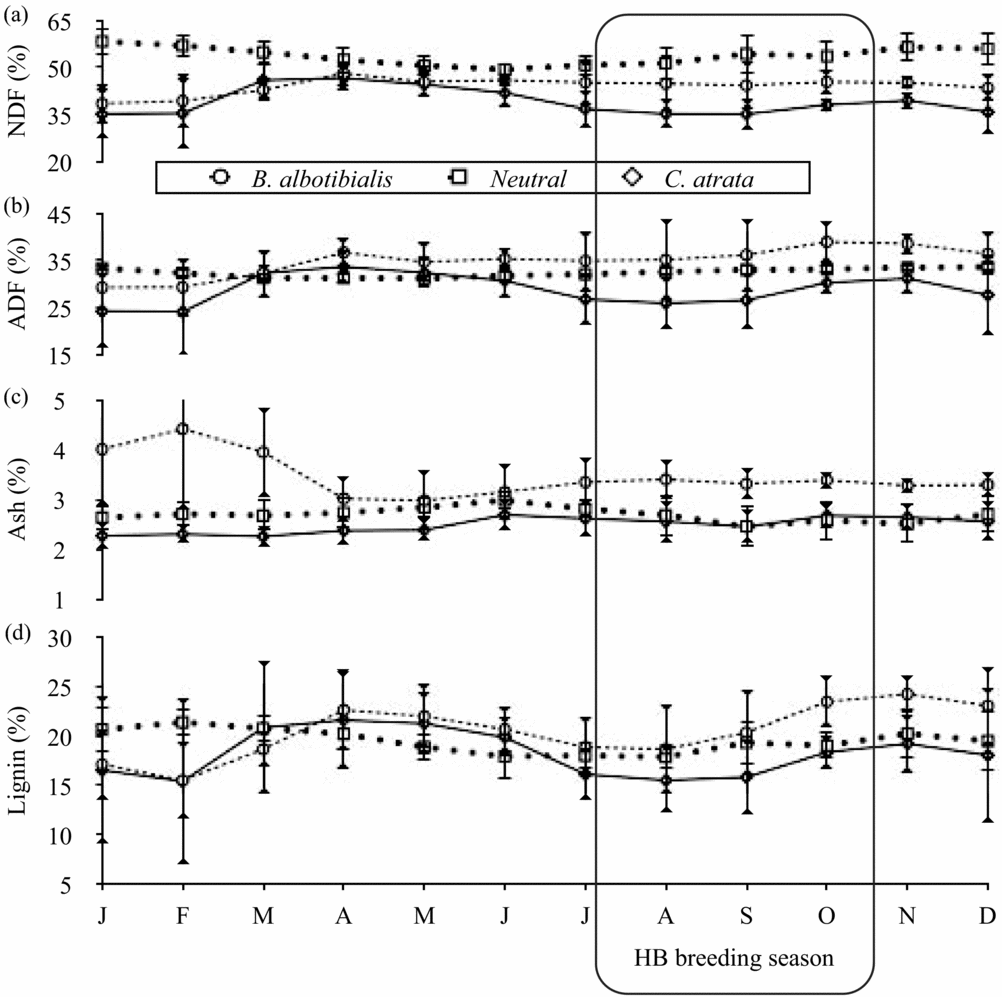
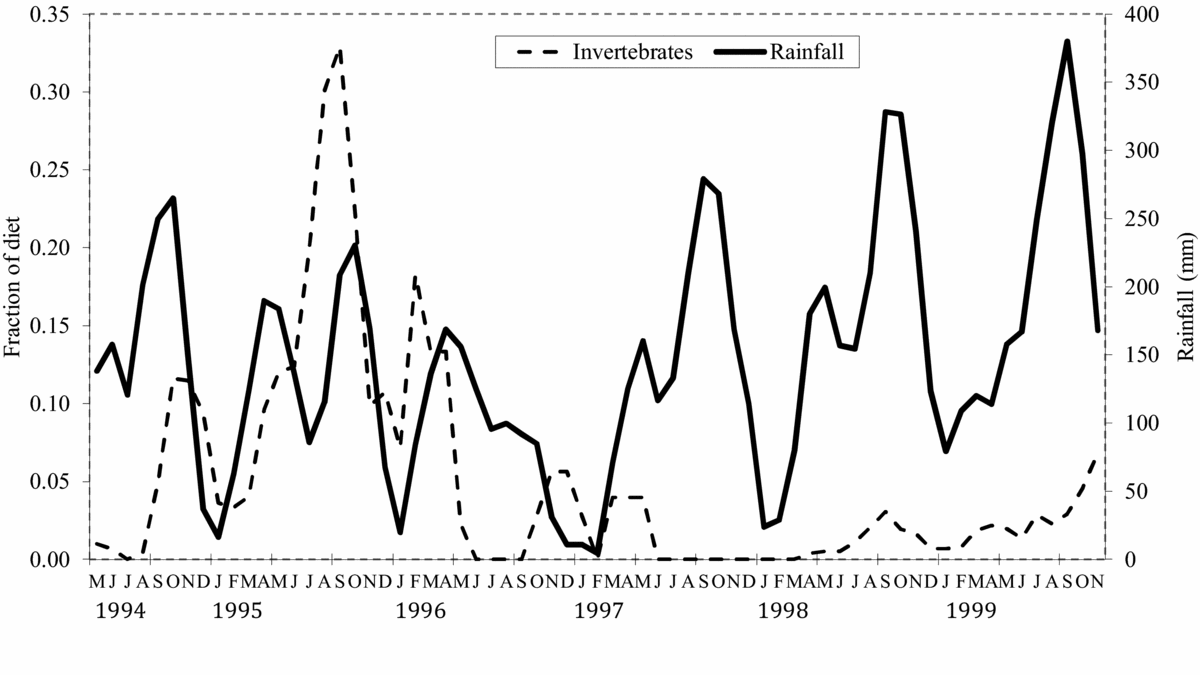
For calcium and magnesium (Figure 2), iron and manganese (Figure 3), ash (Figure 4) and fat content (Figure 5), there are periods of the year (i.e. 3 mo or more in a row) where the concentration of the selected diet significantly (Student's t, P < 0.05, N = 5 except December where N = 6, t = 2.8–14.6) exceeds that of the neutral for one or both species. For phosphorus (Figure 2), copper and zinc (Figure 3), neutral detergent fibre (Figure 4) and soluble carbohydrates (Figure 5) the neutral diet concentration is greater than the selected diet concentration for all or most of the year (Student's t, P < 0.05, N = 5 except December where N = 6, t = 2.88–15.4). The remaining nutrients measured, sodium (Figure 2), copper and zinc (Figure 3), acid detergent fibre and lignin (Figure 4), and crude protein (Figure 5), show relatively little difference between the selected and non-selected diet concentrations over the study period. The fraction of feeding observations that were sightings of feeding on invertebrates also varied considerably over the study period (Figure 6) with peak invertebrate intake roughly coincident with the rainy seasons for both hornbill species.

Figure 2. Monthly average concentrations of the macrominerals calcium (a), magnesium (b), phosphorus (c) and sodium (d) along with the calcium to phosphorus ratio (e) in both the selected and neutral diets for Ceratogymna atrata and Bycanistes albotibialis in the Dja reserve, Cameroon, from 1994 to 1999. Error bars represent 95% confidence intervals; N = 5 for all months and nutrients.

Figure 3. Monthly average concentrations of the microminerals copper (a), iron (b), manganese (c) and zinc (d) in the selected and neutral diets for Ceratogymna atrata and Bycanistes albotibialis in the Dja reserve, Cameroon, from 1994 to 1999. Error bars represent 95% confidence intervals; N = 5 for all months and nutrients.

Figure 4. Monthly average concentrations of the cell-wall constituents: neutral detergent fibre (a), acid detergent fibre (b), lignin (c) and ash (d), for both the selected and the neutral diets for Ceratogymna atrata and Bycanistes albotibialis in the Dja reserve, Cameroon, from 1994 to 1999. Error bars represent 95% confidence intervals; N = 5 for all months and nutrients.

Figure 5. Monthly average concentrations of the macronutrients crude protein (a), soluble carbohydrates (b), and fat (c) for both the selected and the neutral diets of Ceratogymna atrata and Bycanistes albotibialis in the Dja reserve, Cameroon, from 1994 to 1999. Error bars represent 95% confidence intervals; N = 5 for all months and nutrients.

Figure 6. Three-month average fraction of hornbill feeding observations where invertebrates were the food item for the study period (1994–1999). Fractions are each month's share of the study year's observations to adjust for varying effort between years. Rainfall (mm) is shown as well to give a sense of the seasonality of invertebrate consumption.
Calcium
If hornbills are selecting their diet for calcium leading up to and during the breeding season, any increase in the calcium concentration of the diet should be apparent by the middle of August. Figure 2 shows that the B. albotibialis selected diet contains significantly more calcium than the neutral in July and August (Student's t, P < 0.05, N = 6, t = 3.26 for July and t = 3.15 for August). The selected diet calcium for Ceratogymna atrata has a similar pattern, rising above the chosen diet for June to August, but not significantly so.
Energy
Once the special need for calcium during egg-laying is over, hornbills should be free to choose a diet appropriate to the next stage of the reproductive process: brooding. Fat represents the majority of the energy in fruit, so we use it here as a proxy for energy (Figure 5). Throughout the year, both species are choosing a diet that is significantly higher in fat than the neutral diet (Student's t, P < 0.05, N = 5, t = 2.8–14.6) except for B. albotibialis in December. This preference becomes highly significant for C. atrata from July to January (Student's t, P < 0.01, N = 5 all months except December where N = 6, t = 5.25–14.6).
Iron
For much of the year, both hornbill species select a diet that is similar in iron to the neutral diet (Figure 3). However starting in September, just as chicks are hatching, there is a rise in iron concentration for both species which becomes significant from August through the end of the year.
Protein
As previously stated, protein is important in the raising of chicks. Figure 5 compares the selected and neutral diet's protein content. From this graph, it appears that hornbills are not generally selecting a high protein fruit diet. The selected diet contains significantly more protein than the neutral only for B. albotibialis in November (Student's t, P < 0.05, N = 5, t = 3.02) and December (Student's t, P < 0.01, N = 6, t = 5.32). The overall average protein intake from fruit is 7.1% for B. albotibialis and 6.61% for C. atrata (Table 2).
Table 2. Dietary requirements for birds (Murphy Reference MURPHY and Carey1996) compared with available nutrients (i.e. neutral diet) as well as nutrients provided by the fruit portion of the diets of Bycanestes albotibialis and Ceratogymna atrata in the Dja reserve between 1995 and 1999. Values are on a dry-mass basis.

However, protein is relatively easily, and commonly, supplemented by the addition of invertebrates to the diet. Although the amount of effort put into observing instances of feeding on invertebrates varied from year to year in this study, making quantitative comparisons difficult, a look at Figure 6 demonstrates a clear pattern. Both hornbill species spend more time foraging for invertebrates during the larger of the two rainy seasons, roughly between August and November. This period is coincident with the period between egg-laying and fledging.
Breeding success
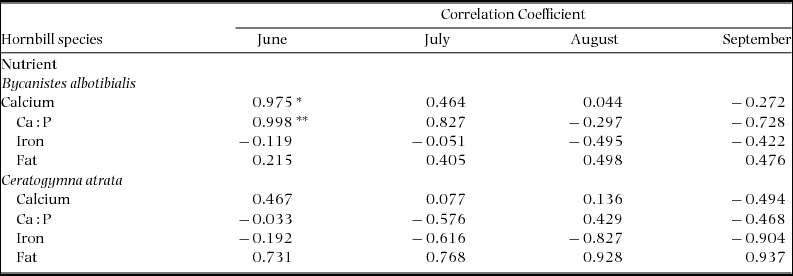
We correlated four nutrient measures in the chosen diet with breeding success calculated as the fraction of nesting starts that fledged at least one chick for June–September, 1994–1997 (Table 3). The number of nesting starts ranged from 0 to 13 for B. albotibialis and 0 to 25 for C. atrata for the 20–50 cavities monitored. Success ranged from 0 to 54% for B. albotibialis and 0 to 67% for C. atrata. The measures correlated are calcium, calcium to phosphorus ratio, iron and fat. Calcium (P < 0.05, Student's t, t = 6.19, N = 4) and Ca:P ratio (P < 0.01, Student's t, t = 22.8, N = 4) in June are significantly correlated with breeding success for B. albotibialis. Fat is positively correlated with breeding success for both species from June through September, although not significantly so.
Table 3. Correlations between the calcium, calcium to phosphorus ratio, iron and fat in the neutral diet and hornbill breeding success. Breeding success data are from Stauffer & Smith (Reference STAUFFER and SMITH2004) and represent data from 1994–1997. Success is calculated as the fraction of nesting starts that fledged at least one chick. Regressions are significant at the 0.05 level (*) and 0.01 (**). N = 4 for all nutrients and months.
DISCUSSION
We developed a pair of indices that use easily collected field data to quantify the nutrient consumption of two hornbill species over several years. By comparing the actual diet of hornbills to a neutral diet reflecting the relative availability of nutrients in the forest, we found that hornbills consume fruit according to the nutritional requirements of breeding, rather than the relative availability of fruit in the forest.
Our indices are based on several assumptions about hornbill diets (e.g. feeding observations reflect the actual mass of fruit consumed by birds), but we are encouraged that the results match expectations based on breeding biology and seasonality. Therefore, while the indices could be rendered more accurate by including additional data, we think they provide a practical way to quantify nutrient consumption of wild animals, and for hornbills, potentially to predict breeding success.
In the Dja, hornbills are actively selecting a diet to meet the mineral and energetic demands of breeding, starting with calcium during egg-laying, and moving to energy, protein and iron for brooding, growth and fledging. However, breeding success was not uniformly high in the Bouamir Research Station in the Dja Reserve between 1994 and 1997 ranging from 0 to 67% for C. atrata and 0 to 54% for B. albotibialis (Stauffer & Smith Reference STAUFFER and SMITH2004). This raises the question of what factors limit breeding success of hornbills in this forest.
Several resources have been reported to limit populations of cavity-nesting birds, including availability of nest cavities, nest predation and nutrient availability (Datta & Rawat Reference DATTA and RAWAT2004, Graveland & Drent Reference GRAVELAND and DRENT1997, Martin Reference MARTIN1987, Reference MARTIN1993; Rendell & Robertson Reference RENDELL and ROBERTSON1994). Within our study area, hornbill reproduction does not appear to be limited by lack of nest cavities or predation; rather, nesting success appears to be tied to fruit availability (Stauffer & Smith Reference STAUFFER and SMITH2004). At a landscape scale, hornbill densities vary strongly by season and hornbills make large range movements to track fruit resources (Anggraini et al. Reference ANGGRAINI, KINNAIRD and O’BRIEN2000, Holbrook & Smith Reference HOLBROOK and SMITH2000, Holbrook et al. Reference HOLBROOK, SMITH and HARDESTY2002, Kinnaird & O’Brien Reference KINNAIRD, O’BRIEN, Dew and Boubli2005). Together, this information suggests that hornbills are limited by food resources, not by nesting sites.
This study suggests that hornbills also track resources at a much finer scale, selecting from the food resources available to them at a given site to meet nutritional needs that change through the year. The diet measures that are candidates for predicting breeding success are the ones that the hornbills actively select: diet calcium, iron and fat (energy). In addition it makes sense to look at the diet calcium to phosphorus ratio since it is considered a better indicator of the calcium available for metabolic uptake than calcium alone (McDowell Reference MCDOWELL2003, Robbins Reference ROBBINS1993). Three of these diet measures appear to be potentially useful as predictors of breeding success in this system. The diet calcium and the calcium to phosphorus ratio are significantly correlated with breeding success for B. albotibialis in June. The fat content of the diet is correlated with breeding success throughout the breeding season for both species, although not significantly so (Table 3). These results suggest that breeding success is most dependent on metabolically available calcium and total energetic content.
It is worth noting that hornbills are not actively choosing a diet with a high Ca:P ratio, as they are with calcium alone (Figure 2). This presents some questions for further study: Where there are two independent nutrients that contribute to an animal's health, what behavioural mechanisms exist to optimize both? In this system, what combinations of fruit are leading to a diet with a high Ca:P ratio in some years and not others and thus to greater breeding success? What is the relative importance of each contributor to breeding success?
Figs (Ficus spp.) have often been considered to be keystone species in tropical systems (Gautier-Hion & Michaloud Reference GAUTIER-HION and MICHALOUD1989, Kinnaird & O’Brien Reference KINNAIRD, O’BRIEN, Dew and Boubli2005, Reference KINNAIRD and O’BRIEN2008; Lambert & Marshall Reference LAMBERT and MARSHALL1991, Leighton & Leighton Reference LEIGHTON, LEIGHTON, Sutton, Whitmore and Chadwick1983, Shanahan et al. Reference SHANAHAN, SO, COMPTON and CORLETT2001, Terborgh Reference TERBORGH and Soulé1986). Specifically, they have been found to have high calcium concentration and Ca:P ratios in a number of systems (O’Brien et al. Reference O’BRIEN, KINNAIRD, DIERENFELD, CONKLIN-BRITTAIN, WRANGHAM and SILVER1998, Wendeln et al. Reference WENDELN, RUNKLE and KALKO2000). In the Dja, the average Ca:P ratio for Ficus spp. in our samples is 6.60 (N = 5) and the average for all non-fig samples is 3.03 (N = 56; Table 4). This is similar to the pattern seen in other systems (O’Brien et al. Reference O’BRIEN, KINNAIRD, DIERENFELD, CONKLIN-BRITTAIN, WRANGHAM and SILVER1998). However, Ficus spp. make up a small percentage of the feeding observations over the study period (0.88% of the C. atrata diet and 5.68% of the B. albotibialis; Appendix 2) and those observations are not concentrated in June and July when calcium is peaking in the observed diet. Therefore, while figs do have a disproportionately high Ca:P ratio and hornbills are eating them in the Dja, they are not a keystone calcium source in this system.
Table 4. Mineral concentrations of fruit samples collected in the Dja Reserve, Cameroon, in 1995 and 1997. Samples were stored in 70% ethanol in the field.

A major assumption made here was the substitution of the proportional representation of each fruit in hornbill diets for the total dry mass of each food item eaten during a time period. Even though feeding observations are relatively simple data to collect in the field, it is not obvious how well they substitute for the actual dry mass of fruit consumed. The fraction of feeding observations is a sample more of how long birds are spending at feeding sites (foraging time, tti) than of how much of their diet that item represents. If we assume that foraging time is a good proxy for dry mass consumed, the system is simplified and estimation of the water content and foraging efficiency is avoided. Differences in foraging efficiency between fruit may be partly compensated for by differences in water content. It is plausible that larger wetter fruits will be more efficiently harvested (i.e. more mass consumed per unit time) than smaller, drier fruits. Thus the product of efficiency and dry mass may be closer to a constant than either alone. To the degree that this is true, the simplification of removing dry mass and foraging efficiency from the calculation will not affect the variance of the result.
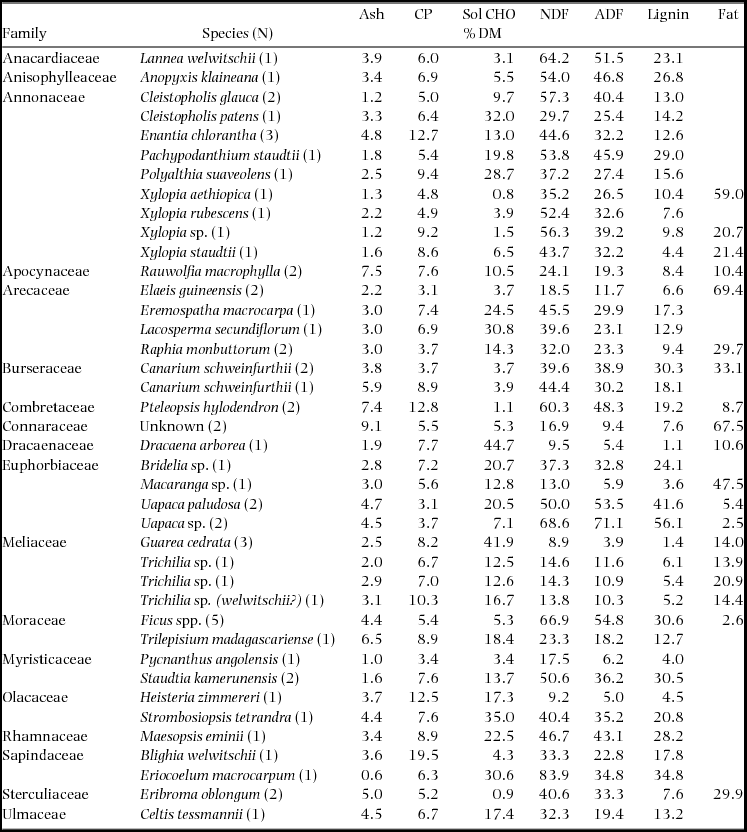
In the Dja, hornbills appear to actively select a diet based on nutritional content, including mineral concentration. They are eating a diet significantly higher in calcium before and during egg-laying and they are then selecting a fruit diet that is significantly higher in fat (energy) and iron through the end of the breeding season while supplementing with invertebrates for protein to feed their young (Table 5).
Table 5. Macronutrient and cell wall constituent concentrations of fruit samples collected in the Dja Reserve, Cameroon, in 1995 and 1997. Samples were stored in 70% ethanol in the field. CP = Crude Protein, Sol CHO = soluble carbohydrates, NDF = Neutral Detergent Fibre and ADF = Acid Detergent Fibre.

The two indices presented in this study show seasonal variation in nutrient flows in the Dja, producing results that match expectations based on known breeding biology and timing. The assumptions of a calorically adequate diet, of consistent nutritional and water content of fruit over time, of the proportionality of foraging time to dry mass consumed, and the proportionality of dbh to fruit production (to name a few) may lessen the precision of the results, but the indices accurately reflect expectations of how these birds will modify their diets to meet seasonal shifts in nutrient and energy demands. We conclude that these indices are useful in making comparisons between the chosen versus neutral diets and for predicting breeding success from seasonal diet data for these tropical avian frugivores.
ACKNOWLEDGEMENTS
We are grateful to the government of the Republic of Cameroon, in particular the Ministry of Environment and Forests (MINEF) and the Ministry of Higher Education and Scientific Research (MINREST), for permission to conduct this research. In particular we wish to thank J. M. Mengang, J.-P. Boyogueno and V. S. Balinga. Financial and logistical support were generously provided by NYZS/The Wildlife Conservation Society, the National Science Foundation Graduate Fellowship Program, the GAANN and MIRT fellowship programmes of San Francisco State University, and ECOFAC Cameroun. For assistance in the field we thank S. Benge, M. Biederman, A. L. Bowersox, B. L. Demarest, F. E. Eanet, C. Gjerdrum, E. R. Hekkala, N. A. Helme, C. Hess, D. A. Kilimnik, M. Kimura, D. LeFer, D. Marnel, T. W. Richardson, M. R. Russell, R. E. Rynning, J. G. Schuetz, A. P. Smyth, D. Sonwa, E. Springborn, J. Witkin, T. A. Worth and G. M. Yanega. Residents of Bifolone and Somalomo, particularly A. Siec, D. Amazieh, J. Mann, M. Mbenge and B. Bokama, generously shared their knowledge of the forest with us. We wish to acknowledge the unique contributions of J.-M. Froment, J.-P. Vautherin, R. C. Fotso, P. Muchaal, S. Weise, B. Brennand, S. Scheffler and T. & H. Hockey.
Appendix 1. Tree-plot data used to generate the model of nutrient availability (Fogiel Reference FOGIEL2007). Average dbh and species density were estimated from surveys of trees greater than 10 cm dbh in two belt transects, 32 40-m2 plots and three 100-m2 plots in 1994.

Appendix 2. Diet of Bycanistes albotibialis and Ceratogymna atrata observed in the Dja reserve, Cameroon during the study period. Observations were taken during daily walks of the trail system at the BRS between December 1994 and December 1999.


