An increasingly common task is to take a set of observations and try to identify the groups that underlie those observations or the different patterns of observations. The observations might be cross-sectional symptoms in which case we look to identify diagnostic categories, either to discover novel categories or to validate existing ones. Or they might be longitudinal symptoms and we want to identify groups of similar trajectories over time. Over the last two decades, the number of techniques for doing tasks like these has been considerably expanded and made available as software. One of the earliest and simplest techniques is latent class analysis (LCA).
An LCA attempts to identify a latent categorical variable (or possibly variables) which underlies the relationships between observed or manifest variables which also have to be categorical. The levels of the categorical variable are called classes.
When we describe classes as underlying a set of observations we tend to mean that the classes ‘cause’ the similar-looking patterns of observations or associations between observations (the tendency of certain observations to go together). The LCA model says that we have identified a class when within that class there is no association between observations. For example, we find that complaints of headaches are accompanied by complaints of feeling nauseous. Suppose we are able to split the sample into somatisation and non-somatisation classes and find within each class that complaints of nausea are no more less common whether someone complains of headaches or not. Somatisation, we can then say, explains the association. Of course people in the somatisation class will be much more likely to report both headaches and nausea, but no more so than would be expected from the higher rates of nausea and headaches in that class.
We can think of fitting an LCA model as partitioning the sample into groups in which there is no association between the variables. There might not be any partition which does the job and even in a successful LCA some associations will usually remain, but nevertheless that is the goal.
LCA is sometimes described as a mixture analysis, conveying the idea that what is observed is the product of mixing together responses from different kinds of people. If LCA is a mixture of categorical responses you might expect there to be other types of mixtures and indeed there are: for example, a mixture of continuous responses from different kinds is called a latent profile analysis.
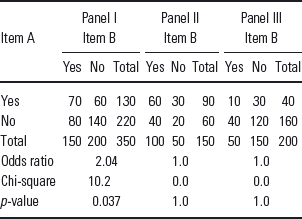
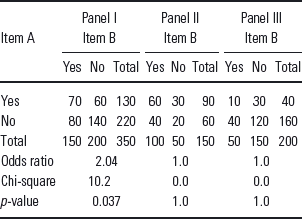
Consider the data in panel I of Table 1 which show the relationship between two items which have been answered ‘Yes/No’. The association–expressed as an odds ratio–is 2.04 and the chi-square test indicates that it is significant. (The odds ratio of ‘Yes’ on item B for those who said ‘Yes’ on item A is 70:60 = 1.167. The odds ratio for those who said ‘No’ is 80:140 = 0.571. Hence the odds ratio is 1.167/0.571 = 2.04.) It is this association that one would like to explain. If there were no association, then both those reporting ‘Yes’ on item A and those reporting ‘No’ would be equally likely to report ‘No’ (or ‘Yes’) on B.
Table 1 Cross-tabulated responses to two-items for total sample (panel I) and two underlying classes (panels II and III). See text for further details

Consider now the data in panels II and III which report responses to the two items split up by a known factor–let us say male and female. For both of these panels, there is no association (the odds ratio is 1.0 and the chi-square test is quite non-significant). As you might have noticed, panel I is just the composite of the other two panels–the association in I is the result of combining the two other tables and we would say that it is explained by the factor which defines II and III, namely sex.
Now imagine doing an LCA on panel I data (technically one cannot do an LCA on only two items) and discovering the two underlying classes corresponding to panels II–III. With no association between items, we would have the hoped-for LCA solution. Our task then would be to characterise these two classes by looking at other variables–in this case we assume that we find that the classes largely correspond to sex, but such a straightforward relationship is most unlikely.
The key output from an LCA provides for each class (i) the proportion of people falling into that class and (ii) for each variable the probability that an individual in that class will respond on that variable. In Fig. 1, we show some hypothetical results for a two-class solution. The left-hand side shows classes for which the profiles of probabilities are more or less parallel. In the psychiatric literature such profiles tend to be interpreted as indicating severity and thus are often not seen as really equating to classes in the sense of different types. The right-hand side shows more class-like profiles with neither class having the highest (lowest) probabilities for all the variables.

Fig. 1 Hypothetical results from two LCA with two-class solutions obtained for three items.
As a larger example we will look at some symptom data from primary care patients. For this example, we will define six items as present/absent: (i) nervous or anxious; (ii) depressed; (iii) not coping; (iv) sleep problems; (v) skeletal pain and (vi) cognitive problems. Two preliminary points are first, that the solution is very dependent on how the items are scored; here we have used a high threshold.
Second, the number of classes retained has been done for convenience; statistical criteria for retention would point towards more classes.
The five-class solution is shown in Fig. 2. As is often the case in a heterogeneous and relatively well sample, the largest class (75.3%) is an asymptomatic class, comprising people who are unlikely to have any of the symptoms–a number of course will have a symptom, but in general the probability of individual symptoms is quite low and the probability of no symptoms is fairly high. If the analysis had been carried out on people who have a diagnosis or have been selected out on the basis of screening items, one would not expect an LCA to identify such an asymptomatic class. A second class, which again is quite usual, is a small (4.8%) polysymptomatic class, comprising people who are likely to have many symptoms. A third class (11.4%) is sleep and pain, a clustering of problems that is not surprising in a primary care sample. A fourth class (4.1%) adds cognition to sleep and pain. Finally, a fifth class (4.4%) is perhaps a mild neurosis or anxiety and depression class. On another view, however, it could just be a less severe version of the polysymptomatic class.

Fig. 2 Results for a five-class LCA solution in a large sample of primary care patients. See text for further details.
If the solution seems less than clear (i.e. messy) and hard to make sense of, then to our mind that is a useful point–real-life LCA is often like that and clean solutions require high attention to the measurements being made and the samples being analysed.
Having identified these classes, it is possible to assign individuals to their most likely class and then to examine for other features (e.g. service utilisation, medication usage and past psychiatric history) which might help us to understand these classes.
To date all examples have used binary variables. Although this is not necessary (you can have variables with 3, 4 or more levels) in practice these become difficult to interpret, particularly if the variables are measures of severity.


