


Introduction
Cholangiocarcinoma (CHCA) is a major public health issue in southeast Asian countries, including Thailand (Banales et al., Reference Banales, Marin, Lamarca, Rodrigues, Khan, Roberts, Cardinale, Carpino, Andersen, Braconi, Calvisi, Perugorria, Fabris, Boulter, Macias, Gaudio, Alvaro, Gradilone, Strazzabosco, Marzioni, Coulouarn, Fouassier, Raggi, Invernizzi, Mertens, Moncsek, Rizvi, Heimbach, Koerkamp, Bruix, Forner, Bridgewater, Valle and Gores2020). The human liver fluke Opisthorchis viverrini (Ov) and nitrosamine compounds contaminating native foods have been identified as independent risk factors for CHCA (IARC, 1994). Chronic inflammation caused by Ov infection generates reactive oxygen and nitrogen species which damage DNA, over time resulting in oncogenic mutations in cholangiocytes, ultimately resulting in CHCA (Murata, Reference Murata2018). Early detection of Ov is the key to preventing CHCA. Unfortunately, both opisthorchiasis and early-stage CHCA remain challenging diagnoses due to their asymptomatic nature (Mairiang, Reference Mairiang2017). Therefore, novel diagnostic methods for both Ov and CHCA remain highly desirable. In this study, new diagnostic method through the detection of host response proteins instead of the conventional detection of parasite antigens and specific antibodies has been proposed for the detection of Ov infection and CHCA. Ov infection not only causes inflammation, but also causes accumulated DNA damage and triggers proliferation in the bile duct epithelial cells (Murata, Reference Murata2018). Previous studies have identified AKT and ERK, the downstream signalling molecules found in the phosphatidylinositol 4,5-bisphosphate 3-kinase (PI3K) signalling pathway, as stimulating factors in cholangiocyte proliferation (Yothaisong et al., Reference Yothaisong, Dokduang, Techasen, Namwat, Yongvanit, Bhudhisawasdi, Puapairoj, Riggins and Loilome2013). The PI3K signalling pathway itself was also demonstrated to be elevated in CHCA tissue and cell lines, suggesting its involvement in carcinogenesis. Several other signalling pathways in CHCA have been identified and investigated, such as the PI3K/AKT/mTOR (Leelawat et al., Reference Leelawat, Udomchaiprasertkul, Narong and Leelawat2010; Dokduang et al., Reference Dokduang, Juntana, Techasen, Namwat, Yongvanit, Khuntikeo, Riggins and Loilome2013; Ewald et al., Reference Ewald, Grabinski, Grottke, Windhorst, Norz, Carstensen, Staufer, Hofmann, Diehl, David, Schumacher, Nashan and Jucker2013; Sang et al., Reference Sang, Li, Li and Liu2015; Yothaisong et al., Reference Yothaisong, Namwat, Yongvanit, Khuntikeo, Puapairoj, Jutabha, Anzai, Tassaneeyakul, Tangsucharit and Loilome2017; Zhao et al., Reference Zhao, Luo, Cheng, Yu, Chen, Xiao, Xiang, Feng, Fu, Duan, Yao, Xia, Tao, Wei and Dai2018; Klungsaeng et al., Reference Klungsaeng, Kukongviriyapan, Prawan, Kongpetch and Senggunprai2019; Pei et al., Reference Pei, Liu, Cheng, Wu and Liu2019; Shen et al., Reference Shen, Zhang, Zhang, Feng, Wang, Li, Jiang and Li2019), Ras/MAPK, JAK/STAT, Wnt/bet-actenin (Dokduang et al., Reference Dokduang, Juntana, Techasen, Namwat, Yongvanit, Khuntikeo, Riggins and Loilome2013), and JNK/c-Jun and RAF/MEK/ERK (Zhao et al., Reference Zhao, Luo, Cheng, Yu, Chen, Xiao, Xiang, Feng, Fu, Duan, Yao, Xia, Tao, Wei and Dai2018). These pathways have been shown to result in the stimulation of cell proliferation, inhibition of cell growth, cell apoptosis, and resistance to chemotherapeutic agents. The PI3K/AKT/mTOR and ERK pathways were especially reported in tissues and cell lines of studies involving liver fluke induced-CHCA (Leelawat et al., Reference Leelawat, Udomchaiprasertkul, Narong and Leelawat2010; Dokduang et al., Reference Dokduang, Juntana, Techasen, Namwat, Yongvanit, Khuntikeo, Riggins and Loilome2013; Yothaisong et al., Reference Yothaisong, Namwat, Yongvanit, Khuntikeo, Puapairoj, Jutabha, Anzai, Tassaneeyakul, Tangsucharit and Loilome2017). PIK3CB, a kinase enzyme (EC:2.7.1.153), phosphorylates phosphatidylinositol to generate phosphatidylinositol 3,4,5-trisphosphate (PIP3). PIP3 is a key molecule in the PI3K signalling pathway as it activates the downstream cascade of signalling molecules resulting in cell metabolism, cell growth, cell proliferation, cell apoptosis, and cell cycle progression (Ersahin et al., Reference Ersahin, Tuncbag and Cetin-Atalay2015). PIK3CB has been characterised as a class IA heterodimer consisting of a catalytic subunit phosphatidylinositol 4,5-bisphosphate 3-kinase catalytic subunit beta (p110β) with a total of 1070 amino acids, and commonly interacts with p85 regulatory subunits including p85 alpha, p55 alpha, p50 alpha, and p85 beta. PIK3CB contains several domains including the regulatory subunit binding domain (amino acids 26–115), the Ras-binding domain (amino acids 194–285), the membrane-binding PI3K-type C2 domain (amino acids 327–496), the helical domain (amino acids 524–701), and the phosphorylated phosphoinositides on the 3-hydroxyl group of the inositol ring domain (amino acids 800–1067) (Singh et al., Reference Singh, Dar and Dar2016). PI3K is an intracellular protein, commonly expressed and localised in the nucleus and cytoplasm of cells (Kumar et al., Reference Kumar, Redondo-Munoz, Perez-Garcia, Cortes, Chagoyen and Carrera2011). Additionally, PI3K signalling pathways are believed to play a role in Ov infections and the carcinogenesis of cholangiocytes. Mechanisms resulting in the release of intracellular PIK3CB into the bloodstream are still unclear, although it has been suggested that cellular proteins are released into bloodstream in tandem with apoptosis, necrosis, or mitotic catastrophes (Roninson et al., Reference Roninson, Broude and Chang2001). When released, PIK3CB remains undigested or digested into short peptides by plasma protease enzymes, theoretically allowing for the detection of PIK3CB circulating in the bloodstream by indirect ELISA. In this study, PIK3CB levels in plasma phosphoproteomes was evaluated using indirect ELISA for their suitability as biomarkers for the diagnosis of Ov infections and CHCA.
Materials and methods
Subjects and sample preparation
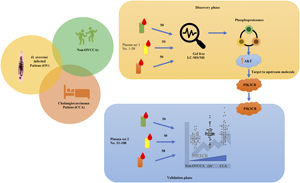
This study was approved by Human Ethics Committee of Udon thani Cancer Hospital, Udon Thani, Ministry of Public Health, Thailand (UCH-CT 6/2558 and UCH-CT 11/2563). Physical examination, stool exams for Ov eggs, ultrasonography, and histopathology were used to determine each subject's baseline health. According to their health status, the subjects were divided into three groups each consisting of 300 subjects; the non-Ov infection and non-CHCA group (non-OVCCA) the Ov infected group (OV), and the CHCA group (CCA). Healthy subjects in the control, non-OVCCA group, were defined as a physical examination negative for jaundice, hepatomegaly and abdominal tenderness, as well was stool examination negative for parasites. Subjects with Ov eggs found in their stool, but a normal bile duct and liver on ultrasonography were assigned to the OV group. Subjects in the CCA group had hepatomegaly and/or jaundice on physical examination, as well as a positive screening for CHCA via ultrasonography and a histopathologically confirmed liver biopsy. All subjects had their blood collected from their median cubital vein using EDTA blood tubes. Plasma samples were then prepared by spinning the blood samples at 3000 × g for 10 min. The plasma samples were then stored at −80°C until they were used. In each group, 50 plasma samples were randomly selected for the detection of plasma phosphoproteomes using liquid chromatography-tandem mass spectrometry (LC-MS/MS) The other 50 plasma samples were selected for the detection of plasma phosphatidylinositol 4,5-bisphosphate 3-kinase catalytic subunit beta isoform (PIK3CB) using indirect ELISA. Characteristics of the recruited subjects were shown in Table 1.
Table 1. Characteristics of recruited subjects

Sample preparation for gel-free-based proteomics
Plasma protein concentrations were determined using the Lowry assay (DC Protein Assay, Bio-Rad). Phosphorylated proteins from plasma were enriched (Pierce™ Phosphoprotein Enrichment Kit), and then centrifuged at 1000 × g for 1 min at 4°C was used to remove, wash, and elute the solution in all steps. A total of 0.5 mg mL−1 plasma protein was then applied to the column resin, incubated for 30 min while under constant agitation (for binding), before being washed with a lysis/binding/washing buffer for a total of 3 times. To elute the phosphoprotein, 1 mL of elution buffer was added to the sample, before incubating and agitating the sample for 3 min, after which the sample was then centrifuged. Finally, the flow-through solution was used for gel-free digestion. Gel-free digestion or in-solution-based LC-MS/MS was used in this study. 5 μg of enriched plasma phosphoprotein were pelleted, dried, and dissolved in 10 mm of ammonium bicarbonate. The reduction of sulphhydryl bonds was performed by mixing the enriched sample, 10 mm dithiothreitol (DTT), and 10 mm ammonium bicarbonate at 56°C for 1 h. Alkylation of protein sulphhydryl groups was then performed by adding in 100 mm iodoacetamide (IAA) along with a 10 mm ammonium bicarbonate solution at room temperature for a total of 1 h complete darkness. To perform digestion, 250 ng sequencing grade trypsin was added to the solution and incubated at 37°C for 8 h. The tryptic peptides were finally dried at 45°C under vacuum and protonated with 0.1% formic acid before injection into the LC-MS/MS.
Label-free proteomic quantification and data interpretation
The digested peptide mixtures were analysed using LC-MS/MS (Waters SYNAPT HDMS™ system, Waters, MA, USA) by using the 1D-nanoLC system (Waters nanoACQUITY UPLC system, Waters, MA, USA). The 100 ng equivalent of digested peptide was injected onto the RP analytical column (20 cm × 75 μm), then packed with 1.7 μm bridged ethyl hybrid (BEH) C18 material (Waters, MA, USA). LC conditions were as follows: mobile phase A and B were used, with mobile phase A composed of 0.1% formic acid in water while mobile phase B was composed of 95% acetonitrile with 0.1% formic acid. A linear gradient separated according to a 30-min wait from 10–45% B from the nano-LC system at a constant flow rate of 350 nL min−1. The analytical column was regenerated at 85% of mobile phase B for 5 min and re-equilibrated at 10% of mobile phase B for 15 min. Full scan mass spectra (MS) were acquired from m/z 350 to 1800. The eluted peptides were then electrosprayed into a mass spectrometer (Synapt HDMS) for MS/MS analysis. The raw LC-MS/MS spectra was then analysed by DataBridge to convert all spectra to TXT data format.
Bioinformatics
LC-MS/MS datasets for label-free quantification were performed. Relative comparisons of peak intensities were analysed using DeCyder MS Differential Analysis software (Johansson et al., Reference Johansson, Samskog, Sundstrom, Wadensten, Bjorkesten and Flensburg2006). Peak detection (signal/noise ratio < 2) and peak matching (peptide ion peak alignment) was calculated using the Batch and Pepmatch module in the DeCyder MS Differential Analysis software. To identify the peptide, MS/MS peak lists from the Pepmatch module (DeCyder MS Differential Analysis software) were exported to the Mascot generic format (.mgf file format) and analysed by using the Mascot software (Matrix Science, London, UK) (Perkins et al., Reference Perkins, Pappin, Creasy and Cottrell1999). The dataset of MS/MS peak lists was searched against the Homo sapiens (NCBI database, 115 529 sequences) for protein identification using trypsin as the digesting enzyme, and a maximum of three missed cleavages, a MS peptide tolerance of 0.6 Da, a MS/MS peptide tolerance of 0.1 Da, carbamidomethylation modification of cysteine residue as a fixed modification, and the oxidation of methionine and acetylation of the protein N-terminus as variable modifications. Analysis of variance (ANOVA) was performed using PepMatch modules, DeCyderMS program. Three independent replicates were analysed and expressed as a mean ± standard deviation. For statistically significant differences, Duncan's multiple range test was used (P < 0.05).
Identification of opisthorchiasis viverrini and cholangiocarcinoma-related phosphoproteins
The GI numbers (GenInfo Identifier, NCBI) of plasma phosphoproteome-derived proteins of non-OVCCA, OV, and CCA were used for Venn diagram analysis by using Jvenn (http://jvenn.toulouse.inra.fr/app/index.html) (Bardou et al., Reference Bardou, Mariette, Escudie, Djemiel and Klopp2014). In this study, OV- and CCA-specific proteins (presented protein) were identified by Venn diagram including comparisons of OV vs non-OVCCA and CCA vs non-OVCCA phosphoproteomes. The GI number retrieving UniProt ID of OV and CCA-specific proteins were then obtained (http://www.uniprot.org/uploadlists) (UniProt, Reference UniProt2019). Protein−protein interactions were observed using STRING (https://string-db.org/) (Szklarczyk et al., Reference Szklarczyk, Morris, Cook, Kuhn, Wyder, Simonovic, Santos, Doncheva, Roth, Bork, Jensen and von Mering2017) to predict the Ov infection and cholangiocarcinogenesis-related proteins and to identify the potential biomarker for Ov infection and CHCA.
Indirect enzyme-linked immunosorbent assay
Antibodies specific to p110β were used to investigate PIK3CB in plasma (sc-376641, Santa Cruz). Selected antibodies specific to amino acid 2–31 of PIK3CB was used. All plasma samples were tested by ELISA in duplicates. Each plasma sample was diluted to 1:50 in a 100 μL coating buffer (100 mm NaHCO3, pH 8.5) then added into 96-well plate (Maxisorp, NUNC) before finally being incubated at 4°C overnight. To analyse plasma dilution effects, plasma was diluted in a coating buffer of 1:50 to 1: 102 400. The plate was washed using a 300 μL washing buffer (PBS: 140 mm NaCl, 2.6 mm KCl, 12 mm Na2HPO4, 1.2 mm KH2PO4 pH 7.4, and 0.05% Tween®20) three times with a microplate washer (APW-100, Allsheng, Hangzhou, China). The plate was then blocked for non-specific binding by adding 200 μL of 5% skim milk (HiMedia) in PBS and incubating for 1 h at room temperature. 100 μL of 1:1000 diluted anti-PIK3CB mouse monoclonal antibodies (sc-376641 [C-8], Santa Cruz Biotechnology, Inc., TX, USA) in an antibody diluent (1% skim milk in PBS) was then added to the wells before incubating the plate for another 1 h at room temperature. The plate was then washed before adding 100 μL of 1: 10 000 diluted rabbit anti-mouse IgG HRP conjugate (ab97046, Abcam, Cambridge, UK) in antibody diluent and incubating the plate for another 1 h at room temperature. After washing, 100 μL of 0.1 mg mL−1 TMB substrate (3,3′,5,5′-tetramethylbenzidine, Sigma-Aldrich, Merck, Darmstadt, Germany) diluted in 0.05 M citrate phosphate buffer at pH 5.0 and 2 μL of 30% H2O2 (Merck, Darmstadt, Germany) was added and then incubated at room temperature for 20 min in complete darkness. ELISA samples were then measured for absorbance at 450 nm, with background noise subtracted using absorbance at 540 nm (Varioskan® Flash, Thermo Fisher Scientific, Vantaa, Finland). Average ELISA absorbances were then used for graph plots, statistical analyses, and the calculation of diagnostic parameters. Furthermore, to ensure consistency, eight plasma samples of each group were evaluated with indirect ELISA via a two-fold dilution from 1:50 to 1: 102 400. The average absorbance of each group was then calculated and used to plot the dilution effect and matrix effects of plasma dilution. To preserve the linearity of the test, 1.2 pg to 10 μg of peptide amino acids 2–31 (3.212 kDa) of PIK3CB (122.763 kDa) was used as an antigen for indirect ELISA.
Graph plot and data analysis
Statistical analysis was performed using IBM SPSS Statistics for Windows, version 22.0. (IBM Corp, Armonk, NY, USA). The normal distributions of ELISA values were determined using the Kolmogorov−Smirnov test along with a normal Q−Q plot. Data were trimmed by removing seven outliers (one of OV and six of CCA group) beforehand. The ELISA values of each group were analysed for statistically significant differences using one-way ANOVA and Scheffe post-hoc analysis. The dot plot and area under the ROC curve (AUC) was analysed using GraphPad Prism (GraphPad Prism version 9.1.2 for macOS, GraphPad Software, CA, USA). The diagnostic parameters, sensitivity, specificity, positive likelihood ratio (PLR), negative likelihood ratio (NLR), positive predictive value (PPV), negative predictive value (NPV), and accuracy were calculated using MEDCALC online (https://www.medcalc.org/calc/diagnostic_test.php).
Western blot analysis
Three plasma samples from each group were randomly selected to examine the magnitude of circulating PIK3CB using Western blot analysis. The plasma proteins were size-separated using SDS-PAGE and transferred to a polyvinylidene fluoride (PVDF) membrane (SureCast Gel Handcast System, Invitrogen, CA, USA). A measure of 50 μg of plasma using Lowry's method (DC protein assay, Bio-Rad) was denatured by adding a 2 × loading buffer and heating the sample to 95°C for 10 min, before ice-shocking and loading it onto a SDS-PAGE system (Novex™ WedgeWell™ 12% Tris-Glycine Gel, Thermo Fisher Scientific, CA, USA), and electro-separating the sample at 200 V for 45 min along with a protein size standard (Tricolor Broad Range Prestained Protein Ladder, Vivantis, Selangor, Malaysia). The separated proteins were then transferred to the PVDF membrane (Immun-Blot® PVDF Membrane, Bio-Rad Laboratories, CA, USA) by applying a voltage of 20 V for 1 h. The efficiency of protein transfer was illustrated by Ponceau S staining. The stained membrane was washed with water, then incubated in a blocking solution (5% skim milk in TBS) for 1 h with continuous agitation. The blocking solution was removed and a mixture of 1:500 anti-PIK3CB antibody, 1: 100 000 anti-actin antibody (housekeeping control) diluted in antibody diluent (5% skim milk in TBS) was added for incubation overnight. The membrane was washed 3 times with TBST (TBS with 0.2% Tween®20) for 10 min each with constant agitation, followed by incubation with 1: 100 000 HRP-anti-mouse IgG conjugate for 1 h with constant agitation. The membrane was washed again for 3 times with TBST before adding a chemiluminescence ECL substrate (ECL Prime Western Blotting Detection Reagent, Cytiva). The intensity of chemiluminescence was measured using gel documentation (Amersham Imager 600, GE healthcare) and Image Quant TL v8.1.
Results
Plasma phosphoproteome profiles and differential plasma phosphoproteins
After analysis of plasma phosphoproteomes of non-OVCCA, OV and CCA by gel-free-based LC-MS/MS, a total of 903 phosphoproteins were identified. The highest number of identified phosphoproteins was found in the CCA group while the lowest was found in the OV group, at 855, 778, and 872 in the non-OVCCA group, the OV group and the CCA group, respectively. Supplementary Table 1 contains the summarised LC-MS/MS data of phosphoproteins. Protein−protein interactions calculated via STRING was used to predict related cell signalling pathways. From OV-specific phosphoproteins, networks associated with PHLPP1/AKT/mTOR, histone modification, transcriptional factors were predicted by STRING after adding three node steps (Fig. 1). However, the deactivators of AKT/mTOR pathway i.e. PHLPP1 and PKC, transcriptional factors of dephosphorylation, cell apoptosis and tumour suppression, as well as targets in the hippo signalling pathway, were also linked to the networks. This suggests that the AKT/mTOR pathway was initially activated during the Ov infection, but were still under regulation by cellular processes such as apoptosis and tumour suppression. For the CCA-specific phosphoproteins, only networks of DNA replication and cell cycle regulation, transcriptional factor and spliceosomes, and cytoskeletal proteins are shown (Fig. 2). Only networks of cell signalling proteins via cytoskeletal and cell adhesion were linked, although five more node steps were added. However, the DNA replication and cell cycle, transcriptional factors, and mRNA spliceosomes were clustered within the network. These results suggest that cell apoptosis and tumour suppression-related proteins were suppressed. Different OV and CCA plasma phosphoproteomes in the AKT/mTOR signalling pathway such as PIK3CB, should be further investigated for potential as novel biomarkers in the differentiation of Ov and CHCA in clinical scenarios. It can be surmised that PIK3CB, an upstream signalling molecule in the AKT/mTOR pathway, was selected and validated as a diagnostic target for Ov infections and CHCA. For the non-OVCCA-specific phosphoproteins, there were no protein−protein interaction networks predicted.

Fig. 1. Protein−protein interaction of up-regulating plasma phosphoproteins of OV by STRING.

Fig. 2. Protein−protein interaction of up-regulating plasma phosphoproteins of CCA by STRING.
Indirect ELISA
The average absorbance values of each group (non-OVCCA, OV and CCA) were calculated from each duplicate. Mean ± s.d. absorbance values of the non-OVCCA, OV, and CCA were 1.386 ± 0.368, 1.772 ± 0.314 and 1.855 ± 0.539, respectively, as shown in Supplementary Table 2. The dot plot of absorbance values for each group was plotted (Fig. 3). One-way ANOVA revealed that at least two groups were different (P < 0.01). Scheffe test for multiple comparisons found that the mean value of absorbance of the non-OVCCA group was significantly different from the OV group (P < 0.01; 95% CI: 0.170–0.602) and the CCA group (P < 0.01; 95% CI: 0.259–0.679). However, there were no significant differences between the OV group and the CCA group (P = 0.64; 95% CI: −0.133 to 0.299; Fig. 3). The AUC was 0.7446 and 0.7634 for OV (Fig. 4) and CCA (Fig. 5), respectively. The sensitivity and specificity for absorbance values in the OV group using >1.570 OD450 as a cut-off was at 76 and 72%, respectively. Sensitivity and specificity for the absorbance values in the CCA group using OD450 as a cut-off at >1.398 was 68 and 76%, respectively (Table 2). Furthermore, the OV group and the CCA group could be differentiated from the non-OVCCA group with 73% sensitivity and 74% specificity when using OD450 >1.579 as a cut-off (Table 2).

Fig. 3. Box plot of absorbance value of indirect ELISA of plasma PIK3CB. Each circle or triangle is an absorbance of each subjects. The absorbance value is shown in the Y-axis. Black line indicates mean of absorbance of each group. White circle, black circle and triangle are non-OVCCA, OV, and CCA, respectively. The asterisk (*) and NS indicates P < 0.01 and non-significance.

Fig. 4. The AUC of non-OVCCA vs OV. The sensitivity% (Y-axis) is plotted against 100%-specificity% (X-axis) and the AUC is calculated to determine the ability to distinguish between non-OVCCA and OV.

Fig. 5. The AUC of non-OVCCA vs CCA. The sensitivity% (Y-axis) is plotted against 100%-specificity% (X-axis) and the AUC is calculated to determine the ability to distinguish between non-OVCCA and CCA.
Table 2. Summary of diagnostic parameters of PIK3CB

Effects of plasma dilution on PIK3CB ELISA
The matrix effect was also studied in this experiment, with the absorbance values of each sample dilution and the average absorbance values of each group summarised in Supplementary Table 3. The absorbance patterns obtained from a 1:50 to 1:102400 dilution was found to have the highest dilutional consistency in the CCA group. Conversely, the non-OVCCA group was found to have the lowest dilutional consistency (Fig. 6). These results indicate that the patterns of PIK3CB was not affected by the dilution of plasma, but instead the absorbance values of the matrix effect itself. This matrix effect was observed in all groups. The optimal dilution of plasma for the detection of PIK3CB varied from 1:50 to 1:102400. However, the maximum absorbance for all experimental groups was found to be at 1:1600. The differences in absorbance at 1:50 and 1:1600 in the non-OVCCA group, the OV group, and the CCA group was found to be at 1.1850 (1.0989–2.2839), 1.5701 (1.0931–2.6632), and 1.0284 (1.7618–2.7902), respectively (Fig. 6).

Fig. 6. Effect of plasma dilution on PIK3CB indirect ELISA. Each circle is an absorbance of each subject. The absorbance value is shown on the Y-axis. Each circle indicates the mean of absorbance of each group. Black circle, X-circle and white circle are non-OVCCA, OV, and CCA.
Linearity of the PIK3CB measured by indirect ELISA
The linearity of indirect ELISA was tested using 1.2 pg to 10 μg of epitope peptide amino acid 2–31 and anti-PIK3CB antibody. The log10 peptide amount was plotted against an absorbance of 450 nm. The linear equation: (OD450–2.5829)/1.3337 was derived. The results demonstrated that the linearity of indirect ELISA of PIK3CB was 20 to 300 ng of peptide or equivalent to 0.7–11.5 μg of PIK3CB (Fig. 7).

Fig. 7. Linearity of the PIK3CB by indirect ELISA. The log amount of PIK3CB peptide (X-axis) was plotted against the absorbance at 450 nm (Y-axis).
Verification of circulating PIK3CB in plasma
The protein size of plasma PIK3CB was evaluated to ensure the integrity of anti-PIK3CB antibody to the form of circulating PIK3CB in human plasma. A positive band of approximately 110 kDa was observed. This indicated that plasma PIK3CB was of full length in all groups. Plasma PIK3CB was not truncated or digested by plasma proteinase enzymes and circulated as a mature 110 kDa protein in all groups (Fig. 8). The PIK3CB bands in the plasma samples from OV and CCA patients were found to be at higher levels compared to plasma samples of non-OVCCA subjects, at a 1.1-fold and 3.6-fold concentration, respectively (Fig. 8).

Fig. 8. Western blot analysis of plasma PIK3CB. The plasma non-OVCCA, OV and CCA was denatured, size separated on SDS-PAGE, blotted and detected by anti-PIK3CB antibody. A positive signal of 110 kDa protein band was detected.
Discussion
It is known that the activation of AKT/mTOR signalling pathway promotes cell proliferation and cell survival in CHCA (Yothaisong et al., Reference Yothaisong, Dokduang, Techasen, Namwat, Yongvanit, Bhudhisawasdi, Puapairoj, Riggins and Loilome2013), PI3K, the upstream signalling molecule of AKT/mTOR, has previously been reported for its association with CHCA (Moolthiya et al., Reference Moolthiya, Tohtong, Keeratichamroen and Leelawat2014). Stimulation of PI3K enzymes by receptor protein-tyrosine kinases (RTKs) leads to the phosphorylation of PI(4,5)P2 into PI(3,4,5)P3, as well as the activation of AKT and mTOR (Carnero and Paramio, Reference Carnero and Paramio2014). This process inhibited by PHLPP1 and PHLPP2 dephosphorylate AKT at Thr308 and Ser473 (Brognard et al., Reference Brognard, Sierecki, Gao and Newton2007), preventing uncontrolled cell proliferation and survival. The OV and CCA plasma phosphoproteomes showed up-regulation of PHLPP1. However, the interaction between PHLPP1 and AKT has only been predicted in OV, suggesting that PHLLP1 attempts to inhibit AKT during Ov infections.
The results of this study strongly suggests that AKT/mTOR signalling pathway are stimulated and play an active role during Ov infections such as the stimulation of cell proliferation, transcriptional activation, and modification of the cellular cytoskeleton. However, the inhibition of AKT by dephosphorylation of PHLLP1 was highly implicated in the inhibition of cholangiocarcinogenesis. The hippo signalling pathway was also found to play a similar role through the stimulation of cell apoptosis and tumour suppression pathways. Therefore, alternative pathways such as through changes to the cytoskeleton and cell adhesion-related signalling pathways, stimulation of DNA replication and cell cycle dysregulation, and activation of transcriptional factor and spliceosome of mRNA splicing may play a more significant role in cholangiocarcinogenesis compared to AKT/mTOR signalling itself. However, these exact mechanisms require further study, especially through the prediction of protein interactions.
PI3K class I enzymes including PIK3CA and PIK3CB are responsible for the phosphorylation of PI(4,5)P2 to PI(3,4,5)P3. Aberrant PIK3CA proteins have been reported in many cancers including CHCA (Sohal et al., Reference Sohal, Shrotriya, Abazeed, Cruise and Khorana2016), whereas PIK3CB less frequently so. Recent in vitro studies demonstrated that the AKT/mTOR signalling pathway in CHCA could be activated by carcinogenic liver flukes i.e. Ov and Clonorchis sinensis (Cs) (Daorueang et al., Reference Daorueang, Thuwajit, Roitrakul, Laha, Kaewkes, Endo and Thuwajit2012; Wang et al., Reference Wang, Lei, Tian, Shang, Wu, Li, Zhao, Shi, Tang, Chen, Lv, Huang, Tang, Yu and Li2017). The investigation of suspected upstream signalling molecules showed that the plasma PIK3CB was significantly increased in Ov infected (OV) and CHCA patients (CCA). Therefore, detection of plasma PIK3CB should be useful for the early diagnosis of Ov infection and CHCA.
Although several methods for diagnosing Ov infections with high sensitivity and specificity, such as the detection of coproantigens, the detection of specific antibodies in human sera, plasma, and urine, or the detection of DNA in faeces, there are currently no commercial kits available for the diagnosis of this disease. This is due to commercial limitations such as the difficulty in scaling-up the production of animal-produced parasite antigens or antibodies. Therefore, host response proteins were used as an alternative to parasite antigens or specific antibodies in this study. The ELISA results revealed that absorbance values of antibodies specific to the N-terminal amino acid 2–31 of PIK3CB (C-8, Santa Cruz) was significantly higher in the OV group and the CCA group compared to the non-OVCCA group. This difference can be used to differentiate healthy patients from Ov-infected or cancerous patients. Furthermore, ELISA results suggested that PIK3CB was stimulated by Ov infections and CHCA. Due to the increased amount of circulating PIK3CB in the bloodstream of OV and CCA patients, it is hypothesised that indirect ELISA can be used to detect plasma PIK3CB, and thus, diagnose patients with these diseases. Regarding the plasma dilution effect on absorbance values, the titre 1:3200 was the highest. Thus, the binding of antibodies to PIK3CB may be affected by the matrix effect. Therefore, the direct measurement of plasma PIK3CB concentrations still remains inefficient, and requires further optimization. PIK3CB circulates in plasma as full-length 110 kDa proteins in all groups, and is unaffected by plasma proteinase enzymes as shown by Western blot analysis. Previous studies have demonstrated that the PI3K signalling pathway can be activated in vitro by OV28GST and Cs granulin (Daorueang et al., Reference Daorueang, Thuwajit, Roitrakul, Laha, Kaewkes, Endo and Thuwajit2012; Wang et al., Reference Wang, Lei, Tian, Shang, Wu, Li, Zhao, Shi, Tang, Chen, Lv, Huang, Tang, Yu and Li2017). In vivo evidence of the PI3K signalling pathway during Ov infections, however, remains scarce, with several studies even suggesting that the PI3K signalling pathway can only be stimulated by CHCA (Daorueang et al., Reference Daorueang, Thuwajit, Roitrakul, Laha, Kaewkes, Endo and Thuwajit2012). The PI3K signalling pathway is known to generally involve cell metabolism, cellular growth, and cellular survival in normal cells (Ersahin et al., Reference Ersahin, Tuncbag and Cetin-Atalay2015). Due to the chronic inflammation of cholangiocytes caused by liver fluke infections, DNA damage and mutations are accumulated over time, resulting in the rise of CHCA (Maemura et al., Reference Maemura, Natsugoe and Takao2014). The activation of the PI3K signalling pathway was also found to be associated with carcinogenesis, angiogenesis and metastasis in CHCA (Yothaisong et al., Reference Yothaisong, Thanee, Namwat, Yongvanit, Boonmars, Puapairoj and Loilome2014; Zhang et al., Reference Zhang, Ji, Han, Shao, Lu, Huo, Zhang, Yang, Feng, Shen, Wang and Li2018; Duan et al., Reference Duan, Li, Zhuang, Wang, Cao, Tan, Qu and Xiao2019; Tiemin et al., Reference Tiemin, Fanzheng, Peng, Jihua, Ruipeng, Yaliang, Yan, Junlin, Qingfu, Zhefeng, Jian, Zihao, Guoxing, Boshi, Ming, Qinghui, Desen and Lianxin2020), and that increased levels of PI3K was associated with a poor disease prognosis (Tan et al., Reference Tan, Cao, Kim, Al-Toubah, Mehta, Centeno and Kim2021). Conversely, the inhibition of the PI3K signalling pathway was shown to suppress tumour progression and enhance tumour susceptibility to natural killer cell activity (Bommarito et al., Reference Bommarito, Martin, Forcade, Nastke, Ritz and Bellucci2016). Several PI3K/AKT/mTOR inhibitors are currently being investigated in clinical trials as a form of targeted therapy against CHCA (Corti et al., Reference Corti, Nichetti, Raimondi, Niger, Prinzi, Torchio, Tamborini, Perrone, Pruneri, Di Bartolomeo, de Braud and Pusceddu2019). Thus, not only is PI3K valuable for its use as cancer biomarkers, inhibitors to PI3K itself also have a great potential in treating CHCA (Elmenier et al., Reference Elmenier, Lasheen and Abouzid2019). This is further reinforced by the fact that PI3K inhibitors can target multiple initiating steps of the PI3K/AKT/mTOR activating receptors such as insulin growth receptors (IGFR), vascular endothelial growth factor receptors (VEGFR), G protein-coupled receptors (GPCRs), and RAS proteins (Ersahin et al., Reference Ersahin, Tuncbag and Cetin-Atalay2015). Therefore, PIK3CB also has great potential as a prognostic biomarker in assessing CHCA response to PI3K-targeted therapy.
In conclusion, plasma phosphoproteomes obtained from the serum of Ov infected patients and CHCA patients were investigated. Different plasma phosphoproteomes were found to indicate the activation of AKT/mTOR signalling pathway which was associated with OV and CCA. Upstream molecules in the AKT/mTOR signalling pathway i.e. PIK3CB, were investigated. Plasma PIK3CB was found to be a potential biomarker for asymptomatic Ov infections and early-stage CHCA. The detection of plasma PIK3CB using indirect ELISA holds great potential in the screening of opisthorchiasis and CHCA. This discovery will be a great tool for physicians needing to detect opisthorchiasis and CHCA in their early, easily-treatable, stages.
Supplementary material
The supplementary material for this article can be found at https://doi.org/10.1017/S0031182021001694
Acknowledgements
The authors thank the staff of Chulabhorn International College of Medicine Laboratory for technical assistance.
Author contribution
SP, YY, SR, KB, ST, VT conceived and helped to design this study. SP, YY, SR, MP, TP, AK, JK, KB, VT conducted data gathering. SP performed statistical analyses. SP, TS, ST and VT wrote this paper.
Financial support
This study was financially supported by the Thai Government Research Fund through Thammasat University, Fund Contract No. 50/2559 and 64/2560 (Dr Veerachai Thitapakorn) (2016–2017).
Conflict of interest
The authors declare there are no conflicts of interest.
Ethical standards
This study has been approved by the human ethics committee of Udon thani Cancer Hospital, protocol number UCH-CT 11/2563.


