Introduction
A steady increase in life expectancy is currently a worldwide demographic phenomenon associated with the ageing of the human population, notably in the developed world. The process of population ageing has important demographic, health, economic and social consequences for the older age group themselves, their families and society at large. Therefore, the quality of their lives becomes a central issue. The most critical issues in the lives of older adults are health status and access to health care. Older people are more likely to suffer from chronic diseases, multiple morbidities and functional disabilities, which prompts concerns about the readiness of health policies and health care systems to accommodate their needs.
According to the 2017 census, Egypt’s population is approaching 100 million, with a 2.56% annual rate of increase over the time period 2006–2017. The size of the population of older adults aged 60+ has reached more than 6 million, representing 6.7% of the total population in 2017 – far exceeding the size of the older population in most European Union countries. The 2017 Egyptian census indicated that the number of older people increased faster than the total population. The total population recorded an intercensal growth rate of 2.40, while the population of older persons (60+) recorded a growth rate of 3.2.
Figure 1 plots the actual and predicted life expectancies at birth for both sexes for Egypt from 1950 to 2050. Life expectancy (LE) has increased markedly in Egypt over the past 40 years and is expected to keep rising over the next few decades from 2020 to 2050. Over the period 1980–2020 it increased from 58 to 69 years and from 62 to 73 years for men and women, respectively, and is projected to increase to 74 and 79 years for men and women in 2045–2050, respectively (UN-DESA, 2017).
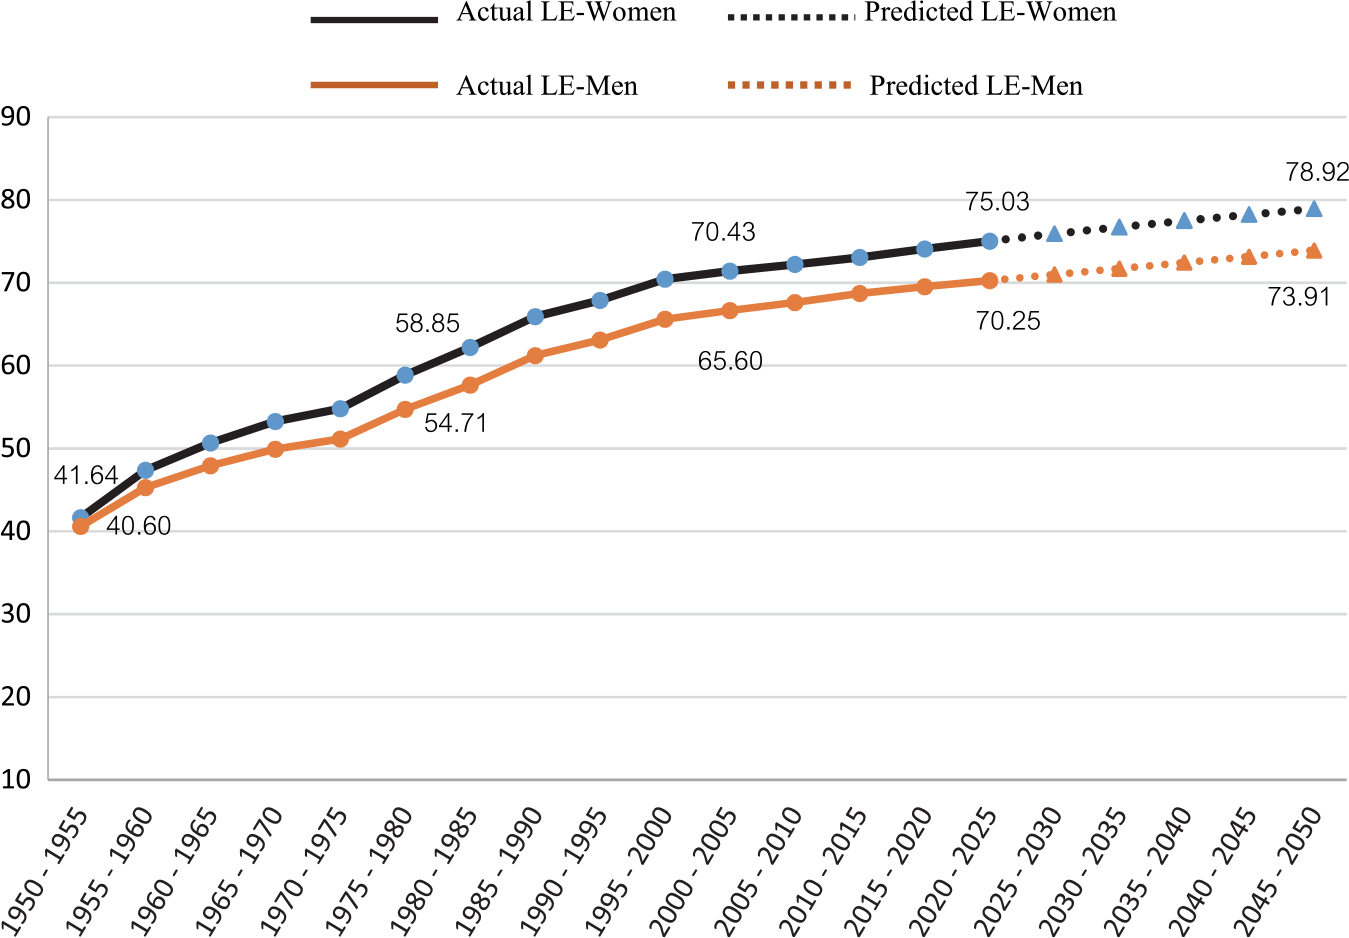
Figure 1. Life expectancy at birth by sex: Egypt 1950–2050. Source: UN-DESA (2017).
The positive improvement in mortality rates over the 20th century cannot be missed. This well-documented increase in life expectancy in Egypt was mainly driven by the great share of the decline in infant and child mortality in the gain in expectation of life, while the reduction in mortality rates among the older age groups showed only a slight contribution. Consequently, the Egyptian population is getting older and more people will survive to the oldest ages.
A great deal of research has been conducted worldwide to measure the quality of life of older people, whether characterized by healthy years or by disablement. However, less has been done in developing countries such as Egypt.
Older adults in Egypt are disproportionately affected by restricted financial resources, and are more likely to be unemployed, illiterate, live alone and in strong need of support in their old age (Lamb Reference Lamb1997; Yount & Agree, Reference Yount and Agree2005; Yount & Khadr, Reference Yount and Khadr2008; Khadr & Yount, Reference Khadr and Yount2012; Khadr, Reference Khadr and Zaky2012). Furthermore, they suffer from high levels of disability and morbidity, which lead to poverty-related effects such as a large incidence of catastrophic health expenditure.
Gender intersects with these dimensions of vulnerability, bringing about worse living circumstances among women (Yount & Khadr, Reference Yount and Khadr2008). Gender-based inequality has been recognized in Egypt from childhood (Khadr, Reference Khadr and Zaky2012). For example, most Egyptian women were denied education during their childhood and now face restrictions on their education at all levels. Results of the Egyptian Demographic and Health Survey 2014 (EDHS) indicate that about two-thirds of women aged 60–64 years were illiterate (64.6%) in 2014, while slightly more than one-third of men of similar age (37.5%) were illiterate (Ministry of Health and Population et al., 2015). Moreover, as health insurance programmes in Egypt are employer-based, only 31% of older adults have governmental health insurance. Thus, older men enjoy health insurance coverage more than women. Khadr (Reference Khadr and Zaky2012) revealed that in 2010, 44% of older men were covered by governmental health insurance versus only 15% of older women. One probable explanation lies in the fact that the female formal workforce participation rate is persistently low, barely exceeding 20% of the total female adult population (Ministry of Health and Population et al., 2015; CAPMAS, 2018). The majority of working women in Egypt are unpaid family workers, and therefore of poor economic status and with great dependence on male family members. Those who are working face gender discrimination in the labour market, low incomes and inequitable access to decent work (Khadr, Reference Khadr and Zaky2012; Krafft et al., Reference Krafft, Assaad and Rahman2019). Also, the EDHS 2014 reported that 20.4% of women aged 60 and older were living alone compared with 5.4% of their men counterparts. Egyptian women are more likely to be widowed (56.5%) than men (11.5%) (Ministry of Health and Population et al., 2015). It is not possible to examine properly the process of population ageing and its multidimensional implications without considering the gender nexus. However, research on gender differences and inequity in reported physical functioning has been limited to more-developed contexts. Elsewhere, such research has been limited by a lack of data collection on physical performance and socioeconomic attributes that distinguish women and men.
In Egypt, there have been a few attempts to collect data on the older adult population’s health. Among these is the World Health Organization’s study on ‘Health and Social Aspects of Ageing’ conducted during 1989–1990 in Bahrain, Egypt, Jordan and Tunisia, and an international study on ‘Development Implications of Demographic Change: Global Population Ageing 1993–1994’ conducted in seven counties, including Egypt. Also, the ‘National Institute on Ageing’ funded a study on ‘Measurement of Gender Differences in Disability and Care’ conducted in 2003 in the Governorate of Ismailia. In addition, the Cairo Demographic Centre (CDC) conducted a study on the ‘Economic, Demographic and Health Status of Older Population in Egypt, 2006’ in six Egyptian governorates. These studies all had small sample sizes, were applied in limited geographic places, and used variations of Activities of Daily Living (ADLs), Instrumental Activities Daily Living (IADLs), and upper- and lower-extremity physical functioning. In this context of limited data and information, a handful of studies on disability and on female–male disparities in health have been conducted (Lamb et al. Reference Lamb, Myers, Andrews, Mathers, McCallum and Robine1994, Reference Lamb1997; Yount & Agree, Reference Yount and Agree2005; Khadr & Yount, Reference Khadr and Yount2012; Khadr, Reference Khadr and Zaky2012; El Shabrawy, Reference El-Shabrawy2013). The findings indicate that, compared with men, women more often report higher levels of functional difficulties and generally score worse on objective tests (Lamb, Reference Lamb1997; Khadr & Yount, Reference Khadr and Yount2012). For example, Lamb (Reference Lamb1997) reported the prevalence of having any difficulties with ADLs to be 25.5% among males and 31% among females, and Yount and Agree (Reference Yount and Agree2005) estimated these percentages to be 22.4% and 28.5%, for men and women, respectively in 2005. For IADLs, the prevalence was 49.1% among men and 63.0% among women. Even after adjusting for age and objective measures of physical performance, and contextual and environmental variables, women have been found to have maintained significantly higher rates of self-reported difficulties (Yount & Agree, Reference Yount and Agree2005; Khadr & Yount, Reference Khadr and Yount2012). Also, El-Shabrawy (Reference El-Shabrawy2013) indicated that 37% of women had the lowest health status index compared with 17% for men, while almost half of men had the highest health status index versus 23% for women.
As the interest in population ageing grows an abundance of summary measures to assess a population’s health have emerged. These aim to combine morbidity and disability, as well as mortality using measures such as healthy life expectancy (HLE), chronic disease-free life expectancy and disability-free life expectancy (DFLE). In 1999, the WHO launched an international study on the status of health in 70 countries (Mathers et al., Reference Mathers, Murray, Lopez, Salomon, Sadana and Tandon2001). The health adjusted life expectancy (HALE) at 60 years is based on six core domains of the International Classification of Functioning, Disability and Health (ICF): 1) mobility, 2) self-care, 3) usual activities, 4) pain and discomfort, 5) affect (anxiety/depression) and 6) cognition. The HALE findings for Egypt have revealed that men and women at age 60 have healthy life expectancies of 9.9 and 10 years, respectively. Lamb et al. (Reference Lamb, Myers, Andrews, Mathers, McCallum and Robine1994) estimated the DFLE using data from the WHO 1989 study mentioned above, and found that ‘… elderly Egyptian males and females have similar numbers of years of remaining life expected to be spent healthy, or disability-free. However, the Egyptian men have fewer years of disabled life, compared with the Egyptian females. Thus, the men can expect a larger proportion of their remaining life to be spent free of functional disabilities. The females’ added years of life expectancy result in added years in disablement, (Lamb, Reference Lamb1997, p. 134). These studies, however, date back almost two or three decades, so it is crucial to have estimates for more recent years.
Little is known about the current prevalence of disability in Egypt, or its levels of severity and most common types, and how Egypt compares with other countries. Several factors are at play. The large population of older adults in the country is concealed by their low share of the total population; consequently, issues related to ageing are overshadowed by the concerns of the younger population. Additionally, overall, studies focusing on ageing lack the glamour of other topics. Furthermore, the study of the burden of disability among older Egyptians faces several problems, including a shortage of data, and even if the data are available, there are problems related to variation in disability definitions and measurements, and to under-reporting, especially in societies that consider disability to be a stigma.
Motivated by these constrains, the objective of this study was twofold. First, it aimed to provide recent information on the burden of disability in Egypt by level of severity and type, and by age and sex. Its second aim was to estimate the disability-free life expectancy (DFLE) of older women and men by disability types and degree of severity, and assess how Egypt compares with other countries on these measures. The findings of this research will help to put the health issues of older people in Egypt higher on the agenda of health policies in the country, and worldwide.
Methods
Data
The data source was round 13 of the Household Observatory Survey conducted in 2016 (HOS-2016) – a nationally representative survey conducted by the Egyptian Cabinet Information and Decision Support Centre (IDSC). The survey employed a stratified, multi-stage and cluster sampling design, collecting data from 11,592 households and 49,431 individuals. The present study analysed data for the 4658 persons aged 60+ years, representing 9.4% of the survey population. When the age–sex distribution of the survey sample population was compared with that of the Egypt census 2017, the share of the population aged 60+ was over-represented in the study sample population (Table 1). The survey sample did not include the institutionalized population.
Table 1. Age–sex distribution of study sample

To identify individuals with disabilities, the HOS-2016 asked a short set of questions on functional difficulties using the six-item disability scale suggested by the United Nations Washington Group on Disability Statistics (UN-WG, 2008). This was the first time a nationwide survey had been conducted to identify individuals with disabilities using this approach in Egypt. Furthermore, a screening question considered to be a deterrent to revealing a difficulty was used in the survey. Disability was measured using a series of six questions on a person’s ability to function in the following six ways: vision, hearing, remembering and concentrating, mobility, self-care and communication. Each question had four response categories: (1) no difficulty, (2) some difficulty, (3) a lot of difficulty and (4) totally unable to do it. In the present study disability was measured in two ways. First, if an individual scored ‘some difficulty’, ‘a lot of difficulty’ or ‘totally unable to do it’ on at least one question they were considered to have any disability. Secondly, if they reported having at least one score of ‘a lot of difficulty’ or ‘totally unable to do it’, an individual was said to have a severe disability. According to these cut-off points, the number of people who reported having any disability was 1985 and those reporting severe disability was 577.
Analysis
Calculations of health expectancy to date have been almost exclusively done using Sullivan’s method (Sullivan, Reference Sullivan1971). Starting in the early 1980s, many studies have used this to calculate DFLE values in several countries: for example, Robine et al. (Reference Robine, Jagger and Egidi2000) estimated DFLE for 50 countries. It has also been used to examine trends in DFLE in many countries (see, for example, Liu et al., Reference Liu, Chen, Song, Chi and Zheng2009; Hashimoto et al., Reference Hashimoto, Kawado, Seko, Murakami, Hayashi and Kato2010; AIHW, 2012; Mandich & Margolis, Reference Mandich and Margolis2014). The Sullivan simple health indicator ‘disability-free life expectancy’ (DFLE) combines mortality data with the prevalence rates of disability. The data requirements are simple and widely available: (1) age–sex-specific prevalence rates of disability and (2) mortality data (from period life tables). The former were calculated from the study sample and the latter were taken from the United Nations abridged life tables (UN-DESA, 2017). In Sullivan’s method, for each age group the total number of persons-years lived (L
i
) is divided into persons-years lived with and without disability using the estimated prevalence rate of disability (
 ${\pi _i}$
).
${\pi _i}$
).
 $${\rm{DFL}}{{\rm{E}}_x} = {1 \over {{l_x}}}\mathop \sum \limits_{x = i}^\omega \left( {1 - {\pi _i}} \right)\;{L_i}$$
where
 ${\pi _i}$
is the prevalence of disability at age i; L
i
is the total number of years lived by the cohort in the interval [i, i+n] and
${\pi _i}$
is the prevalence of disability at age i; L
i
is the total number of years lived by the cohort in the interval [i, i+n] and
 ${l_x}$
is the number surviving to age x. Sullivan’s method assumes that prevalence data will be nearly unchanging in the near future. It also provides unbiased and consistent estimates, even if the stationarity assumption is not met (Imai & Soneji, Reference Imai and Soneji2007; cited in Jagger & Robine, Reference Jagger, Robine, Rogers and Crimmins2011).
${l_x}$
is the number surviving to age x. Sullivan’s method assumes that prevalence data will be nearly unchanging in the near future. It also provides unbiased and consistent estimates, even if the stationarity assumption is not met (Imai & Soneji, Reference Imai and Soneji2007; cited in Jagger & Robine, Reference Jagger, Robine, Rogers and Crimmins2011).
The analysis employed sample weights.
Results
Trends in life expectancy in Egypt
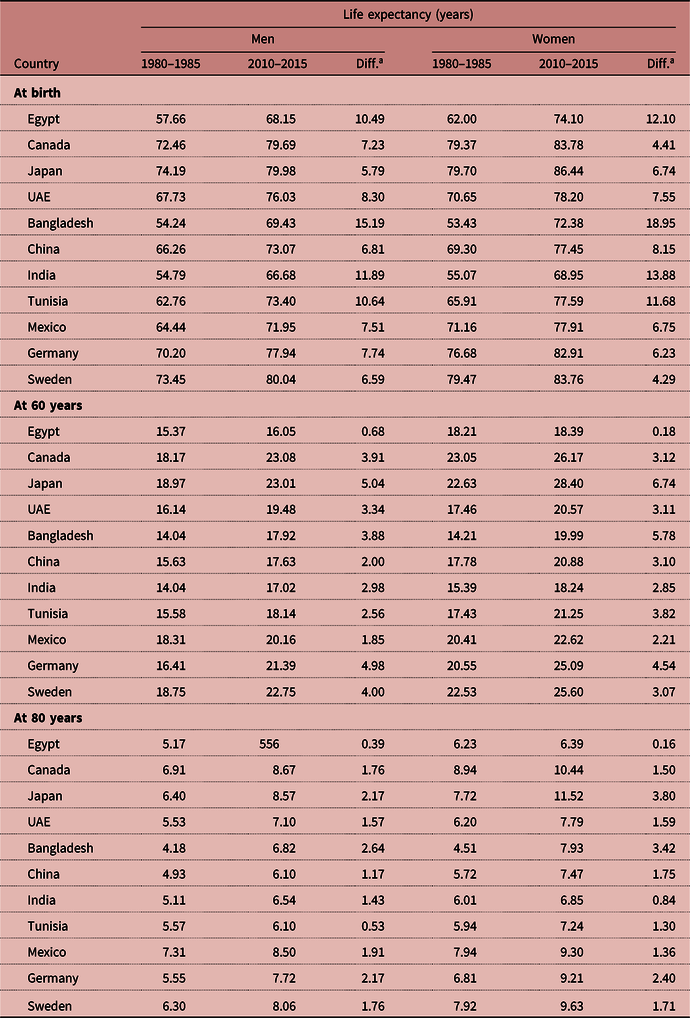
At birth, life expectancy in Egypt increased from 58 to 68.1 years (10.5 years) for men and from 62 to 74.1 years for women (12.1 years) over the 30-year span from 1980–85 to 2010–2015 (see Table 2). For men and women, the gains in life expectancy at age 60 over the 30-year period were very small: 0.68 and 0.18 years, respectively. It is interesting also to observe that the gains in life expectancy at age 60 in this period were much smaller for women than for men. Egypt is not unique in this pattern if compared with different developed and under-developed countries. For example, over the same 30-year span 1980–85 to 2010–2015 the gains in LE at 60 years for men and women in Canada reached 3.91 and 3.12, and they reached 3.34 and 3.11 in the UAE, 2.98 and 2.85 in India, 4.98 and 4.54 in Germany, 4.0 and 3.07 in Sweden, respectively. At age 80, the gains in LE for men and women were 1.76 and 1.50 in Canada, 1.43 and 0.84 in India, 1.91 and 1.36 in Mexico and 1.76 and 1.71 in Sweden. The literature and available data do not provide an interpretation for these findings, which calls for further analysis.
Table 2. Trends in life expectancy estimates at selected ages in Egypt, and selected countries, by sex

Source: compiled by the author from UN-DESA (2017).
a Calculated by the author.
Prevalence of disability in Egypt by sex, age and type
The overall disability prevalence rate of any disability was 42.6% and that of severe disability was 12.4% among the study population of older people aged 60+. Table 3 shows that older women reported more functional limitations than men, with prevalence rates of 45.8% vs 39.7% for any disability and 13.1% vs 11.7% for severe disability, respectively. Intuitively, disability increases as people getting older. The prevalence rates of having any disability for men and women aged 80–84 years were about twice (2.4 and 2.0, respectively) as high compared with individuals aged 60–64 (Table 3). Most importantly, the prevalence of severe disability, although small, significantly increased at a rate faster than that of any disability. The prevalences of having severe disability among men and women aged 80–84 years were about seven-fold (6.7) and three-fold (3.4) greater than among individuals aged 60–64 years. Although older men had lower prevalences of disabilities than older women, they exhibited an accelerated rate of increase in disability prevalence, particularly in severe disability. Old women under the age of 80 were consistently more likely to report functional limitations (any disability) than men across all age groups, and this was reversed at age 80 and above. This was not the case for severe disability, where there was no clear pattern of differences between men and women across the different age groups.
Table 3. Age- and sex-specific prevalence rates of any disability and severe disability for individuals aged 60 years and over, HOS-2016

***p<0.01; CI: confidence interval.
Female–male differences in the proportions of any disability were statistically significant for the young-old ages (60–74) but were insignificant among the oldest-old (above 75), while in the instance of severe disability none of the differences were statistically significant, except for the age group 60–64. The prevalences of any disability and severe disability among men aged 85+ were 2.7 and 7.6 times higher than those among 60–64 years old, and the corresponding figures among women in the same age ranges were 2.0 and 4.5, respectively.
Figures 2 and 3 show the prevalences of any disability by disability type by age and sex. Disability prevalence rates increased across all disability types with increase in age, but they exhibited notable variation by sex. Compared with men, women more often reported higher levels of any disability in mobility, self-care or vision for all age groups, except for the two highest age groups in the case of vision difficulties (Fig. 2). There were no clear differences in prevalence rates of the two types of disabilities ‘remembering/concentration’ and ‘communication’ between men and women of all age groups, except for the oldest two age groups, where men had a greater prevalence rate of communication disability. One interesting finding was that men in all age groups were markedly more likely to report hearing disabilities than women.

Figure 2. Age- and sex-specific disability rates (any disability) by disability type, HOS-2016.

Figure 3. Age- and sex-specific disability rates (severe disability), by disability type, HOS-2016.
Figure 3 shows that, similar to the pattern for any disability, ‘limitations in mobility’ was the dominant reported type of severe functional limitation, followed by vision. Also, there was convergence in the prevalence among men and women of ages under 80 for all types of disabilities except mobility. It is worth mentioning that the results presented in Fig. 3 should be taken with caution because the numbers of people with severe disability, when broken down by age, sex and type, yielded cells with very small numbers for hearing, remembering/concentration and communication.
Disability-free life expectancy (DFLE) by severity of disability
Life expectancy (LE), number of years expected to be lived with (DFLE) and without (DLE) disabilities, and proportions of years expected to be lived free of disabilities (any or severe) are shown in Table 4 for older men and women. The findings point to several informative results.
Table 4. Life expectancy (LE) and disability-free life expectancy (DFLE) by sex and severity of disability, HOS-2016

95% confidence intervals are in parentheses.
First, at each age, women lived longer (have a higher LE) than men. However, the gender gap in LE narrowed as age increased. For example, the findings suggest that a new-born female could expect to live 74.08 years, which is 4.56 years longer than a male infant; and a 60-year old woman could expect to live 18.8 years more; which is 2.55 years longer than a man of similar age. At age 85+ elderly women could expect to live about 9 months longer than their men counterparts (Table 4).
Second, for both levels of disability, but particularly for severe disability, women had more years free of disablement than men. Nevertheless, in the instance of any disability the gender gap in DFLE was small among the young-old, and increased slightly with age, ranging from one month at age 60 to about seven months at age 85 or older. However, the differences across all age groups were statistically insignificant, except for DFLE at birth (Table 5, Column 2). Conversely, the gender inequality in DFLE was larger when severe disability was considered, and decreased as age rose. It ranged from 1.7 years at age 60 to six months at age 85 and above. It is worth mentioning that the gender gap in DFLE for the young-old group (60–74 years) was statistically significant (at p<0.05 and <0.01) but insignificant for the old-old group (75+) (Table 5, Column 7).
Table 5. Differences between men and women in any disability and severe disability, HOS-2016

Source: calculated by the author based on Table 3.
**p<0.05; ***p<0.01.
Third, the proportion of DFLE to life expectancy, as exhibited in Fig. 4 and Table 4, decreased with age and the burden of disability was clearly increasing among the elderly Egyptians across the two levels of disability. A male–female comparison, based on measurement of any disability, and shown by the two lower lines in Fig. 4, revealed that the proportion of healthy years free of any disability was higher for men than it was for women in all age groups except the oldest-old, i.e. 80–84 and 85+ years.

Figure 4. Proportion of DFLE to LE for any disability and severe disability by age and sex, HOS-2016.
Fourth, the proportion of expected years lived with disability increased rapidly with age. The findings suggest that, at age 60, men and women could expect to live about 44% and 51% of their remaining lives with any disability, respectively (Fig. 4). Both sexes at age 80 could expect to spend about three-quarters (75.3% and 69.5%) of their remaining life with any disability. When measured as severe disability (Fig. 4, upper two lines) the results suggest that both sexes could expect to live longer free of severe limitations, with this diminishing markedly with the rise in age. The results show that, at age 60, men and women can expect to live 14.5% and 17%, respectively, of their remaining life with severe disability, and at age 80 or above they could expect about 35–40% of their remaining years to be lived with severe disability.
Finally, it is interesting to note that at young-old ages the men had higher proportions of DFLE than women – across the two severity levels of disability – but this pattern of disparity diminished with advancing age and there was a ‘crossover’ at about age 80, when Egyptian men had a lower proportion of DFLE (Table 5, Columns 4 and 9).
Disabled life expectancy (DLE) by disability type
As the number of individuals with severe disability in the study population was small, the estimation of the proportion of life expectancy lived with disability (proportion of DLE to LE) was restricted to any disability and to all the sample population without disaggregation by sex (Table 6). The results clearly showed that at birth, the proportions of the expected life with functional difficulties in vision and mobility to total life span were the highest (10% and 9%, respectively), and lowest in the instance of functional limitations in communication (1%).
Table 6. Life expectancy and proportion of DLE to total life expectancy by type of disability, HOS-2016

As expected, for all the six functional difficulties the proportion of life expectancy with disability (DLEs) increased with age. For older Egyptians aged 60–64, around 30% of their expected remaining life will be lived with limitations in mobility and vision, rising to reach strikingly high levels of 65% and 52%, respectively, among the oldest-old age group 85+. For the other types of disabilities, an older man or an older woman, aged 60–64, is on average expected to live about 16%, 8%, 9% and 4% of his or her expected remaining life with limitations in hearing, remembering and concentration, self-care and communication, respectively. These rates are doubled and more than tripled when the person reaches age 85 or older (35%, 28%, 36% and 18%, respectively). It is important to note that the proportion of life expectancy with disability increased with age at a faster rate for the functional limitations self-care, communication and remembering and concentration than for vision and mobility.
Discussion
This study estimated disability-free life expectancy (DFLE) by sex, age and level of disability severity, as well as disability types, among adults aged 60 years or older in Egypt 2016. The analysis was based on data derived from a nationwide survey using a performance-based disability measure grounded in the Washington Group Short Set on Functioning (WG-SS).
The results showed that the prevalence rate of any disability was high among Egyptians over the age of 60 (on average, around four out of ten), with women reporting a greater prevalence than men. A study in Bangladesh in 2010, using the WG-SS, reported estimates of disability prevalence very close to the findings of the current study: 38.9% and 46.5 % among Bangladeshi men and women aged 60 and above, respectively (Tareque et al., Reference Tareque, Begum and Saito2013). Another study in six developing countries using the ADL measure found that, among individuals aged 50 and over, disability prevalence ranged from 13% in China to 54% in India (Santosa et al., Reference Santosa, Schroders, Vaezghasemi and Nawi2016).
In the case of severe disability, the current study found that the prevalence rates declined dramatically to about one in every ten. The overall prevalence rate of severe disability rose to 16% among Egyptians aged 65 years and older, which is close to corresponding estimates for some Arab countries: 15.8% in Oman in 2010 and 20% in Yemen in 2014. Morocco is an exception, with the prevalence of severe disability in 2014 being found to be drastically high at 31.2% (ESCWA, 2018).
Numerous studies from a wide range of countries have consistently shown that the prevalence of disability increases with age and reaches a substantial level at ages 65 years and above (Ritchie & Polge, Reference Ritchie, Polge and Robine2003), with older women being more often disabled than men (ESCWA, 2018; Albrecht & Verbrugge, Reference Albrecht, Verbrugge, Albrecht and Scrimshaw2000). Egypt follows this global pattern.
It worth mentioning that the prevalence of severe disabilities in Egypt was found to increase with age at a faster rate than that of any disability in both sexes. The gender gap in level of reported disability (any and severe) had no clear pattern with age. However, it is important to note that the gender differences in reporting severe disability for all age groups – except for the age group 60–64 – were statistically insignificant, and were also statistically insignificant among the oldest-old aged over 75 in the instance of any disability. Functional difficulties in mobility and vision, both any and severe, represented the most widespread types of disability among old Egyptians, followed by limitations in hearing. Similar patterns have been observed in other Arab countries, taking into consideration that ESCWA estimates refer to all the study population (aged 0 and above) (ESCWA, 2018). Women suffer more from limitations in mobility and vision than men, while men suffer from hearing limitations more than women. Difficulties in hearing among men are most probably related to workplace and occupational hazards.
Egyptians at age 60 are expected to live about 18 years until they decease. Half of these years – about nine years – are expected to be lived free from any disability and 14 years are expected to be free from severe disability. Noticeable differences were found between the sexes in the current study, with Egyptian women outliving men. However, the gender gap in survival narrowed as age increased. Furthermore, women were found to have a longer DFLE than men, which is in line with other studies in more developed and less developed countries. Similar results have been reported in China (Liu et al., Reference Liu, Chen, Song, Chi and Zheng2009; Santosa et al., Reference Santosa, Schroders, Vaezghasemi and Nawi2016), Vietnam (Nguyen et al., Reference Nguyen, Saito, Phan and Nguyen2012) and in Ghana, India, Mexico the Russian Federation and South Africa (Santosa et al., Reference Santosa, Schroders, Vaezghasemi and Nawi2016). However, Tareque et al. (Reference Tareque, Begum and Saito2013) reported a different result in Bangladesh, as they found that women lived longer (had a higher LE) but had a shorter DFLE in both numbers and proportions than men.
When severity of disability level was considered, older Egyptian women were expected to live a greater number of remaining years free of any disability or of a severe disability than men. The gender inequality in DFLE was significant in the instance of severe disability but decreased as age rose. The sex gap ranged from 1.7 years at age 60 to six months at age 85 and older. Even though women live longer and have a longer DFLE than men, men have a higher proportion of DFLE than women – a finding similar to those of Lamb et al. (Reference Lamb, Myers, Andrews, Mathers, McCallum and Robine1994, Reference Lamb1997), and of other studies. For example, at age 65 the proportions of DFLE to LE for men and women, respectively, in Egypt were 50.1% and 43.1%, while in the UK they have been found to be 58.3% and 53.1% (Jagger, Reference Jagger2015); 68.2% and 63.0% in Japan (Hashimoto et al., Reference Hashimoto, Kawado, Seko, Murakami, Hayashi and Kato2010); 81.7% and 68.4% in Canada (Mandich & Margolis, Reference Mandich and Margolis2014); 69.5% and 67.1% in China (Liu et al., Reference Liu, Chen, Song, Chi and Zheng2009); and 54.6% and 46.7% in Bangladesh (Tareque et al., Reference Tareque, Begum and Saito2013).
It is interesting that not only do Egyptian women have a longer DFLE than men, but they also live for more years with disablement (DLE) than men. However, in proportion, women live a smaller fraction of their life expectancy free of disability than men and a greater fraction with disability than men in all age groups except 80–84 and 85+ years. At age 60, women and men can expect about 17% and 14.5% of their LE, respectively, to be in a severely disabled state. Living ten years or more, at age 70, about 23.7% and 22.4% of women’s and men’s remaining life are expected to be lived with disability. As they reach the oldest-old ages (i.e. 80–84), women and men can expect 34.5% and 38.2%, respectively, of their expected remaining years to be with severe disability.
The study estimates of levels of disability and DFLE among elderly Egyptians, using data collected in 2016, were based on the health status of those who were the survivors of cohorts born in the first half of the last century (between about 1925 and 1956). During that time, levels of advancements in the health system, public health, hygiene and medication technology were comparable to those experienced in recent years. Older Egyptians also witnessed several wars, in 1948, 1956, 1967 and 1973. By the turn of the 2nd millennium, there had been considerable improvements in public health, improved nutrition, advancements in medical innovation, as well as progress in the level of socioeconomic status in the country. Thus, further expansion of life expectancy is expected. But will the older population continue to enjoy a healthy, disability-free, safe, protected and dignified life? More rounds of data collection on disability are required to monitor changes in health, track DFLE and investigate its changes in relation to the lifetime of individuals in Egypt. This effort to measure the DFLE indicator represents the base level against which future estimates could be compared.
The results of this study show that the availability of the DFLE indicator in Egypt is very important for decision-makers, as one of the health goals of the country is to raise the disability-free life expectancy, and to monitor and evaluate the health of the population. The study found that the burden of disability in 2016 was pronounced among the older population in Egypt and was more pronounced among women. Although the life expectancies and positive health expectancies were higher for Egyptian women than men, Egyptian women had longer expected years with disability and a lower proportion of DFLE to total life expectancy, which is congruent with the findings of most other studies. Functional limitations in mobility and vision were the most reported types of disabilities among the older population. They suffered from, and lived longer with, pain and discomfort more than their peers with other disability types. Suffering from difficulties, notably in mobility and vision function, may strongly contribute to a lack of social participation and isolation. Enhanced attention to these two disability types and their preventable causes among older people could extend their active life and help offset the impending long-term care pressures related to population ageing.
The size of the older population in Egypt is increasing. It poses challenges to policymakers and social institutions to respond to their health, economic and social problems. However, the level of readiness of the health, economic and social systems in Egypt to accommodate their needs lags behind. The findings of this study have implications for policymaking for improving the quality of the older population in Egypt. Contextual differences in how the process of ageing is experienced need to be considered by decision-makers when designing gender-responsive policies. Programmes with greater focus on identifying the risk factors that are more common among the older women and men may be an effective strategy for extending their active life. The government should make use of such research, and from experiences in other countries to enforce systems and policies for the well-being of older persons. The feminization of ageing is well documented in countries around the world. This is mainly due to women’s lower levels of mortality contributing to their longer lives compared with their male counterparts (Khadr, Reference Khadr and Zaky2012; Santosa et al., Reference Santosa, Schroders, Vaezghasemi and Nawi2016). This phenomenon is not acknowledged in field policies in Egypt. Policies and systems of welfare, health insurance and pensions, should be gender sensitive.
Study limitations
Several limitations of the study deserve careful attention. First, although self-reporting was the only source of knowledge about pain and suffering, comparisons of self-reported health across gender can be confounded by the use of different response scales across individuals. Therefore, the findings might have been influenced by differential health reporting behaviour related to different experiences and expectations and perceptions about health by different population groups. Use of the ‘anchoring vignettes approach’ or ‘biological markers’ has been suggested to quantify the extent to which differences in reporting behaviour may drive these differences across gender, as well as other socioeconomic positions (Molina, Reference Molina2016; Santosa et al., Reference Santosa, Schroders, Vaezghasemi and Nawi2016). However, neither was applied in the used data set. Second, because of the nature of the cross-sectional data, the estimated prevalence of disability among the older individuals was likely to have been influenced by mortality selection. This is under the assumption that survivors tend to have fewer morbidities and disabilities than those who are deceased. Unlike longitudinal data, cross-sectional data do not allow that assumption to be fulfilled. Third, the data used in this study had a limitation similar to that of the study by Santosa et al. (Reference Santosa, Schroders, Vaezghasemi and Nawi2016, p. 860). As they noted ‘the data do not allow us to assess a non-returnable state assumption, whether people recovered from their disability situation or not. It is therefore not possible to examine the transitional probabilities across different functional states, and how the disability transition rates and level vary by age and sex.’ Fourth, the WG-SS disability scale on functioning limitations (UN-WG, 2008) has been developed in an effort to reach a unified concise tool to measure functional restrictions that allow comparisons within and between countries and monitoring changes over time. It tends, however, to miss some respondents with self-reported difficulties because not all functional types are fully covered: mainly, psychological difficulties, e.g. learning and making decision components (Mont, Reference Mont2007). Fifth, the survey sample did not include the institutionalized population. If disability is disproportionately prevalent among the institutionalized population, not taking this group into account would result in an overestimate of DFLE, especially at older ages (Tareque et al., Reference Tareque, Begum and Saito2013). The current study assumed that size of the institutionalized population, especially residents of nursing homes and inpatients, is too trivial to affect the estimates. Nursing homes are very scarce in Egypt and taking care of the elderly is still the responsibility of the family. Finally, due to the small sample size, the study was not able to obtain estimates of DFLE by disability type separately for men and women. Additionally, the analysis was constrained by the availability of life tables in Egypt only by sex. Therefore, the study of inequality in DFLE by other socioeconomic groups was not possible.
Acknowledgments
The author wishes to express her gratitude to Prof. Somaya El-Saadani and the anonymous reviewers for their invaluable comments and suggestions, which substantially improved the manuscript.
Funding
This research received no specific grant from any funding agency, commercial entity or not-for-profit organization.
Conflicts of Interest
The author has no conflicts of interest to declare.
Ethical Approval
The author asserts that all procedures contributing to this work comply with the ethical standards of the relevant national and institutional committees on human experimentation and with the Helsinki Declaration of 1975, as revised in 2008.