


INTRODUCTION
The Holocene is the most important geological era for cultures and human society (An et al. Reference An, Porter, Kutzbach, Wu, Wang, Liu, Li and Zhou2000; Ruddiman Reference Ruddiman2008), which makes it extremely important to understand the mechanisms driving Holocene climate change. However, controversies still exist regarding the mechanism for Holocene climate change. In the Asian monsoon region, many speleothem and paleolimnology records suggest that the variation of monsoon intensity generally followed the summer insolation (Zhou et al. Reference Zhou, Yu, Jull, Burr, Xiao and Lu2004; Wang et al. Reference Wang, Cheng, Edwards, He, Kong, An, Wu, Kelly, Dykoski and Li2005). However, the implication of the oxygen isotope (δ18O) in speleothems has been questioned (Clemens et al. Reference Clemens, Prell and Sun2010; Liu et al. Reference Liu, Wen, Brady, Otto-Bliesner, Yu, Lu, Cheng, Wang, Zheng, Ding, Edwards, Cheng, Liu and Yang2014). In addition, the timing of the Holocene optimum in North China remains unclear (Shi et al. Reference Shi, Kong, Wang, Tang, Wang, Yao, Zhao, Zhang and Shi1992; An et al. Reference An, Porter, Kutzbach, Wu, Wang, Liu, Li and Zhou2000; Liu et al. Reference Liu, Cui, Tian and Xu2002; Chen et al. Reference Chen, Lan, Lou and Chen2003, Reference Chen, Yu, Yang, Emi, Wang, David, Huang, Yan, Tomonori, John, Ian, Chen, An and Bernd2008; Wang et al. Reference Wang, Cheng, Edwards, He, Kong, An, Wu, Kelly, Dykoski and Li2005; Guan et al. Reference Guan, Wamg, Yao, Chi and Zhao2010; Jiang et al. Reference Jiang, Wang, Ma, Li, Liu and He2014). The Inner Mongolia Plateau is located along the northern margin of East Asian monsoon influence, which is especially sensitive to changes in the monsoon influence. Thus establishing high-quality records of climate change in the Inner Mongolia during the Holocene, especially precipitation records, is extremely helpful to understand the mechanism for climate change in the East Asian monsoon region, to some extent, which is also helpful to support the significance of speleothem δ18O records to the precipitation change of Asian monsoon from another perspective.
Scientists have made substantial progress in understanding the Holocene climate variability in North China using a variety of sediment climate proxies such as pollen, grain size, magnetic parameters, and geochemical characteristics (Liu et al. Reference Liu, Cui, Tian and Xu2002; Xiao et al. Reference Xiao, Xu, Nakamura, Yang, Liang and Inouchi2004; Peng et al. Reference Peng, Xiao, Nakamura, Liu and Inouchi2005; Sun et al. Reference Sun, Wang, Zhou, Shen, Cheng, Xie and Wu2009; Wen et al. Reference Wen, Xiao, Chang, Zhai, X and Li2010; Guan et al. Reference Guan, Wamg, Yao, Chi and Zhao2010; Yin et al. Reference Yin, Liu, He, Zhao, Zhu, Wang, Liu and Wu2011; Zhai et al. Reference Zhai, Xiao, Zhou, Wen, Chang, Wang, Jin, Pang and Shigeru2011; Wang et al. Reference Wang, Liu, Zhao, Yin, Zhu and Ian2012; Xu et al. Reference Xu, Cui, Xiao and Ding2013; Jiang et al. Reference Jiang, Wang, Ma, Li, Liu and He2014). However, there is a need to improve our understanding by studying additional environmental proxies that are sensitive to a broader range of paleoenvironmental parameters. Pioneering studies have demonstrated that the original information is preserved by lipid molecular fossils during long periods of burial (Bray et al. Reference Bray and Evans1961; Eglinton et al. Reference Eglinton and Hamilton1967; Logan et al. Reference Logan, Smiley and Eglinton1995). These molecular fossils contain a plentiful record of diverse paleoenvironmental information. They do not suffer from some of the limitations imposed on other proxies, such as the long distance transport of exogenous pollen, or poor preservation of large fossils, which can obscure paleoenvironmental sediment records (Cranwell Reference Cranwell1973; Brassell et al. Reference Brassell, Eglinton, Marlowe, Pflaumann and Sarnthein1986; Ishiwatari et al. Reference Ishiwatari, Hirakawa, Uzaki, Yamada and Yada1994; Ficken et al. Reference Ficken, Street-Perrott, Perrott, Swain, Olago and Eglinton1998; Mügler et al. Reference Mügler, Sachse, Werner, Xu, Wu, Yao and Gleixner2008; Seki et al. Reference Seki, Meyers, Kawamura, Zheng and Zhou2009; Zhou et al. Reference Zhou, Zheng, Meyers, Jull and Xie2010; Nelson et al. Reference Nelson, Henderson, Huang and Hu2013). D/H ratios of leaf waxes (δDwax) derived from terrestrial plants and preserved in lake sediments can provide important information on past continental hydrology. Ideally, δDwax is a well-established paleoclimate proxy that can be used to reconstruct precipitation D/H ratios (δDP) (Hou et al. Reference Hou, D’Andrea and Huang2008; Seki et al. Reference Seki, Meyers, Kawamura, Zheng and Zhou2009).
In this study we present the hydrogen isotopic compositions (D/H ratio) of n-acids from a sedimentary sequence in central Inner Mongolia. These data are coupled with accelerator mass spectrometry (AMS) 14C dates to establish a firm chronological framework and reconstruct the evolution of paleovegetation and precipitation in middle Inner Mongolia. Regional climate change characteristics are also discussed for the Holocene, in the context of global climate change occurring at that time.
SAMPLES AND METHODS
Study Site
The Duoerji peat bog (40°39.867΄N, 111°1.480΄E, 1022 m above sea level) is located in the Turmot plain (Figure 1). According to the modern geographic regionalization, the study site belongs to the temperate semi-arid zone and the climate is mainly controlled by the Asian monsoon system. Turmot plain has a monsoonal climate with four clearly distinct seasons. Temperature and precipitation are positively correlated in the Inner Mongolian Plateau and both exhibit distinct seasonal variability characteristic of a monsoon climate. The rainfall is uneven throughout the year and concentrated in summer. Mean annual temperature is ~6.3ºC, and the annual mean precipitation is ~400 mm (Yun Reference Yun1987). Local modern grassland vegetation is mainly Stipa bungeana and S. breviflora. The reeds (Phragmites australis (Cav.) Trin. ex Steud) were growing in the peat bog. The palynological composition of this bog is mainly Artemisia, Chenopodiaceae and Ephedra (Wang et al. Reference Wang and Sun1997). The assemblage changed over time. Since 9.1 ka, the vegetation changed from the typical steppe-forest to steppe-mixed forest of coniferous and broad leave-forest-typical steppe (Wang et al. Reference Wang and Sun1997). The Duoerji Peat bog is totally about 0.1 km2 with hardly any water remaining in spring. We trenched in the middle of the bog, where there was no human tillage disturbance.

Figure 1 Location of the Duoerji peat bog.
Sampling and AMS 14 C Dating
Our trenching in the Duoerji peat bog recovered a 237-cm sediment sequence composed of peat, clay and sand (Figure 2). The uppermost section, above 126 cm, is a dark brown peat that contained abundant undecomposed reed remains. Sediments below this level are black silty clay. Black sands occur at a depth of 159 cm and are followed by a yellow sand layer at 196 cm.

Figure 2 Calibrated AMS 14C dates against depth of the Duoerji profile.
The chronology of the core was constructed from seven AMS 14C measurements on organic matter. Bulk samples for radiocarbon (14C) dating from selected levels were pretreated with 10% HCl and NaOH solutions, and then rinsed repeatedly with distilled water until neutral. They were then sieved through a 60 mesh (0.25 mm) sieve to remove fine sedge roots. Residual cellulose and leaf fragments were picked out and dried in an electric oven for 14C dating. Details of this method are given in Zhou et al. (Reference Zhou, Lu, Wu, Deng, Jull, Donahue and Beck2002). Dating was conducted in the AMS Laboratory at the University of Arizona. Radiocarbon dates were calibrated using the CALIB 6.0 program (available at www.radiocarbon.org). The calibrated ages are quoted with two standard deviation uncertainties (Table 1). We formulated an age-depth model based on median-probability ages of the calibrated dates using a cubic-spline regression method (Heegaard et al. Reference Heegaard, Birks and Telford2005; Figure 2).
Table 1 Radiocarbon dates of the Duoerji sediment profile, Inner Mongolia.

Sample Preparation
The solvent-extractable organic matter from 42 samples were prepared with an ultrasonic extractor using dichloromethane and methanol (volume ratio is 9:1) from 0.3 g freeze-dried peat or 5 g sand (3×30 min). The esterification of total extracts was processed by heating for 12 hr (60°C) with methanol hydrochloride. The samples were then dried under nitrogen, and extracted with hexane after adding a 5% sodium chloride solution. The total extract was separated using a solid phase extraction method on a silicagel column (200~400 mesh). Fatty acid methyl esters were eluted with dichloromethane (4mL). The alkanes followed by elution with hexane (4mL). The saturated fatty acid fraction was separated on another silicagel column (230 mesh) with 10% silver nitrate by eluting with 15 mL hexane and dichloromethane (volume ratio is 4:1).
Analysis of n-Fatty Acids
Lipid extraction, separation, and hydrogen isotope measurement were conducted in the State Key Laboratory of Loess and Quaternary Geology, Institute of Earth Environment, Chinese Academy of Sciences.
The components were identified and quantified using gas chromatography (Agilent GC 6890) with flame ionization detection (GC-FID) and an HP-1MS column (60 m × 0.32 mm × 0.25 μm). For quantification, peak areas for n-fatty acids were compared with those from an external n-fatty acids standard mixture. Hydrogen isotope ratios of individual compounds were determined using a Thermo Trace Ultra gas chromatograph with a Thermo Delta V Advantage isotope ratio mass spectrometer (GC-TC-IRMS). The individual compounds went to an isotope mass spectrometer, via quantitative conversion to H2 in a high temperature oven operated at 1450°C. Compound-specific δD values were obtained using IRMS. The IRMS peak sizes were assessed by C24 acids. The peak sizes which ion beam of C24 acids >4000 mv were used for the analysis. The samples were measured in duplicates, and the average numbers were reported.
Methylated fatty acids were further derivatized as trimethylsilyl ethers using BSTFA (Sessions et al. Reference Sessions, Burgoyne, Schimmelmann and Hayes1999). Correction for the derivatization was calculated by using the following Equation (1) before reporting.
 $$\delta {\rm D}_{{{\rm real}}} {\equals}\left[ {\left( {2{\rm n}{\plus}2} \right){\times}\delta {\rm D}_{{{\rm measured}}} {\plus}123.7{\times}3} \right]\,/\,\left( {2{\rm n}-1} \right)$$
In Equation (1), n refers to carbon number of the studied compound, and δDreal is the true value of fatty acids, whereas δDmeasured is the measured value of fatty acids (Yang et al. Reference Yang and Huang2003).
The δD values were normalized to the Vienna standard mean ocean water (VSMOW, D/H = 155.76±0.05 × 10⁻⁶) scale using a standard mixture. δD is defined as
 $$\delta {\rm D}_{{{\rm sample}}} {\equals}\left[ {\left( {{\rm D}\,/\,{\rm H}} \right)_{{{\rm sample}}} -\left( {{\rm D}\,/\,{\rm H}} \right)_{{{\rm std}}} } \right]\,/\,{\rm }\left( {{\rm D}\,/\,{\rm H}} \right)_{{{\rm std}}} {\times}1000$$
C21, C25, C27,C29, C31, and C33 n-alkanes, purity≥99.5% (Fluka Inc., Buchs, Switzerland), were used as experimental standards. Reproducibility and accuracy were evaluated by measuring n-alkane standards between every five measured samples, and the standard deviation of δD values of n-alkane standards was <3‰. To ensure stable ion source conditions during measurement the H3 factor (Hilkert et al. 1999) was determined at least once a day, which was 4.12 ± 0.03.
RESULTS AND DISCUSSION
Distributions of n-Acids Extracted from Peat Samples from Duoerji Peat Profile
Carboxylic acids in sediment sequences originate from multiple sources. The nC16 and nC18 acids are ubiquitous components of biota, whereas the even chain C24–C30 n-alkanoic acids originate principally from the waxy coatings of land plants (Cranwell Reference Cranwell1974; Wiesenberg and Schwark Reference Wiesenberg and Schwark2006). Because carboxylic acids are more sensitive to degradation and modification than other types of lipid biomarkers (e.g., Meyers and Ishiwatari 1993), they can be useful indicators of the amount of organic matter recycling in subaqueous depositional sequences. As such, the acids serve as an important function in paleoenvironmental reconstructions by providing a relative measure of the reliability of source information from other biomarker compounds.
The chain length distributions for 42 samples from different lithologic units in Duoerji peat profile were analyzed on GC-FID. The compositions of n-acids range in chain length from nC16 to nC30 with distinct even-over-odd predominance (Figure 3). Most distributions are dominated by the nC24, nC26, and nC28 components that are diagnostic of higher plants such as land plans and aquatic macrophytes. However, the proportions of n-acids in the distribution from the upper and bottom units were dominated by the ubiquitous nC20 and nC16 acids which suggested that it was largely derived from peat sphagnum. Their dominance throughout the sequence may indicate either preferential preservation relative to short chain algal fatty acids or dominance of land plant organic matter throughout most of the depositional history of the Duoerji bog sequence.
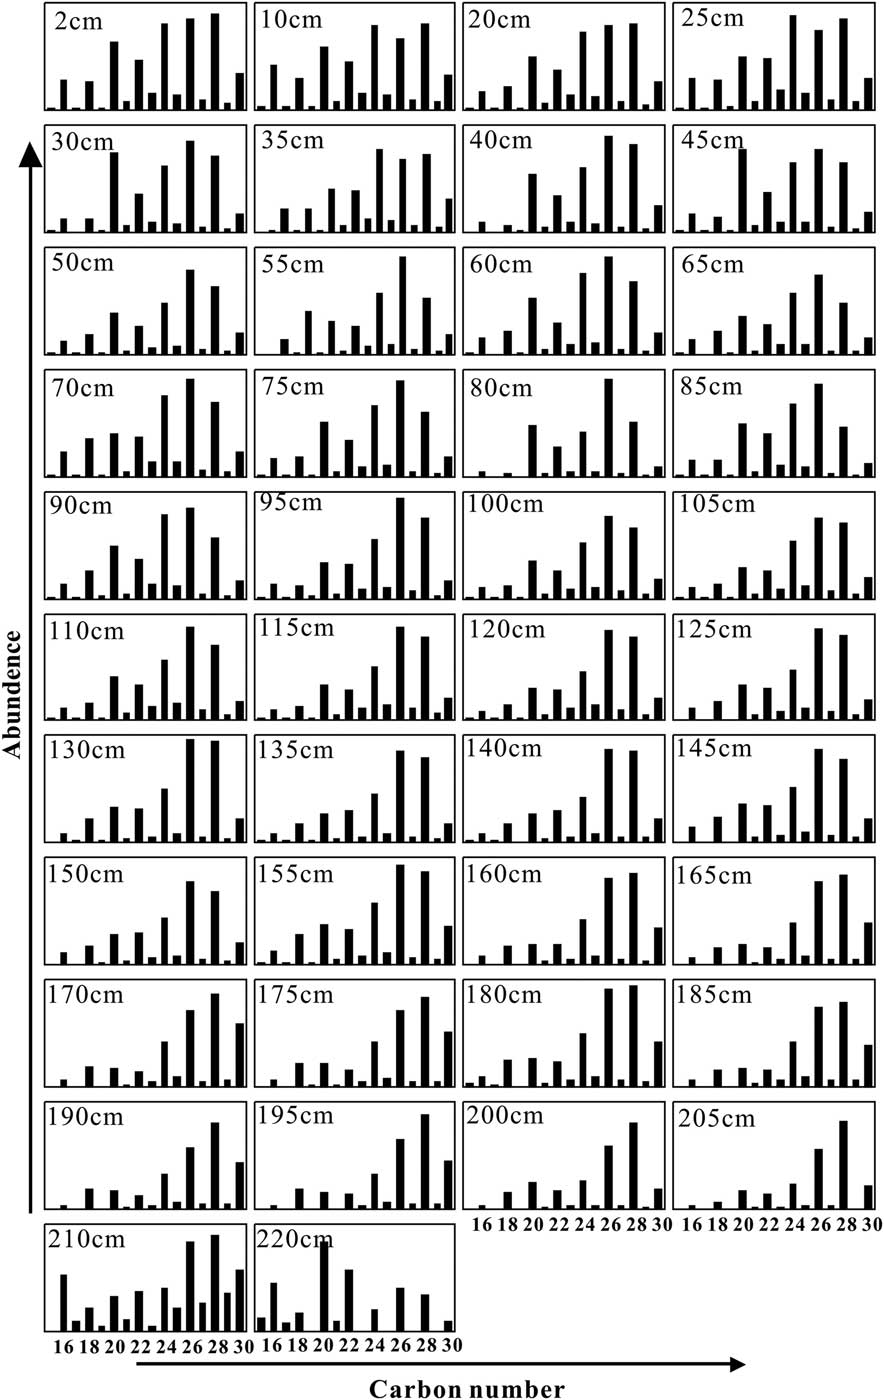
Figure 3 Distributions of n-acids extracted from peat samples from the Duoerji peat profile.
Variation in D/H Ratios of Plant-Derived n-Acids in Duoerji Profile and Biological Inputs
The δD records of n-C20, n-C22, n-C24, n-C26, and n-C28 acids show similar variation in the Duoerji sediment profile (Table 2, Figure 4). As the temporal resolution of our records are relatively low (28 sample over the past 10 ka), we focus on the general trend in this paper. We will analyze more samples in order to discuss the details. Over the past 10 ka, the δD value of the n-C20 acid varied from –241‰ to –213‰ while the δD value of n-C22 acid varied from –234‰ to 213‰. The δD values of n-C24, n-C26, n-C28 fatty acids varied from –251‰ to –213‰, –258‰ to –210‰ and –262‰ to –206‰ (Figure 4). The amplitude of the δD values for n-C20 and n-C22 fatty acids were larger than n-C24, n-C26 and n-C28 acids. The reason is still not clearly for us. During the Early Holocene (10–9 ka), the δD records of all acids were relatively enriched, and became depleted abruptly (> 50‰) at ~9 ka. δD of n-C26 and n-C28 acids reach their most remarkable depleted value at around 8.8 ka, while δD of n-C20, n-C22, and n-C24 acids reach their lowest value at around 7.5 ka. The δD values enriched gradually from 9 to 4.2 ka, then the δD values fluctuated slightly after 4.2 ka. Overall, the δD values are more depleted during the period 9–4.2 ka than between 4.2–0 ka. There are some gaps in the δD records of the n-C20 and n-C22 fatty acids as their abundance were too low to be detected in some samples.

Figure 4 δD records of n-C20, n-C22, n-C24, n-C26, and n-C28 acids in the Duoerji sediments profile.
Table 2 Hydrogen isotopic composition of individual n-fatty acids from Duoerji sediment profile, Inner Mongolia.

Overall, δD values of the long-chain n-acids are smaller than short-chain n-acids. As long-chain fatty acids are mostly from higher plants (Cranwell Reference Cranwell1974; Wiesenberg and Schwark Reference Wiesenberg and Schwark2006) such as emergent aquatic plant Phragmites australis (Cav.) Trin. ex Steud. and short-chain fatty acids are mostly from peat sphagnum, it can be deduced that the acids from peat sphagnum are richer in D than acids from reed. This difference has been shown to be common in the past. The hydrogen isotope compositions of herbaceous plants are smaller than symbiotic woody plants or bushes, as indicated by δD values of leaf wax n-alkanes in 34 modern plants from the Chinese Loess Plateau (Liu et al. Reference Liu, Yang and Li2006, Reference Liu and Yang2008). The δD ratios of leaf wax compounds of over 70 plants around Blood Pond in Massachusetts, northeastern United States, were found to have leaf wax compound δD values that were 40‰~50‰ higher than herbaceous plants living under the same precipitation and photosynthesis conditions (Hou et al. Reference Hou, D’Andrea, MacDonald and Huang2007). Therefore, it is feasible to reconstruct the paleovegetation types by means of hydrogen isotopic compositions of leaf wax lipids in plants. In addition, new research suggests that differences between mid- and long-chain compound specific δD n-alkane values in lacustrine sediments can serve as a paleoclimatic indicator (Rao et al. Reference Rao, Jia, Qiang and Zhao2014).
There are obvious sedimentological changes in the core, going from sands with less organic matter in the lower part through clays to bog peat rich in organic matter at the top. These changes in environmental and deposition settings could affect the plants that are producing the waxes and alter the isotopes. The distributions of n-acids and pollen records of Duoerji peat showed vegetation variation. The change to a bog at the end of the Holocene humid period possibly drove the enrichment of the δDwax to some extent.
Implications for Past Changes in the Precipitation in Inner Mongolia (10–0 cal ka BP)
Hydrogen in plant-derived n-acids is derived from the water source utilized by the plants. The D/H ratio of the n-acids is controlled by the isotopic composition of the source water and by kinetic isotopic fractionation that occurs during biosynthesis of the n-acids (Sachse et al. Reference Sachse, Radke and Gleixner2004; Seki et al. Reference Seki, Meyers, Kawamura, Zheng and Zhou2009). Meteoric water is the primary source of hydrogen for most plants, and its D/H ratio is determined by multiple environmental factors, including (1) the origin of the water and (2) the temperature, evaporation, and precipitation history of the air mass that delivered moisture the site (Craig Reference Craig1961; Gat Reference Gat1996). Because of their large mass difference, D and H are strongly fractionated in plants by environmental and biosynthetic process that is unlikely affected by the temperature. Evapotranspiration by land plants proceeds faster for H2O than for DHO, with a consequence that deuterium becomes relatively enriched in leaf waters. This enrichment is variably influenced by humidity, making the δD values of land plant n-alkanes sensitive to climate change (Sachse et al. Reference Sachse, Radke and Gleixner2004; Hou et al. Reference Hou, D’Andrea and Huang2008). Unlike land plants, submerged plants that are immersed in water experience evapotranspiration less and their n-acid δD values are governed largely by the hydrogen isotopic composition of their host water (Sternberg Reference Sternberg and da1988; Sessions et al. Reference Sessions, Burgoyne, Schimmelmann and Hayes1999; Huang et al. Reference Huang, Shuman, Wang and Webb2004; Hou et al. Reference Hou, D’Andrea, MacDonald and Huang2007). δD values of C28 n-alkanoic acids from a transect of 32 lake surface sediments across large gradients of precipitation show significant correlation with δDP (precipitation D/H ratios) values (R2=0.76) with an apparent isotopic enrichment of ~99±8‰, indicating that sedimentary δD wax values track overall δDP variation along the entire transect (Hou et al. Reference Hou, D’Andrea and Huang2008). In addition, previous studies have confirmed that D/H ratios of lipid biomarkers from higher plants in the sediments in arid regions can be used to study precipitation changes (Mügler et al. Reference Mügler, Sachse, Werner, Xu, Wu, Yao and Gleixner2008; Seki et al. Reference Seki, Meyers, Kawamura, Zheng and Zhou2009; Nichols et al. Reference Nichols, Booth, Jackson, Pendall and Huang2011).
The isotopic composition of precipitation in a given location is reversely correlated with the amount of rainfall, the classic “amount effect” (Dansgaard Reference Dansgaard1964). The amount effect in the Asian monsoon region is weaker than that in tropical inland (Araguás-Araguás et al. Reference Araguás-Araguás, Froehlich and Rozanski2000; Bowen Reference Bowen2008), but it is still a significant factor influencing isotopic compositions of precipitation in China (Hoffmann and Heimann Reference Hoffmann and Heimann1997). Though it was suggested that δ18O of speleothems from eastern Asia does not inform on local precipitation amount or intensity because the isotopic excursion in precipitation is due to changes in the isotope composition of water vapor from different source regions, or mixed processes (Dayem et al. Reference Dayem, Molnar, Battisti and Roe2010; Battisti et al. Reference Battisti, Ding and Roe2015), the precipitation isotopes in China with intense summer monsoon precipitation are considered more dependent on the amount of precipitation than on temperature (Johnson and Ingram Reference Johnson and Ingram2004; Liu et al. Reference Liu, Song, Yuan, Sun, Liu and Wang2010; Yao et al. Reference Yao, Yang, Liu, Li and Chen2015).
In central Inner Mongolia, where climate conditions during the growing season are largely controlled by the East Asian monsoon, the isotope ratios are mainly controlled by the amount of precipitation with potential influence of temperature (Hoffmann and Heimann Reference Hoffmann and Heimann1997). Though the influence of temperature on the δD fractionation for plant leaf waxes is small (Johnson and Ingram Reference Johnson and Ingram2004; Liu et al. Reference Liu, Song, Yuan, Sun, Liu and Wang2010), we can not fully exclude the influence of temperature on the variation of δD records. However, as the temperature and precipitation amount tend to vary similarly (An Reference An2000), we focus on our discussion on the precipitation changes, which in turn reflects the intensity of summer monsoon. High precipitation results in lower isotope ratios, which imply a relatively strong monsoon, while higher isotope ratios imply a relatively weak monsoon.
With these controlling factors in mind, we can draw the following conclusions from our δD records of the n-acids in Doerji peat (Figure 4).
Period 10–9 ka: The δD of n-C20, n-C22, n-C24, n-C26 and n-C28 acids are all relatively high, as compared with the rest of the Holocene. This suggests that the precipitation in the Early Holocene was low and the climate was relatively dry.
Period 9–5.5 ka: All of the δD records of n-acids reached their lowest values in this period, recording a maximum precipitation value for the entire Holocene. This humid period was also reflected by the lithologic character of the sediments, composed of black sands and muds deposited when the water supply was abundant.
Period 5.5–0 ka: δD values of all of the n-acids increased steadily on a millennial timescale, since about 5.5 ka, with some smaller (~20‰) fluctuations on a centennial timescale. The overall trend indicates a gradual decrease in rainfall in the Late Holocene, as the climate becomes increasingly dry. Around 5.5 ka, the sediment in the profiles changed from a black silt layer to peat layer, indicating a shift in the sedimentary environment. That is a change from fluvial-lacustrine deposits to swamp deposits, as the regional water supply decreased. By analyzing the δD of the n-acids in modern reeds at the surface of the Doerji peat, we found that the δD of n-C20, n-C26 and n-C28 were –211‰,–192‰, and –202‰, respectively, all higher values than the δD values of the corresponding n-acids in the down-core sediments. This suggests that the present climate in central Inner Mongolia is the driest we have observed.
The pollen assemblage from Duoerji peat suggested local vegetation experienced from typical steppe, through mixed coniferous broad leaved forest, and then back to typical steppe since 9.1 ka, (Wang et al. Reference Wang and Sun1997), and reflected the paleoclimate changed through a sequence of cold–warm–cold, which is generally well compared with the dry–wet–dry sequence recorded by δD of n-acids.
In order to facilitate the following comparison and discussion, we calculated weighted average for n-C24, C26, C28 acids (δDwax).
 $$\delta {\rm D}_{{{\rm wax}}} {\equals}\left( {{\rm W}_{{{\rm C}24}} {\times}\delta {\rm D}_{{{\rm C}24}} {\plus}{\rm W}_{{{\rm C}26}} {\times}\delta {\rm D}_{{{\rm C}26}} {\plus}{\rm W}_{{{\rm C}28}} {\times}\delta {\rm D}_{{{\rm C}28}} } \right)\,/\,\left( {{\rm W}_{{{\rm C}24}} {\plus}{\rm W}_{{{\rm C}26}} {\plus}{\rm W}_{{{\rm C}28}} } \right)$$
δDwax of the Doerji peat was compared with other monsoon records from the East Asian monsoon region in Figure 5, in order to identify consistent Holocene paleoclimatic patterns. The overall trend of the various paleoclimate proxies is consistent. The summer monsoon rapidly increased in the period 9–8 ka and a relatively strong summer monsoon persisted until about 5.5 ka. This period, between 9–5.5 ka is the Holocene Optimum for the East Asia monsoon region. During this period, the δD record of the n-C24 acid of the Duoerji peat reached its lowest value (Figure 5a), indicating a maximum summer monsoon rainfall value. This is also when magnetic susceptibility of Baxie loess section in Gansu Province reached its highest value (Zhou et al. Reference Zhou, An, Lin, Xiao, Zhang, Xie and Zhou1992; Figure 5b), the δ18O records of the stalagmites in Dongge cave in Guizhou reached their lowest value (Dykoski et al. Reference Dykoski, Edward, Cheng, Yuan, Cai, Zhang, Lin, Qing, An and Revenaugh2005; Wang et al. Reference Wang, Cheng, Edwards, He, Kong, An, Wu, Kelly, Dykoski and Li2005; Figure 5c) and the (K2O+CaO+MgO)/(SiO2+Al2O3+TiO2) of a lacustrine sediment profile in Daihai, Inner Mongolia, also reached a maximum value (Sun Reference Sun2005; Figure 5d). Hence, paleomagnetic, isotopic, and geochemical proxies from a range of natural archives all reflect the intensity of the East Asian summer monsoon and the timing of the Holocene Optimum, a period of enhanced rainfall, soil development and chemical weathering. All the records show that the intensity of the East Asian summer monsoon gradually weakens after 5.5 ka, with an increasingly dry climate. It is also noteworthy that the δD of n-acids from Duoerji peat showed a relatively dry Early Holocene (10–9 ka, Figure 5a), which is not remarkable in Dongge cave record (Dykoski et al. Reference Dykoski, Edward, Cheng, Yuan, Cai, Zhang, Lin, Qing, An and Revenaugh2005; Wang et al. Reference Wang, Cheng, Edwards, He, Kong, An, Wu, Kelly, Dykoski and Li2005, Figure 5c). It could be true that they are real regional differences that reflect asynchronous Holocene optimum of the East Asian monsoon (An et al. Reference An, Porter, Kutzbach, Wu, Wang, Liu, Li and Zhou2000). It is also probably because Duoerji located nearby the arid Asian region where dominated today by the westerlies and experienced a dry Early Holocene (Chen et al. Reference Chen, Yu, Yang, Emi, Wang, David, Huang, Yan, Tomonori, John, Ian, Chen, An and Bernd2008).

Figure 5 Comparison of various paleoclimate proxy records from East Asian summer monsoon region over the past 10 ka: (a) n-C24 acid δD records in Duoerji sediments; (b) Magnetic susceptibility of Baxie loess section (Zhou et al. Reference Zhou, An, Lin, Xiao, Zhang, Xie and Zhou1992); (c) (K2O+CaO+MgO)/(SiO2+Al2O3+TiO2) of the lacustrine sediments in Daihai (Sun Reference Sun2005); (d) maximum value; (e) summer insolation change at 30º̊N (Kutzbach et al. Reference Kutzbach and Street-Perrott1985).
Figure 5 shows the results of a small sample of studies that provide evidence for the Holocene Optimum in the East Asian monsoon and many other examples have been described in the literature. For example, the Xilinguole profile in Inner Mongolia also shows a humid period from 9–6 ka (Jin et al. Reference Jin, Su, Sun, Zhang and Jin2004), and strata from Xiaoniuchang and Lake Haoluku at the south of the Hunshandake deserts record a humid period from 10–5.9 ka (Liu et al. Reference Liu, Cui, Tian and Xu2002). As indicated by high and variable median grain size values and silt contents of Daihai lake sediments, the Middle Holocene between ca. 7.9 and 3.1 ka was marked by intensified and highly variable monsoonal precipitation (Peng et al. Reference Peng, Xiao, Nakamura, Liu and Inouchi2005). Pollen-assemblage data from a sediment core from Hulun Lake in northeastern Inner Mongolia describe that grasses and birch forest expanded in 8000–6400 a BP, implying a remarkable increase in the monsoon precipitation (Wen et al. Reference Wen, Xiao, Chang, Zhai, X and Li2010).
Despite the correspondence between the above studies, the start and end of the Holocene Optimum appears to have a strong regional component, and sometimes divergent results are found in a single region. For example, diatom fossils from sediments in Lake Haolaihure, Inner Mongolia show that the warm and humid period 5.8–2.9 ka bracketed the Holocene Optimum (Guan et al. Reference Guan, Wamg, Yao, Chi and Zhao2010), while a grain size study from Anguli Nuur Lake, on the southern margin of the Inner Mongolian Plateau shows that the most humid climate occurred from 10.4–7 ka (Yin et al. Reference Yin, Liu, He, Zhao, Zhu, Wang, Liu and Wu2011). Perhaps these differences come from measurement uncertainties, chronological resolution, or proxy-specific issues. It could also be true that they are real regional differences that reflect an irregular northernmost margin of the East Asian monsoon. The existence of these contradictions will become clearer as additional paleoclimate records become available.
The millennial-scale trend of the East Asian monsoon records is in agreement with the solar radiation history for the Northern Hemisphere (Kutzbach et al. Reference Kutzbach and Street-Perrott1985. Figure 5e). The East Asian monsoon system responds quickly to summer solar radiation through the air-sea coupling, leading to climate change in the East Asian monsoon region. A cycle of insolation at much-lower frequency, resulting from progressive changes in the Earth’s orbital parameters since the last glaciation, is likely to be reflected in a similar pattern of monsoon variation on a multi-millennial time scale. In the Early Holocene, the solar radiation for the Northern Hemisphere was enhanced, and then led to the ocean feedbacks to orbital forcing, caused the East Asian summer monsoon activity became stronger. In the Middle Holocene, the solar radiation turned to be reduced, resulting in East Asian summer monsoon weakening (An et al. Reference An, Porter, Kutzbach, Wu, Wang, Liu, Li and Zhou2000).
CONCLUSIONS
Changes of Holocene precipitation in middle Inner Mongolia are reflected in the D/H (δD) ratios of n-C20, n-C22, n-C24, n-C26, n-C28 acids. During 10–9 ka, higher δD values indicate relatively less precipitation, while the lowest δD, from 9–5.5 ka indicates a maximum in precipitation for the entire Holocene. After 5.5 ka, gradually increasing δD values indicate a continual decrease in regional precipitation with time.
The past changing trend of the hydrogen isotopic composition of the Duoerji peat is consistent with that of other major paleoclimate proxies in the East Asian monsoon region. Records from most study sites provide a consensus date for the Holocene optimum in the East Asian monsoon region from 9–5.5 ka. This period marks the strongest East Asian monsoon activity in the Holocene, and was followed by a gradual and continual drying climate, up to the present day.
ACKNOWLEDGMENTS
This work was jointly supported by the National Natural Science Foundation of China, the foundations from the Ministry of Science and Technology of China and Shaanxi Public Welfare Special Project of geological prospecting. We thank Dr. Shaohua Song and Dr. Zhao Liu for their help in the field work. We also thank Dr. Juzhi Hou for his useful discussions of this work. Additionally, we are grateful for the time and experience provided by reviewers and editors.


