


INTRODUCTION
Executive functioning is an umbrella term that covers a set of higher-order cognitive abilities necessary to peruse and achieve a goal (Cristofori, Cohen-Zimerman, & Grafman, Reference Cristofori, Cohen-Zimerman and Grafman2019). Executive functions allow managing other cognitive skills, modifying overlearned behaviours, and generating adaptive responses to novel and complex situations (Collette, Hogge, Salmon, & Van der Linden, Reference Collette, Hogge, Salmon and Van der Linden2006). While there is no consensus yet about how to categorise executive functions, the main subdomains are working memory, inhibition capacity, cognitive flexibility, planning, reasoning, and problem-solving (Collete et al., Reference Collette, Hogge, Salmon and Van der Linden2006). The first three functions are regarded as the three core executive functions, while the others are considered higher-order functions based on the three core subdomains (Miyake et al., Reference Miyake, Friedman, Emerson, Witzki, Howerter and Wager2000; Friedman & Miyake, Reference Friedman and Miyake2017; Karr et al., Reference Karr, Areshenkoff, Rast, Hofer, Iverson and Garcia-Barrera2018).
Several models have been proposed to conceptualise the executive system and its mode of functioning (Jurado & Roselli, Reference Jurado and Rosselli2007). Although the different models have important differences in the ideation and the organisation of the executive system, they agree on the existence of several subfunctions or subdomains within the executive function, and the key role of the prefrontal cortex (Álvarez & Emory, Reference Alvarez and Emory2006). Although the prefrontal cortex is still considered to have the most prominent role in executive functions, specific subregions of the prefrontal cortex may have a more prominent role in some subfunctions (Cristofori et al., Reference Cristofori, Cohen-Zimerman and Grafman2019). In addition, executive dysfunction may also be present in cases with no frontal damage due to the dysfunction of some of the cortical or subcortical structures connected with the prefrontal cortex. In this regard, several networks have been proposed related to executive functioning (Yeo et al., Reference Yeo, Krienen, Sepulcre, Sabuncu, Lashkari, Hollinshead and Buckner2011; Witt, van Ettinger-Veenstra, Salo, Riedel, & Laird, Reference Witt, van Ettinger-Veenstra, Salo, Riedel and Laird2021). A recent image-based meta-analysis summarised the existence of four main executive networks and provided a standard nomenclature: dorsal frontoparietal network, left lateral frontoparietal network and right lateral frontoparietal network (or left and right central executive networks), and dorsomedial frontoparietal or anterior control network (Witt et al., Reference Witt, van Ettinger-Veenstra, Salo, Riedel and Laird2021).
Several neuropsychological tests have been developed for the assessment of executive functions and their components. For instance, digit span and N-back have been suggested for the assessment of working memory; Stroop test, go/no-go tasks, and Hayling test for inhibitory control; sorting tests for the assessment of cognitive flexibility; tower tests for planning; and Raven’s Progressive Matrices for reasoning (Matias-Guiu et al., Reference Matias-Guiu, Cabrera-Martín, Valles-Salgado, Rognoni, Galán, Moreno-Ramos and Matias-Guiu2019; Migliaccio et al., Reference Migliaccio, Tanguy, Bouzigues, Sezer, Dubois, Le Ber and Levy2020). Some of the most widely used tools are fluency tasks, which measure the voluntary generation of non-overlearned responses in a brief period (Robinson, Shallice, Bozzali, & Cipolotti, Reference Robinson, Shallice, Bozzali and Cipolotti2012). According to the response modality, it is possible to distinguish between verbal and non-verbal fluency tasks (design fluency). The specific subdomains of executive function assessed with fluency tasks are not well understood. In this regard, heterogeneous findings have been observed concerning the association between verbal fluency and working memory, inhibition control, and cognitive flexibility (Amunts, Camilleri, Eickhoff, Heim, & Weis, Reference Amunts, Camilleri, Eickhoff, Heim and Weis2020). Furthermore, the frontal-anatomic specialisation and lateralisation of fluency tasks remain also controversial (Henry & Crawford, Reference Henry and Crawford2004). While some studies report frontal specialisation in fluency tests, other studies also find the involvement of posterior-cortical regions (Robinson et al., Reference Robinson, Shallice, Bozzali and Cipolotti2012). Likewise, the lateralisation of functions (i.e., left frontal lobe and verbal fluency, right frontal lobe and design fluency) is also under debate (Cipolotti et al., Reference Cipolotti, Molenberghs, Dominguez, Smith, Smirni, Xu and Chan2020). These controversial results may be explained by the involvement of multiple cognitive processes not only related to the frontal lobes (Pa et al., Reference Pa, Possin, Wilson, Quitania, Kramer, Boxer and Johnson2010; Cole, Reynolds, & Power, Reference Cole, Reynolds, Power, Repovs, Anticevic and Braver2013; Bettcher et al., Reference Bettcher, Mungas, Patel, Elofson, Dutt, Wynn and Kramer2016; Matias-Guiu et al., Reference Matias-Guiu, Cabrera-Martín, Valles-Salgado, Pérez-Pérez, Rognoni, Moreno-Ramos and Matias-Guiu2017).
In verbal fluency, it is possible to distinguish different cognitive processes. Search strategies are required according to a specific cue (semantic or phonemic), and selection mechanisms would be necessary to give a correct answer among different outputs (Robinson et al., Reference Robinson, Shallice, Bozzali and Cipolotti2012). Due to the organisational structure of the lexicon (Henry & Crawford, Reference Henry and Crawford2004), a semantic cue would activate different outputs related to the semantic field of the cue, giving rise to different correct answers. In contrast, selection mechanisms would be more necessary after a phonemic cue, where more incorrect words from similar semantic fields would be activated and should be avoided according to the phonemic criterion of the task. In this regard, cortical and subcortical structures are relevant (Copland et al., Reference Copland, Brownsett, Iyer and Angwin2021). Therefore, semantic and phonemic fluency share several cognitive processes, including sustained attention, design of a search strategy, selection of words, inhibition of competing words, working memory, and language production. However, important differences in the selection mechanisms are present, in which phonemic fluency is based on orthography, while semantic fluency in semantic knowledge (Birn et al., Reference Birn, Kenworthy, Case, Caravella, Jones, Bandettini and Martin2010). Overall, this suggests that verbal fluency is a multidomain measure of cognitive functioning, especially executive functions and language (Whiteside et al., Reference Whiteside, Kealey, Semla, Luu, Rice and Roper2016). The different cognitive processes potentially involved support the functional magnetic resonance imaging studies, in which activation of several brain regions have been found, including the prefrontal cortex, dorsal anterior cingulate, left posterior temporal lobe, left inferior parietal lobe, and the left inferior frontal gyrus (Wagner, Sebastian, Lieb, Tüscher, & Tadic, Reference Wagner, Sebastian, Lieb, Tüscher and Tadic2014).
In design fluency, the creation of unique designs (Robinson et al., Reference Robinson, Shallice, Bozzali and Cipolotti2012) and the monitoring of responses (Possin et al., Reference Possin, Chester, Laluz, Bostrom, Rosen, Miller and Kramer2012; Robinson et al., Reference Robinson, Shallice, Bozzali and Cipolotti2012) are essential for correct task performance. Conversely, selection processes of known outputs are probably more relevant in verbal fluency tasks than in design fluency (Robinson et al., Reference Robinson, Shallice, Bozzali and Cipolotti2012). Due to the task demands, processing speed, motor planning, visual scanning, and cognitive flexibility are required (Possin et al., Reference Possin, Chester, Laluz, Bostrom, Rosen, Miller and Kramer2012). The performance in design fluency involves both hemispheres, especially right frontal processes (Baldo et al., Reference Baldo, Shimamura, Delis, Kramer and Kaplan2001; Ruff et al., Reference Ruff, Allen, Farrow, Niemann and Wylie1994). However, there is not a specific network in the prefrontal cortex related to the creation mechanism (Robinson et al., Reference Robinson, Shallice, Bozzali and Cipolotti2012), and its relationship with fluid intelligence remains unclear (Roca et al., 2010; Robinson et al., Reference Robinson, Shallice, Bozzali and Cipolotti2012). As new responses are generated, executive functions (Lee et al., Reference Lee, Strauss, Loring, McCloskey, Haworth and Lehman1997) and visual working memory associated with the occipital and parietal cortex (Schurgin, Reference Schurgin2018) seem to be necessary to avoid repetition errors.
Verbal fluency tasks have been considered an easily administered and helpful tool during the neuropsychological assessment of dementia. In this regard, verbal fluency tasks are helpful for screening (Olazaran et al., Reference Olazarán, Hoyos-Alonso, del Ser, Garrido Barral, Conde-Sala, Bermejo-Pareja and Carnero-Pardo2016) and are also included in commonly used tests in diagnosis such as the Addenbrooke’s Cognitive Examination III (ACE-III) (So et al., Reference So, Foxe, Kumfor, Murray, Hsieh, Savage and Piguet2018). In addition, the comparison between semantic fluency and phonemic fluency scores has been suggested for the prediction of conversion from amnesic mild cognitive impairment (aMCI) to dementia. While healthy subjects generally are able to produce more words during semantic fluency than letter fluency, in patients with aMCI at risk of progression the difference between semantic and letter fluency score is reduced. (Vaughan, Coen, Kenny, & Lawlor, Reference Vaughan, Coen, Kenny and Lawlor2018; Sutin, Stephan, & Terracciano, Reference Sutin, Stephan and Terracciano2019). In contrast, design fluency has been less studied, but may also have some clinical value (Suchy, Kraybill, & Gidley Larson, Reference Suchy, Kraybill and Gidley Larson2010; Possin et al., Reference Possin, Chester, Laluz, Bostrom, Rosen, Miller and Kramer2012).
Alzheimer’s disease (AD) is the most common cause of dementia (Alzheimer Association, 2019), while frontotemporal dementia (FTD) is the second most common cause of dementia in adults under 65 years (Olney, Spina, & Miller, Reference Olney, Spina and Miller2017). While the term FTD includes a spectrum with different variants and symptoms of the disease, the behavioural variant of FTD (bvFTD) shows a set of particular symptoms and is the most frequent clinical phenotype of the frontotemporal lobar degeneration (Olney et al., Reference Olney, Spina and Miller2017). The most prominent symptoms are memory impairment in AD, and social cognition deficits and executive dysfunction in bvFTD (Rascovsky et al., Reference Rascovsky, Hodges, Knopman, Mendez, Kramer, Neuhaus and Hillis2011). AD patients show lower performance in semantic fluency tasks than in phonemic fluency tasks. Retrieval of words according to a semantic cue involves the integrity of semantic storage commonly associated with temporal regions (Henry, Crawford, & Phillips, Reference Henry, Crawford and Phillips2004), which could explain the low scores on semantic fluency in AD patients. However, retrieval of words also implies strategic search and retrieval processes. These are more associated with executive function, which could explain the semantic fluency impairment in AD patients due to executive dysfunction, resulting in low performance in semantic fluency tasks and also in other fluency tasks, such as design fluency (Peter et al., Reference Peter, Kaiser, Landerer, Köstering, Kaller, Heimbach and Klöppel2016).
Patients with bvFTD show verbal fluency impairments with clustering of words and switching difficulties (Van Den Berg, Jiskoot, Grosveld, Van Swieten, & Papma, Reference van den Berg, Jiskoot, Grosveld, van Switen and Papma2017) as well as design fluency impairment, especially showing more repetition errors (Possin et al., Reference Possin, Chester, Laluz, Bostrom, Rosen, Miller and Kramer2012). Regarding repetition errors, self-monitoring seems to be crucial to avoid them and has been associated with the orbitofrontal cortex. In addition, design fluency has been associated with right and left superior frontal gyri, left pars opercularis, right and left inferior parietal cortex, left superior parietal cortex, and superior temporal gyrus (Possin et al., Reference Possin, Chester, Laluz, Bostrom, Rosen, Miller and Kramer2012).
However, further studies are necessary to integrate the cognitive processes involved in fluency tasks in neurodegenerative diseases such as AD and bvFTD. And also its anatomical correlates, specifically considering the controversial results reported in the literature about the clinical particularities and its neural correlates of fluency tasks in both diseases (as summarised in Table 1) and the need for more studies about design fluency. The study of the correlations between fluency tasks, including design fluency, and other cognitive tests could contribute to a better understanding of cognitive processes underlying fluency performance in AD and bvFTD. The assessment of the neural correlates in both clinical groups and using different fluency tasks may help clarify the underpinnings of fluency than studies only focused on a specific fluency task or a specific disorder. The knowledge of cognitive processes and neural basis involved in a particular neuropsychological test are necessary to further understand the neuropsychological assessments, improving the interpretation of findings. In this regard, our hypothesis was that verbal and design fluencies may be associated with distinct neuropsychological processes in AD and bvFTD, showing different patterns of clinical impairment and neural basis due to the predilection of these disorders for different brain regions at the disease onset and during progression. Accordingly, our aim was twofold: first, to assess the verbal and design fluency in patients with AD and bvFTD and to evaluate the correlation with other neuropsychological tests to define the different cognitive processes involved in each group; and second, to analyse the neural basis of fluency tasks in both AD and bvFTD.
Table 1. Main studies about verbal and/or design fluency with neuroimaging in AD and bvFTD
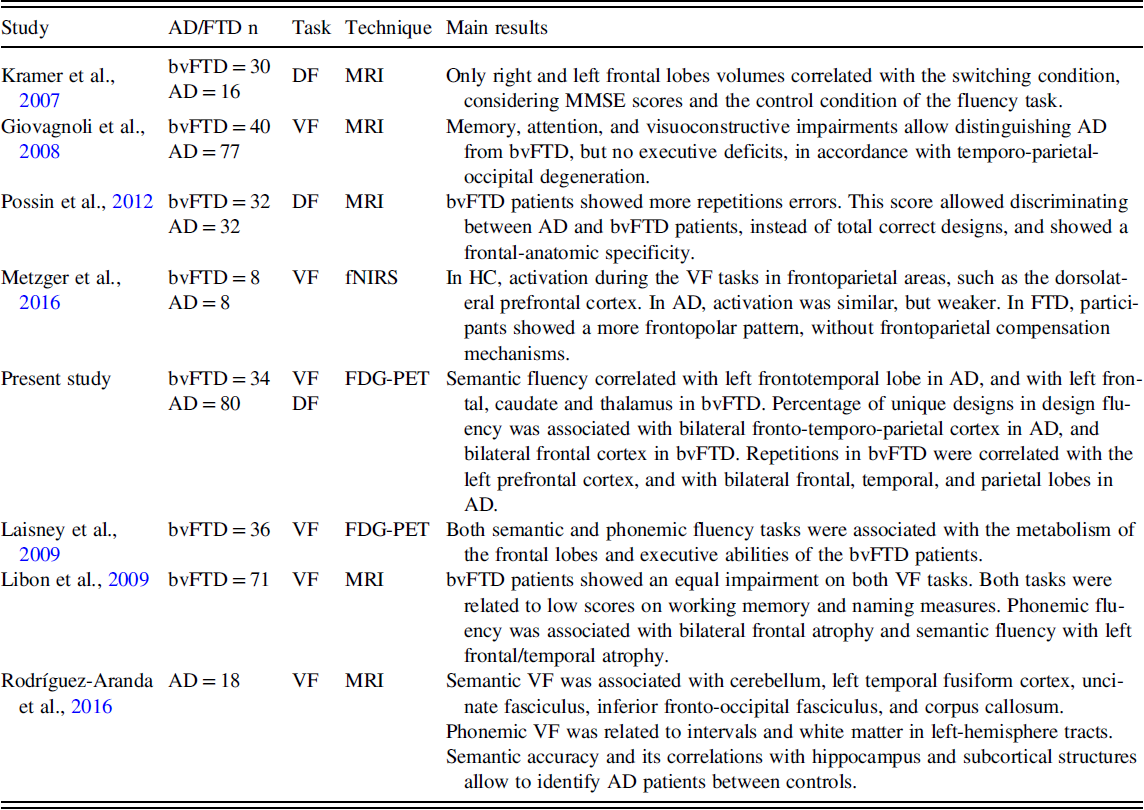
AD, Alzheimer’s disease group; bvFTD, behavioural variant frontotemporal dementia group; HC, healthy control group; DF, design fluency; VF, verbal fluency; MRI, magnetic resonance imaging; FDG-PET, positron emission tomography with 18F-fluorodeoxyglucose; fNIRS, functional near-infrared spectroscopy; MMSE, Mini-Mental State Examination.
METHODS
Participants
One hundred and forty-two participants were enrolled: 80 patients with AD, 34 patients with bvFTD, and 28 healthy controls (HCs). Main demographic and clinical characteristics are shown in Table 2.
Table 2. Demographic characteristics

AD, Alzheimer’s disease group; bvFTD, behavioural variant frontotemporal dementia group; HC, healthy control group; MMSE, Mini-Mental State Examination scores; CDR, Clinical Dementia Rating scores.
Statistically significant differences in post hoc analysis: a = AD versus bvFTD, b = bvFTD versus HC, c = AD versus HC, and * = Chi-Squared.
All patients were diagnosed after a comprehensive clinical and neuropsychological protocol, and they had confirmation by biomarkers (fluorodeoxyglucose positron emission tomography [FDG-PET] or cerebrospinal fluid) and/or by clinical progression during the follow-up (McKhann et al., Reference McKhann, Knopman, Chertkow, Hyman, Jack, Kawas and Mohs2011). All patients with AD debuted with memory loss (Morris, Reference Morris1993). All patients with bvFTD met current diagnostic criteria (Rascovsky et al., Reference Rascovsky, Hodges, Knopman, Mendez, Kramer, Neuhaus and Hillis2011). Complete information about inclusion and exclusion criteria for AD, bvFTD, and HCs is shown in Supplementary Methods.
All procedures performed were in accordance with the ethical standards of the institutional research committee and with the 1964 Helsinki declaration and its later amendments. The local Research Ethics Committee approved the research protocol.
Neuropsychological assessment
Cognitive assessment was performed using Mini-Mental State Examination (MMSE) (Folstein, Folstein, & McHugh, Reference Folstein, Folstein and McHugh1975), ACE-III (Matias-Guiu et al., Reference Matias-Guiu, Fernández-Bobadilla, Fernández-Oliveira, Valles-Salgado, Rognoni, Cortés-Martínez and Matias-Guiu2016), and the neuropsychological battery Neuronorma (Peña-Casanova et al., Reference Peña-Casanova, Blesa, Aguilar, Gramunt-Fombuena, Gómez-Ansón, Oliva and Sol2009). More details are shown in Supplementary Methods. None of the fluency tasks was used in the diagnosis and group classification. All neuropsychological tests have suitable psychometric properties (Lezak et al., Reference Lezak, Howieson, Loring and Fischer2004; Peña-Casanova, Gramunt Fombuena, & Gich Fullà, Reference Peña-Casanova, Gramunt Fombuena and Gich Fullà2004; Strauss, Sherman, & Spreen, Reference Strauss, Sherman and Spreen2006).
Fluency tasks
Verbal fluency was assessed with a semantic fluency task (animals) and a phonemic fluency task (words beginning with “p”) in one minute. Design fluency was assessed with the Five-Point Test (5-PT) (Regard, Strauss, & Knapp, Reference Regard, Strauss and Knapp1982), considering the norms from Matias-Guiu et al., Reference Matias-Guiu, Pytel, Delgado-Álvarez, Delgado-Alonso, Cortés-Martínez, Fernández-Oliveira and Matias-Guiu2021 (Figure 1). We used a modification of the test with three-time intervals (1, 2, and 3 min) (Matias-Guiu et al., Reference Matias-Guiu, Pytel, Delgado-Álvarez, Delgado-Alonso, Cortés-Martínez, Fernández-Oliveira and Matias-Guiu2021) to capture the task’s dynamics. Details about the procedure of administration are specified in Supplementary Methods.

Fig. 1. Five-Point test. First row shows the template of the test, while second to fourth rows show examples of unique designs.
Statistic analysis
Statistical analysis was performed using SPSS Statistics 22.0 and R version 3.6.3. Descriptive data are shown as mean ± standard deviation. Chi-squared test (χ2) was used to compare qualitative variables. Analysis of the variance (ANOVA) with post hoc analysis using the Tukey test was calculated to evaluate intergroup differences. Effect sizes were estimated using eta squared, considering the effect as small (eta squared = .010), moderate (.058), or large (.137). We also calculated correlations between fluency tasks and with other neuropsychological tests using Pearson’s coefficient. The automatic linear modelling procedure (LINEAR) was used to identify the neuropsychological tests that best predict each fluency task in AD and bvFTD separately, using stepwise forward and information criterion. All tests of the Neuronorma battery were introduced in the model for each fluency task (semantic fluency, phonemic fluency, 5PT-1, and 5PT-3). A p-value <.05 was considered statistically significant. All measures were analysed using raw scores.
18F-FDG-PET acquisition, preprocessing, and analysis
We conducted 18FDG-PET imaging on all participants. Images were acquired according to the European guidelines for brain PET imaging (Varrone et al., Reference Varrone, Asenbaum, Vander Borght, Booij, Nobili, Någren, Darcourt, Kapucu, Tatsch, Bartenstein and Van Laere2009) in a PET-CT Siemens Biograph True Point scan. Images were acquired after sensory rest. Details about parameters of acquisition are shown in Supplementary Methods.
Statistical Parametric Mapping version 12 (The Wellcome Trust Centre for Neuroimaging, Institute of Neurology, University College of London) was used for the preprocessing and statistical analysis of images. Normalisation to the Montreal Neurological Institute was performed using a specifically validated FDG-PET template for dementia (Della Rosa et al., Reference Della Rosa, Cerami, Gallivanone, Prestia, Caroli, Castiglioni, Gilardi, Frisoni, Friston, Ashburner and Perani2014). Smoothing was applied using 12 mm of full width at half maximum. Cerebellum was used as reference for scaling. A multiple regression analysis was used to evaluate the correlations between fluency tasks and brain metabolism. Age, years of formal education, sex, and diagnosis (AD, bvFTD, or HC) were used as nuisance covariates. Furthermore, the same analyses were performed restricted to the group with AD and bvFTD to evaluate the metabolic correlates specifics for these entities. An uncorrected p-value <.001 was considered statistically significant with an extent threshold k = 50. However, clusters surviving family-wise error corrected p-value < .05 were also specified.
In addition, clusters of regression analysis for each test were combined, and the total volume was calculated for each one. The volume of overlap with each of the four main executive networks was calculated (dorsal attention, anterior control, left central executive, and right executive networks) (http://identifiers.org/neurovault.collection:8448) (Witt et al., Reference Witt, van Ettinger-Veenstra, Salo, Riedel and Laird2021). Then, two percentages of overlap were calculated using the volume of overlap as the numerator and two denominators: on the one hand, the total volume associated with each test in whole-brain voxel-based analysis; and on the other hand, with the total volume of each executive network. This analysis was used as an indirect measure of the degree of participation of each executive network in the performance of each fluency task.
RESULTS
Verbal fluency
We found a significant effect group for semantic and phonemic fluency. Effect size was large in semantic fluency (.197), and moderate in phonemic fluency (.132). Post hoc analysis showed that AD and bvFTD groups obtained on average lower scores than the HC group in semantic and phonemic fluency. In addition, bvFTD scored on average lower than AD in both tasks (Table 3). Considering the normative data, 32 (41.02%) of patients with AD showed a low performance (age-, sex-, and education-adjusted scaled scores ≤6) in semantic fluency and 22 (28.57)% in phonemic fluency. Regarding the bvFTD group, 22 (68.75%) showed impairment in semantic fluency and 15 (46.87%) in phonemic fluency.
Table 3. Fluency tasks performance across groups

AD, Alzheimer’s disease group; bvFTD, behavioural variant frontotemporal dementia group; HC, healthy control group. 5-PT, Five-Point Test: unique designs between 0 and 60 s (5PT-1), between 0 and 120 s (5PT-2), and between 0 and 180 s (5PT-3). Repetitions: number of repetitions between 0 and 60 s (Repetitions-1), between 0 and 120 s (Repetitions-2), and between 0 and 180 s (3 min, Repetitions-3). PUD, percentage of unique designs considering all designs at 1 (PUD-1), 2 (PUD-2), and 3 min (PUD-3).
Statistically significant differences in post hoc analysis: a = AD versus HC, b = AD versus bvFTD, and c = bvFTD versus HC.
Design fluency
ANOVA showed a significant group effect for the 5-PT (unique designs) at 1, 2, and 3 min, repetitions at 2 and 3 min; percentage of unique designs (PUD) at 2 and 3 min. Effect sizes were moderate in 5-PT at 1 (.079), 2 (.063), and 3 min (.082); small in PUD at 1 min (.041) and moderate at 2 (.072) and 3 min (.120); small in repetitions at 1 min (.017), and moderate in repetitions at 2 min (.047) and 3 min (.042). Considering the number of unique designs, 28 (35%) AD patients showed impaired (≤6) age- and education-adjusted scaled scores at 1 and 2 min, and 22 (27.5%) showed deficit scores at 3 min. In bvFTD, 15 (44.1%) showed deficit scores at 1 and 2 min, and 14 (41.2%) at 3 min. Post hoc analysis showed that AD and bvFTD groups obtained on average lower scores than HC in 5-PT at 1, 2, and 3 min. AD group showed on average a lower performance than HC in PUD-3. BvFTD group showed on average a lower performance than HC in repetitions at 2 and 3 min, PUD-2, and PUD-3 (Figure 2). There were non-significant differences between AD and bvFTD.
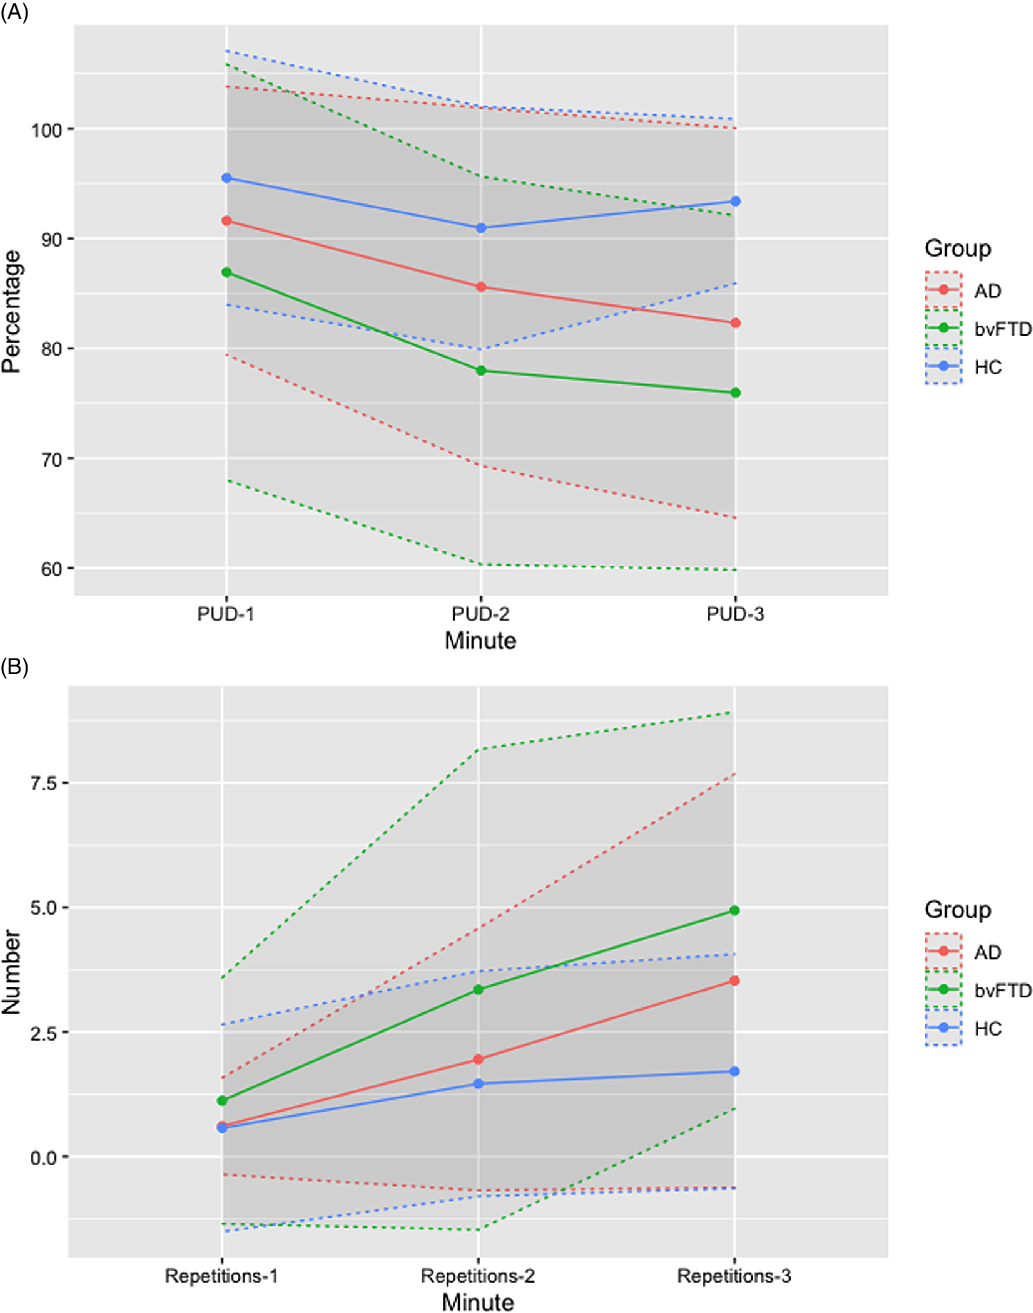
Fig. 2. Percentage of Unique Designs (PUD) and number of repetitions at 1, 2, and 3 min in Alzheimer’s disease (AD), behavioural variant Frontotemporal Dementia (bvFTD), and healthy control. Means are shown as points and standard deviation as dashed lines.
Prediction of fluency tasks using other cognitive tests
Correlations between fluency tasks with other neuropsychological tests are shown in Figure 3 for the whole sample, AD, and bvFTD.

Fig. 3. Heat map of Pearson correlations between fluency tasks and the other neuropsychological tests. (A) Whole sample. (B) AD group. (C) bvFTD group.
AD performed significantly worse than bvFTD in Free and Cued Selective Reminding Test (FCSRT) (total free recall) (t = 3.286, p = .001), FCSRT (total recall) (t = 3.528, p = .001), FCSRT (total delayed recall) (t = 4.121, p < .001), Rey-Osterrieth Complex Figure (ROCF) at 3 min (t = 2.185, p = .031), and ROCF at 30 min (t = 3.266, p = .001). The automatic linear modelling identified the Boston Naming test, Corsi backward and Stroop part C as the best predictors for semantic fluency, and digit span backward, FCSRT (total delayed recall), ROCF at 30 min, Tower of London (ToL) total moves, Stroop part A, and ROCF (recognition memory) for phonemic fluency. The models explained 44.8% and 52.6% of the variance, respectively. For design fluency, ROCF at 3 min, digit span backward, and Symbol Digit Modalities Test (SDMT) were included as the best predictors of 5PT-1, explaining 38.6% of the variance. For 5PT-2, see Supplementary Table S1-A. For 5PT-3, the model selected FCSRT (total free recall), Stroop A, digit span backward, SDMT, ToL (total moves), ROCF (time copy), FCSRT (total recall), and ROCF at 3 min, and explained a 56.0% of the variance.
The bvFTD group performed worse than AD in digit span backward (t = −2.076, p = .040) and ROCF time copy (t = −3.134, p = .002). The automatic linear modelling selected FCSRT (total recall), ToL (total moves), Stroop part B, and ROCF (time of copy) as the best predictors for semantic fluency, explaining a 70.0% of the variance of the test. In the case of phonemic fluency, the tests included were Trail Making Test (part A), Boston Naming Test, digit span forward, Stroop part B, ROCF at 30 min, ROCF recognition memory, Visual Object and Space Perception Battery (VOSP) (number location), and ToL (correct moves), accounting for a 76.0% of the variance. For 5PT-1, SDMT, digit span backward, ToL (correct moves), and ToL (solving time) were identified as the best predictors, accounting for 75.1% of the variance. For 5PT-2, see Supplementary Table S1-B. For 5PT-3, the tests included in the model were Stroop part A, Boston Naming Test, ToL (correct moves), VOSP (number location), and ROCF (recognition memory). The model explained 61.9% of the variance. Regression models are shown in Supplementary Table S2.
Regarding the common predictors of fluency tasks in AD and bvFTD, BNT showed a greater weight in AD (importance = .511 in semantic fluency) than bvFTD (importance = .149 in phonemic fluency, .217 in 5PT-3). Similarly, digit span backward showed more importance in AD (importance = .285 in phonemic fluency, .335 in 5PT-1, .120 in 5PT-3) than in bvFTD (importance = .260 in 5PT-1). In contrast, Stroop part A showed a greater weight in bvFTD (importance = .483 in 5PT-3) than AD (importance = .106 in phonemic fluency, .126 in 5PT-3). FCSRT total recall showed more importance in bvFTD (importance = .615 in semantic fluency) than AD (importance = .084 in 5PT-3). ROCF 30 min showed similar weights in the same fluency task in both groups (bvFTD importance = .128, AD importance = .111 in phonemic fluency). ROCF recognition also showed similar weights in bvFTD (importance = .114 in phonemic fluency, .062 in 5PT-3) and AD (importance = .106 in phonemic fluency). Finally, ToL total moves showed more weight in bvFTD (importance = .224 in semantic fluency) than in AD (importance = .110 in phonemic fluency, .095 in 5PT-5).
Neural correlates in AD and bvFTD
In AD, semantic fluency was positively correlated with a large cluster involving several left temporal regions (superior, middle, and inferior temporal, superior and middle temporal pole, uncus, and parahippocampal and fusiform gyri). It was also correlated with some smaller clusters including the left inferior frontal gyrus, and right temporal lobe (Figure 4). Phonemic fluency showed no suprathreshold clusters.

Fig. 4. Voxel-based brain mapping analysis showing the correlation between semantic fluency and brain metabolism in AD (yellow) and bvFTD (red) (uncorrected p-value <.001, k = 50). Labels in the z axis are shown.
Repetitions were correlated with bilateral temporal, parietal and frontal lobes, including superior, middle, and inferior temporal gyri, parahippocampal gyrus, precuneus, angular and fusiform gyri, parietal lobules, superior, medial, middle, and inferior frontal gyrus, and anterior cingulate (Figure 5).
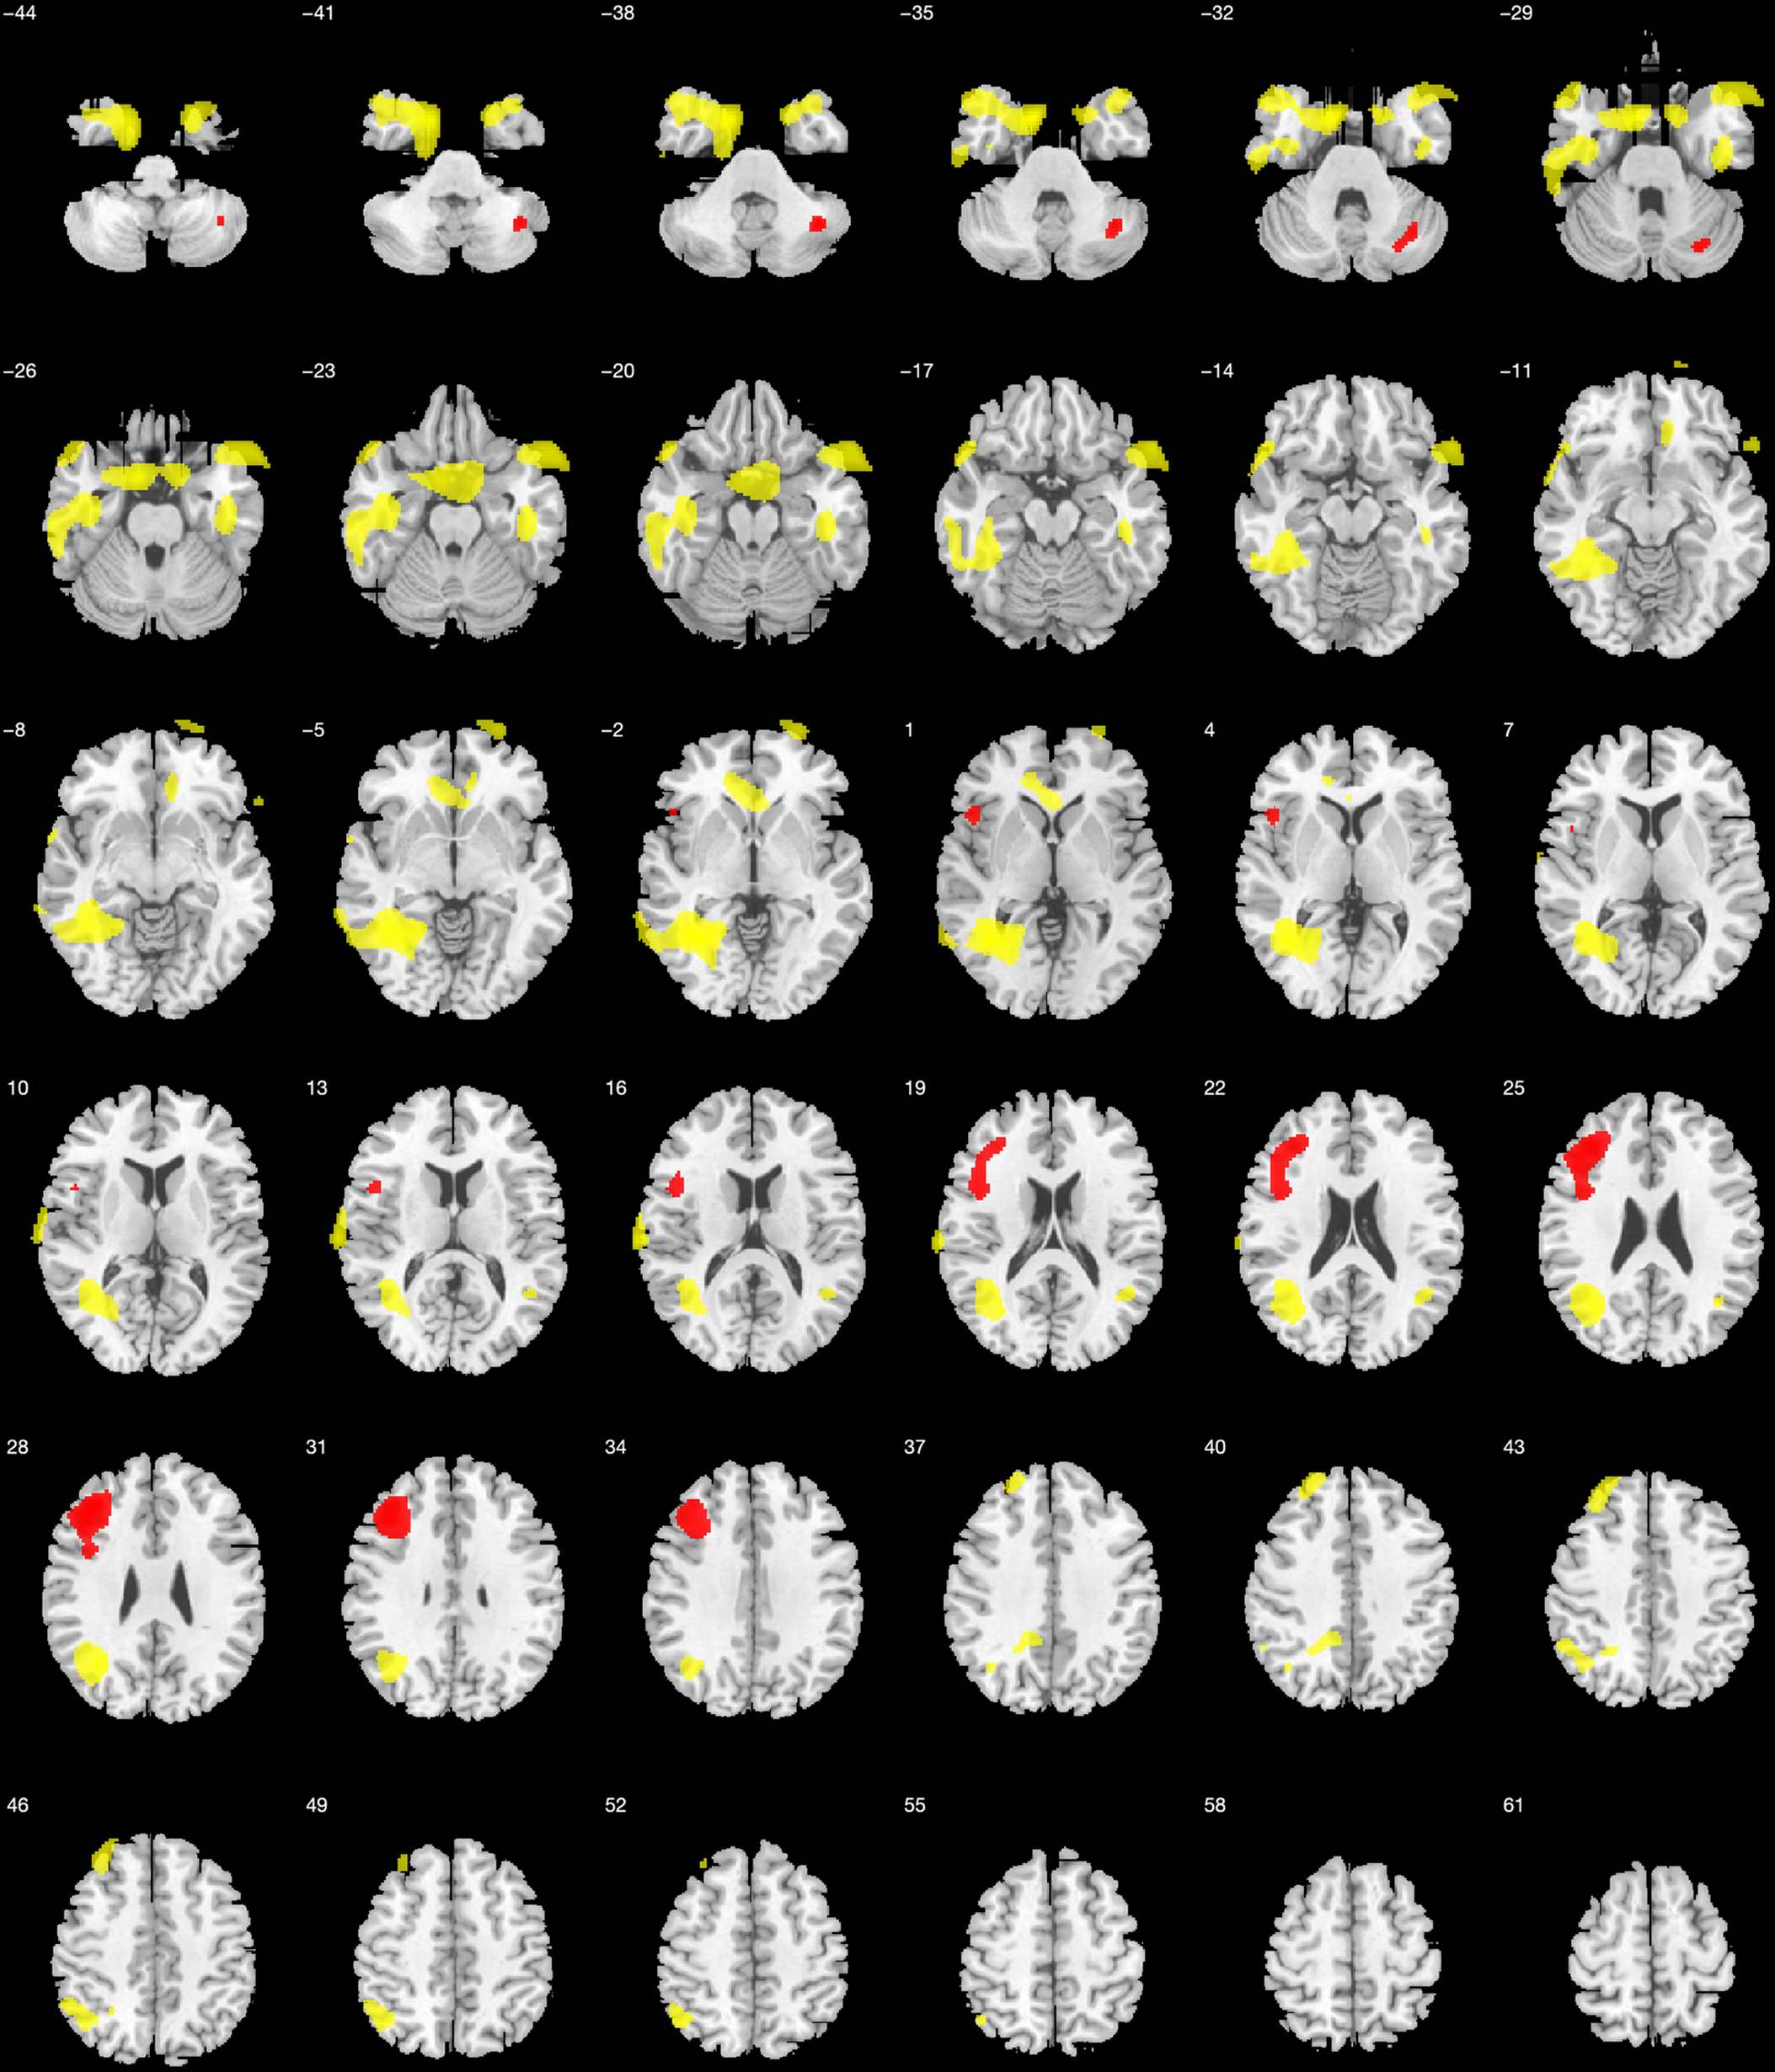
Fig. 5. Voxel-based brain mapping analysis showing the correlation between design fluency repetitions at 1 min with brain metabolism in AD (yellow) and bvFTD (red) (uncorrected p-value <.001, k = 50). Labels in the z axis are shown.
The PUD-1 correlated with several clusters involving large regions in the bilateral parieto-temporal and frontal lobes, including the superior, middle, and inferior temporal gyri, precuneus, fusiform and lingual gyri, superior and inferior parietal lobule, supramarginal and angular gyri, superior, middle, and inferior frontal gyri, anterior cingulate, and precentral gyrus (Figure 6A). The correlation with PUD-2 showed no suprathreshold clusters. At 3 min, the PUD correlated with bilateral frontal lobe, mainly on the right side, and bilateral parieto-temporal lobes.
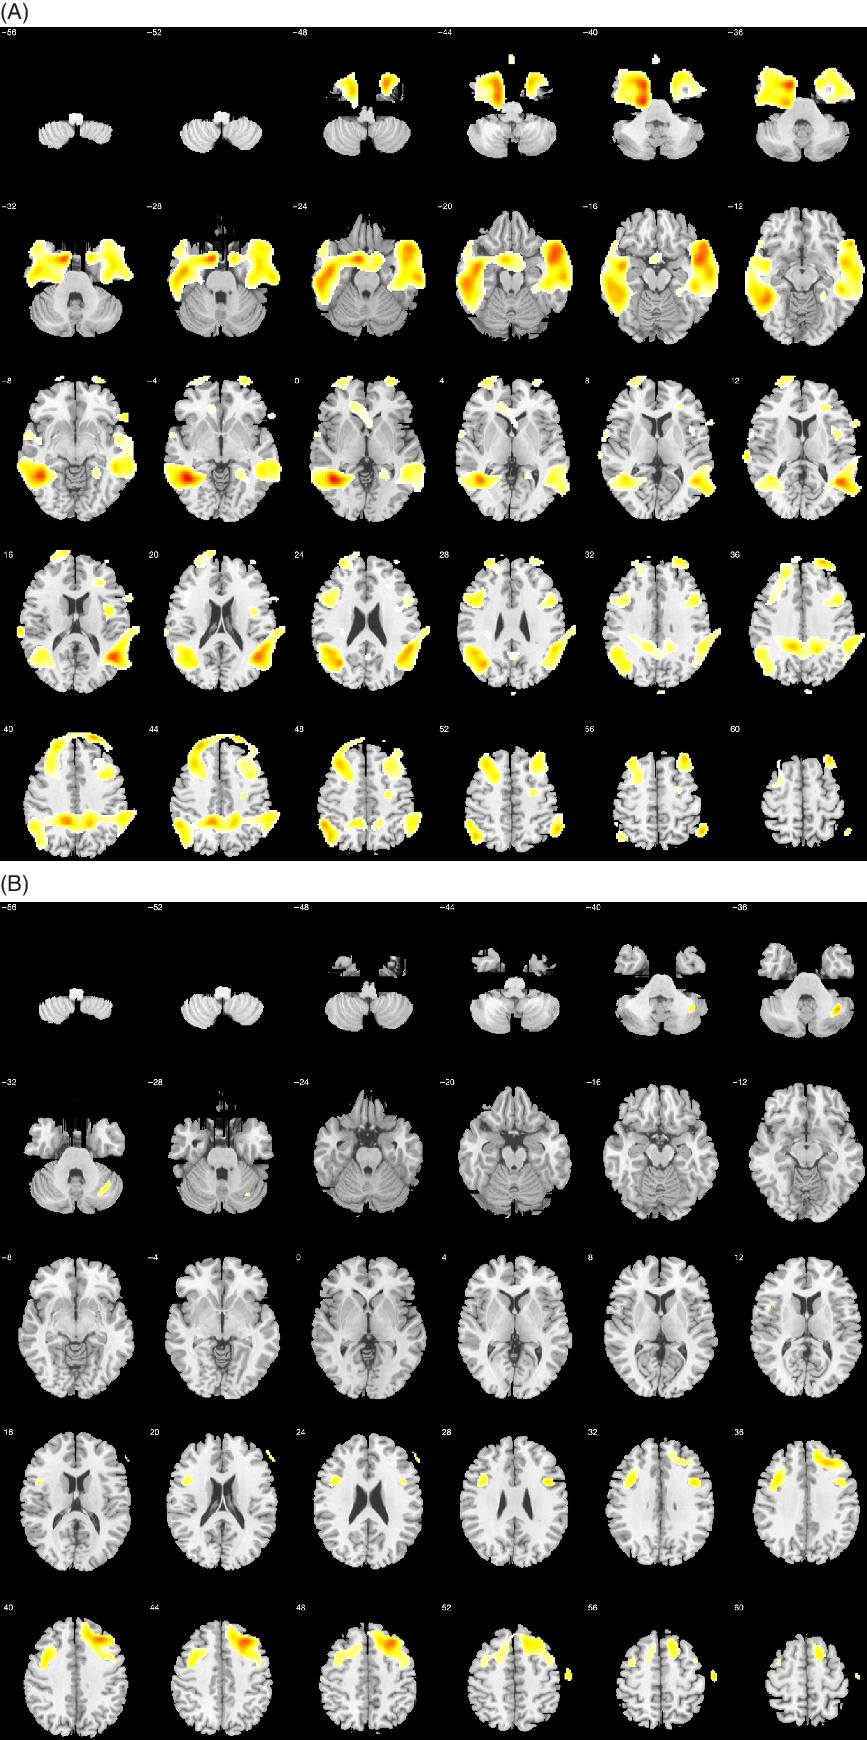
Fig. 6. Voxel-based brain mapping analysis showing the correlation between PUD-1 and brain metabolism in the (A) AD group and (B) the bvFTD group (uncorrected p-value <.001, k = 50). Labels in the z axis are shown.
In bvFTD, semantic fluency was positively correlated with the left superior, middle, and medial frontal gyri, and with left thalamus and caudate (Figure 4). Phonemic fluency correlated with the bilateral frontal lobe, especially on the left side. Repetitions were correlated with the left superior, middle, and inferior frontal gyri, and the posterior cerebellar lobe. (Figure 5). The PUD-1 were correlated with both frontal lobes, mainly on the right hemisphere (Figure 6B). Specifically, this score was correlated with right middle, superior, medial, and inferior frontal gyri, precentral gyrus, and supplementary motor area. In addition, a small cluster was significant in the right posterior cerebellar lobe. The PUD-2 has similar correlates. Conversely, PUD-3 showed no suprathreshold clusters.
Coordinates and statistics of correlations in the groups of patients with AD and bvFTD are shown in Supplementary Table S3 and Supplementary Table S4, respectively.
The percentage of overlap between brain regions associated with each task and brain regions related to the main four executive networks are summarised in Figure 7. Executive networks were more related to design fluency (PUD-1 and Repetitions) than semantic fluency in both AD and bvFTD. In the bvFTD was some overlap with the anterior control network and semantic fluency, but there was almost no overlap in the case of AD. Regarding the specific networks, the left central executive network showed greater overlap than the other networks across all the tasks. Anterior central executive network and right central executive also showed an important overlap in PUD-1. Dorsal attention network overlapped specially for PUD-1 in bvFTD. In PUD-1, four networks revealed some degree of involvement in both AD and bvFTD. In Repetitions, the left central executive network showed higher overlap than the others in both AD and bvFTD.

Fig. 7. Percentage of overlap between brain regions associated with each test in AD and bvFTD, and brain regions related with the four main executive networks. (A) Percentage of overlap according to the volume of clusters correlated with each task in the voxel-based analysis. (B) Percentage of overlap according to the volume of each executive network. Anterior central (green), dorsal attention (red), left central (cyan), and right central (purple) executive networks.
Neural correlates in the whole sample are shown in Supplementary Table S5 and Supplementary Figure.
DISCUSSION
The aim of the present study was to describe the clinical and anatomical correlates of verbal and design fluency in patients with AD and bvFTD. These disorders constitute an interesting model for studying brain-behaviour relationships (Wittenberg et al., Reference Wittenberg, Possin, Rascovsky, Rankin, Miller and Kramer2008). Semantic and phonemic fluency showed the largest effect sizes, and showed statistically significant differences between AD and bvFTD versus HC, and between AD versus bvFTD. This finding confirms previous studies about the usefulness of semantic and phonemic fluencies in the diagnostic framework of patients with AD and bvFTD (Rascovsky, Salmon, Hansen, Thal, & Galasko, Reference Rascovsky, Salmon, Hansen, Thal and Galasko2007). Regarding the design fluency, AD and bvFTD patients showed on average a lower performance in unique designs in comparison to HC. Application of normative data showed percentages of impairment in unique designs in design fluency and correct responses in verbal fluency in between 27% and 68% depending on the fluency task, generally with a high frequency of impairment in bvFTD. However, the performance of both clinical groups was different considering the PUD and repetitions. AD patients scored on average lower than HC in PUD at 3 min, while bvFTD scored on average lower than HC in PUD at 1, 2, and 3 min. In addition, bvFTD showed on average more repetitions than HC, while AD did not. The examination of the behaviour during the test along the time may be useful to interpret the cognitive processes involved in the test. The low performance on average of bvFTD patients during the test may be explained by the impairment of executive components, mainly associated with prefrontal regions (Robinson et al., Reference Robinson, Shallice, Bozzali and Cipolotti2012). Interestingly, AD showed on average a low performance mainly at the end of the fluency task, increasing the repetitions. This also suggests different cognitive processes participating in the same task in each disease. Low performance on average in bvFTD could be explained by impairment in initiation, flexibility, shifting, inhibition with perseverating behaviour and difficulties in strategy generation. Conversely, the increase in repetitions in the third minute in patients with AD emphasises also the role of visual working memory and short-term memory. Memory impairment could be more evident as the test progresses and more designs should be remembered in order to avoid repetitions. According to the working memory model of Baddeley (Baddeley, Reference Baddeley2000), it is possible to distinguish the central executive, the phonological loop, and the visuospatial sketchpad, which would be key for visual and spatial aspects. Thus, the central executive would coordinate both phonological and visuospatial systems, and the episodic buffer would provide a temporary interface between both slave systems and episodic memory (Stopford, Thompson, Neary, Richardson, Snowden, Reference Stopford, Thompson, Neary, Richardson and Snowden2012). Repetition errors could be related to working memory and episodic memory deficits in AD, while repetition errors in bvFTD could be explained by executive functioning impairment (Stopford et al., Reference Stopford, Thompson, Neary, Richardson and Snowden2012). In this regard, correlation analysis and automatic linear modelling support this interpretation. In AD, 5PT-1, and 5PT-3 are mainly explained by a combination of episodic memory and attention/executive functioning tests. In contrast, in bvFTD, the tests selected by the automatic linear modelling were mainly associated with attention and executive dysfunction, and only one test linked to visual memory (ROCF recognition) was present in 5PT-3 with a lower importance.
Regarding verbal fluency, both AD and bvFTD patients obtained on average lower scores than HC in semantic and phonemic fluency. These results are in agreement with previous studies showing a high sensitivity for verbal fluency in the diagnosis of these entities, but with low specificity (Laisney et al., Reference Laisney, Matuszewski, Mézenge, Belliard, de la Sayette, Eustache and Desgrandes2009; Rodríguez-Aranda et al., Reference Rodríguez-Aranda, Waterloo, Johnsen, Eldevik, Sparr, Wikran, Herder and Vangberg2016). In this case, automatic linear modelling selected a combination of language, memory, and attention-executive functioning tests that predicted semantic and letter fluency. Memory tests were also correlated with fluency tasks in bvFTD. Although memory was initially considered largely preserved in bvFTD, recent studies have confirmed that memory dysfunction is present from early stages at least in a proportion of patients with bvFTD (Fernández-Matarrubia et al., Reference Fernández-Matarrubia, Matías-Guiu, Cabrera-Martín, Moreno-Ramos, Valles-Salgado, Carreras and Matias-Guiu2017; Poos et al., Reference Poos, Jiskoot, Papma, van Swieten and van den Berg2018).
One of the most interesting findings is the correlation of the different fluency tasks with brain metabolism at rest. Many areas are involved in design fluency including anterior and posterior areas, and left and right hemispheres. These results may support the use of 5-PT as a general and unspecific test of cognitive dysfunction. This lack of specificity for a brain region or functional system may be useful for its use as a screening tool as has been previously suggested (Hansen et al., Reference Hansen, Muenssinger, Kronhofmann, Lautenbacher, Oschmann and Keune2017). In addition, due to the minimal language load of the task, it may be useful in the assessment of patients with aphasia (i.e., primary progressive aphasia), as well as for neurodegenerative diseases with a remarkable impairment of the right hemisphere. However, the test did not show statistically significant differences between AD and bvFTD with none of the scores, and thus, it would not be appropriate for differential diagnosis between these entities.
It is worth noting the changes in the metabolic correlates as the 5-PT execution progresses. Specifically, we found a correlation with bilateral frontal regions at the beginning of the design fluency task, especially in dorsolateral regions associated with executive functions (Matias-Guiu et al., Reference Matias-Guiu, Cabrera-Martín, Valles-Salgado, Rognoni, Galán, Moreno-Ramos and Matias-Guiu2019). As tasks advances, we found more implication of temporal areas, particularly in the right hemisphere, which has been related to visual memory and visual working memory along other regions, such as the occipital and parietal cortex (Schurgin, Reference Schurgin2018). Thus, the same task may involve different cognitive processes whose relevance could change as the task progresses. This supports the idea of nonspecific regions in the prefrontal cortex during generation tasks (Robinson et al., Reference Robinson, Shallice, Bozzali and Cipolotti2012) and suggests the interest of studying design fluency considering different time windows (Matias-Guiu et al., Reference Matias-Guiu, Pytel, Delgado-Álvarez, Delgado-Alonso, Cortés-Martínez, Fernández-Oliveira and Matias-Guiu2021).
In semantic fluency, we found a lateralisation of the left hemisphere including frontal and temporal regions, which have been associated with verbal fluency and lexico-semantic storage (Henry, Crawford, & Phillips, Reference Henry, Crawford and Phillips2004). The activation of the hippocampus has also been reported in previous studies, especially in semantic fluency (Glikmann-Johnston et al., Reference Glikmann-Johnston, Oren, Hendler and Shapira-Lichter2015). The involvement of the hippocampus, the medial temporal lobe and the semantic network during semantic fluency is probably explained by the role of semantic memory in this task, which in our study was especially important in AD patients. Left inferior frontal gyrus has been associated with selection mechanisms and has been suggested as a key region during phonemic fluency, due to the high number of competitive responses (Robinson et al., Reference Robinson, Shallice, Bozzali and Cipolotti2012). However, we also found a significant correlation of this region during semantic fluency. In addition, specific regions related to phonemic fluency were not found, in contrast with previous studies (Robinson et al., Reference Robinson, Shallice, Bozzali and Cipolotti2012). This finding suggests that phonemic fluency is less correlated with specific brain regions than semantic fluency, and thus, it did not reach a statistically significant result in our sample.
Another interesting contribution of our study is the differential neural correlates associated with verbal and design fluency between AD and bvFTD. Semantic fluency was associated with the brain metabolism in the left hemisphere. However, in AD it was associated mainly with the left temporal lobe, and also some clusters of the left inferior frontal gyrus and right temporal lobes. In contrast, in bvFTD semantic fluency was correlated with the left frontal lobe, and left thalamus and caudate. These results confirm the verbal specialisation of the left hemisphere, but show different neural correlates and potential distinct mechanisms associated with semantic fluency performance in both entities. Regarding design fluency, it was associated with both hemispheres in both AD and bvFTD, although with some right predominance. In AD, widespread correlates were detected in the parietal, temporal, and frontal lobe, suggesting that multiple mechanisms could participate in the 5PT performance. However, middle temporal regions showed the peak of significance, confirming the relevance of limbic and memory networks. In addition, other regions including the frontoparietal cortex have been involved in attention and executive processes, task switching, short-term storage, and working memory (Laisney et al., Reference Laisney, Matuszewski, Mézenge, Belliard, de la Sayette, Eustache and Desgrandes2009). In the case of bvFTD, bilateral frontal lobes were mainly correlated with the PUD, with a certain predominance of the right side. These findings emphasise a predominant role of several processes more linked to the frontal lobe (i.e., shifting, inhibitory failure, etc.) in the design fluency execution in bvFTD. While design fluency involves more distributed brain regions in AD, in bvFTD it seems to be more restricted to the frontal lobes. Overall, the metabolic findings confirm dissociated underlying cognitive processes associated with each task in AD and bvFTD, as we suggested above considering the clinical findings.
Repetitions in the bvFTD group were correlated with the left frontal lobe, specifically with left superior, middle, and inferior frontal gyri, and the superior and medial frontal gyri. The predominant role of the left prefrontal cortex over the right has been emphasised in attentional control (Knight, Smith, & Ellison, Reference Knight, Smith and Ellison2020). Notably, the right prefrontal cortex has been more linked to inhibiting responses, while the left prefrontal cortex to the ability to monitor and behavioural correction (Garavan, Ross, Murphy, Roche, & Stein, Reference Garavan, Ross, Murphy, Roche and Stein2002). Although several mechanisms may participate in repetition errors, our results suggest a predominant role of the left prefrontal cortex in bvFTD. Conversely, repetitions in AD were correlated with bilateral regions in the temporal, parietal, and frontal lobe, suggesting probably the involving of multiple processes in their generation.
From the perspective of executive networks, the brain regions involved in our analysis of the metabolic correlates provide indirect information about the participation of each executive network in fluency (Figure 7). As expected, executive networks played a greater role in design fluency than semantic fluency. The involvement seemed to be greater bvFTD than AD when analysing the percentage of overlap considering the volume of the neural regions correlated with each task, suggesting that other non-executive networks are more relevant in AD than in bvFTD. Interestingly, the four main executive networks overlapped with PUD in both bvFTD and AD. However, in repetitions, the role of left central executive and anterior control networks was greater than the other networks, especially in bvFTD. This is consistent with the role of these networks with sustained attention, rule-based problem-solving and working memory, and their activation in cognitively demanding tasks (Menon, Reference Menon2011). According to the previous analysis about each task’s cognitive and brain metabolic correlates, the overlap with executive networks confirms the different degree of participation of executive functioning in each verbal fluency and each disorder. The regions and networks associated in our study with fluency tasks are prominently involved in the neuropathology of AD and bvFTD during the early stages and as the diseases progress. Specifically, AD usually starts in the entorhinal cortex and hippocampus, and many of the regions found in our study are impaired early (i.e., middle temporal gyrus, parahippocampal gyrus, fusiform gyrus, and precuneus). Regarding bvFTD, localisation of brain damage also coincides with several regions associated with fluency tasks, especially in the frontal lobe (Whitwell & Jack, Reference Whitwell and Jack2005; Menon, Reference Menon2011). Overall, this suggests that fluency tasks may be valuable tests to include in the neuropsychological protocols for diagnosis and monitoring of both entities.
Our study has some limitations. First, the cross-sectional design does not allow the assessment of changes in fluency tasks along the course of bvFTD and AD. Second, we did not examine motor skills and dexterity (e.g., Purdue Pegboard) that could explain part of the performance in the design fluency. However, none of our patients showed parkinsonism or other motor disorder at the time of inclusion. Third, for the analyses of correlations with fluency tasks, we focused on the scores. Future studies with larger samples may examine the clinical behaviour and neural correlates of some qualitative features (e.g., the strategies used during design fluency), which may also be of interest. Fourth, in the brain mapping analysis of the whole sample, the AD group was larger, which could increase the probability of finding significant results in regions more linked to AD. However, we tried to limit the effect by introducing the diagnosis as one of the covariates in the statistical analysis. Fifth, we did not introduce some covariates of potential interest in the multiple regression analysis of FDG-PET imaging (e.g., MMSE, or other cognitive tests) because of collinearity. In addition, the impact of MMSE in the staging of bvFTD and AD is different, which could bias the results (Borroni et al., Reference Borroni, Agosti, Premi, Cerini, Cosseddu, Paghera and Padovani2010). Interpretation in neuropsychology is based on the search of dissociations between tests, which may share some cognitive processes but not others. Conversely, our study has focused on the analysis of neuroimaging correlates of specific fluency tests, but without controlling for other tests (e.g., language or visuospatial function tests). Studies evaluating multiple cognitive tests at the same time, probably using data-driven approaches, are necessary to overcome this limitation (Zukotynski et al., Reference Zukotynksi, Gaudet, Kuo, Adamo, Goubran, Scott and Black2020).
In conclusion, our findings demonstrate differential underlying cognitive processes in verbal and design fluency in AD and bvFTD, with also distinct neural correlates. Gathering clinical and neuroimaging data of different neurodegenerative disorders may yield interesting insights about the neuropsychological processes involved in cognitive deficits, which could improve the clinical diagnosis and interpretation in the clinical practice.
SUPPLEMENTARY MATERIAL
To view supplementary material for this article, please visit https://doi.org/10.1017/S1355617721001144
FINANCIAL SUPPORT
Jordi A Matias-Guiu is supported by Instituto de Salud Carlos III through the project INT20/00079 (co-funded by European Regional Development Fund “A way to make Europe”).
CONFLICT OF INTEREST
The authors report no disclosures.


