


In this world, which is getting more and more closely interconnected, we have to learn to tolerate each other.
Bertrand Russell, interviewed on BBC's Face to Face, 19591. Introduction
Immigration to and within Europe is nothing new, but the public debate has intensified in recent years as immigration flows have increased (UNHCR, 2019). Much of the public debate – such as that between Chancellor Angela Merkel and her challenger Martin Schulz in the 2017 German election campaign (El-Menouar, Reference El-Menouar2017) – concerns a lack of integration, which is thought to bring with it a number of social, economic and political challenges. Some of these challenges are connected to formal institutions – e.g. high minimum-wage laws and strict employment protection regulation (Kahn, Reference Kahn2007; Skedinger, Reference Skedinger2010) and excluding immigrants from voting (Slotwinski et al., Reference Slotwinski, Stutzer and Gorinas2017) or citizenship (Weldon, Reference Weldon2006) – while others are related to informal institutions or culture more broadly (Blau et al., Reference Blau, Kahn and Papps2011; Koopmans, Reference Koopmans2016; Lundborg, Reference Lundborg2013). For example, Bisin et al. (Reference Bisin, Patacchini, Verdier and Zenou2011: 57) write that “when they have a strong identity, second-generation immigrants have a lower chance of finding a job than natives.” Hence, one central aspect of integration is a closer alignment of the norms and values of immigrants to those of the native population. If this can be achieved, it seems plausible to expect social harmony to be higher and the potential for integration to be greater.Footnote 1
Facilitating integration is not the only reason to strive for tolerance. Locke (Reference Locke1689) and Mill (Reference Mill1859) argued for its ability to generate peace, harmony and individual freedom; and modern research indicates that tolerance brings both subjective well-being, by allowing people, especially minorities such as gay people, to lead the lives they want without social and legal disapprobation (Corneo and Jeanne, Reference Corneo and Jeanne2009; Inglehart et al., Reference Inglehart, Borinskaya, Cotter, Harro, Inglehart, Ponarin and Welzel2014), and economic development, by entailing low entry barriers for innovative people.Footnote 2
Against this background, we ask what explains how tolerant second-generation immigrants in Europe are. Our main analysis focuses on tolerance towards gay people, an important indicator of liberal values typical of most European countries.Footnote 3 We provide the most comprehensive empirical investigation to date of the predictors of this kind of tolerance, examining several classes of possible explanatory variables – most notably, the following features of the countries from which the parents of the second-generation immigrants migrated: political institutions, economic institutions, legal institutions, fractionalization, economic factors, and informal institutions (religion and culture). The idea is that these characteristics of the ancestral countries shape the values and norms of the parents, who grew up in those countries and transmit them to their children. Hence, we relate the tolerance of children of immigrants in 31 European countries, all of them born and residing there, to features of the 150 countries from which their parents stem.Footnote 4 One advantage of this method is that it allows us to rule out reverse causality, since the individual-level tolerance of children growing up in a new country cannot influence basic features of the parents’ home countries.
Our findings suggest that tolerance towards gay people among second-generation immigrants in Europe is related to one variable in a very robust way: the share of Muslims in the parents’ home country. The higher the share, the lower the tolerance among today's second-generation immigrants. An instrumental-variable analysis suggests that the causal mechanism is the individual degree of religiosity rather than the individual being a Muslim. In addition, we find that three other features of the ancestral countries are positively related to our tolerance measure in most model specifications – two values considered important for children to learn (tolerance and respect, and a feeling of responsibility), and impartiality, a measure of institutional quality. Finally, we look at another dependent variable, attitudes towards the role of women, and find that the share wanting children to learn tolerance and respect and the Muslim share are significant predictors (positively and negatively) here as well, supporting an interpretation that these background factors are indicative of a liberal or an illiberal value orientation.
2. Theoretical framework, previous literature and our contribution
Theoretical framework
We are interested in what determines the values of the second-generation immigrants. Tolerance can be conceived as an informal institution in the sense of North (Reference North1990), i.e. as a non-codified rule or norm that puts restrictions on attitudes towards and treatment of others, and as an internal institution in the sense of Voigt (Reference Voigt2013) to the extent that manifestations of intolerance are sanctioned by members of society through social (rather than legal) mechanisms. It is in this sense akin to the role of the generality principle of Buchanan and Congleton (Reference Buchanan and Congleton1998) in the context of formal institutions, which puts restrictions on what kind of political decisions are permissible.
Our theoretical framework links characteristics of the ancestral country, in which the first-generation immigrants were born and raised, to characteristics of their children. As Figure 1 shows, the values a second-generation immigrant holds are affected by individual characteristics, country-of-birth characteristics and parental values. The parental values, in turn, are influenced by the ancestral country characteristics, which are grouped into six categories, as explained and motivated in online appendix 1.Footnote 5 This schematic understanding of the formation of values builds on Bisin and Verdier (Reference Bisin and Verdier2000, Reference Bisin and Verdier2001, Reference Bisin, Verdier, Benhabib, Bisin and Jackson2011), who model two transmission channels for values: horizontal transmission (from the surrounding society) and vertical transmission (from the parents).Footnote 6 In our empirical analysis, we do not use parental values directly but rather the characteristics of the ancestral country, as indicated by the dashed line, for two reasons: there are no data on parental values and if one were to use them, it would introduce a risk for reverse causality.
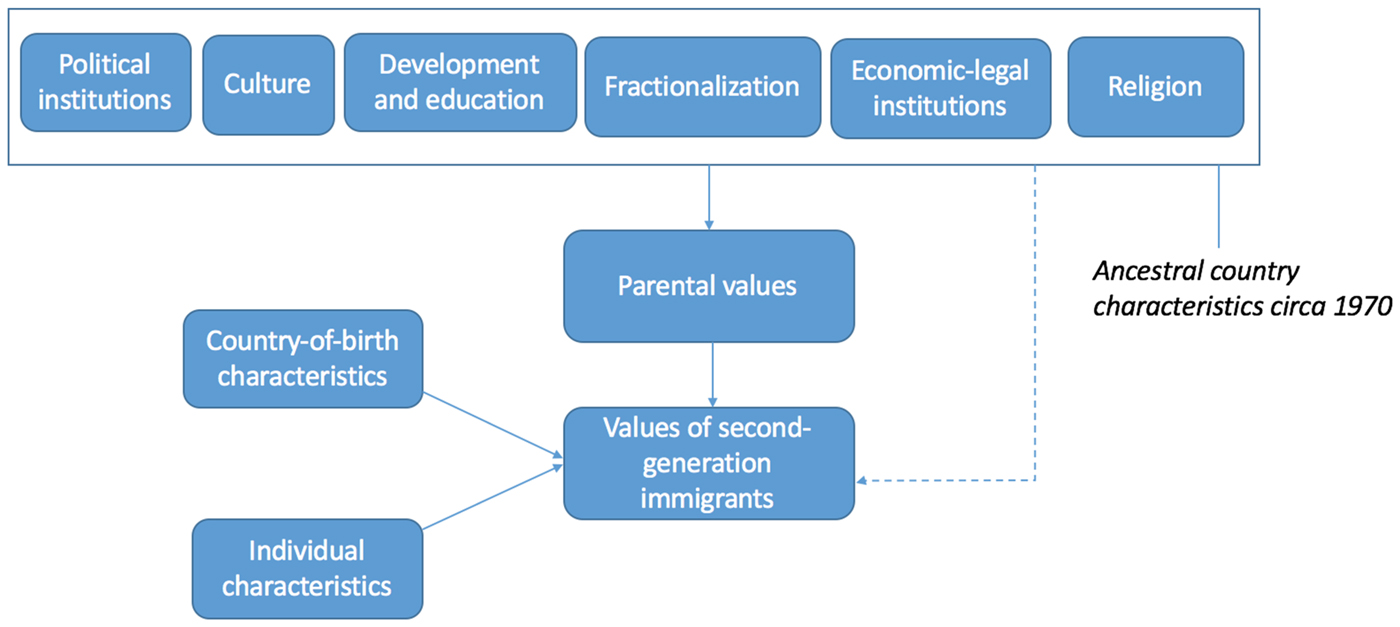
Figure 1. The determinants of tolerance
Our theoretical approach does not point out a particular (set of) explanatory variables as important a priori, but allows for a wide range of factors (guided by a wider set of theories) to potentially affect tolerance.
Previous literature and our contribution
Research on what explains tolerance is limited, especially from a cross-country perspective. Corneo and Jeanne (Reference Corneo and Jeanne2009) examine whether people consider homosexuality justifiable and find that they are more likely to do so if GDP per capita is higher and if the country of residence has become an EU member; likewise, looking at individual variables, being female, having a higher income, being unmarried and being a student or a part-time worker are all related to more tolerance. Andersen and Fetner (Reference Andersen and Fetner2008) provide evidence that tolerance is negatively related to income inequality but also that people become more tolerant with higher incomes. In a series of studies, Berggren and Nilsson (Reference Berggren and Nilsson2013, Reference Berggren and Nilsson2014, Reference Berggren and Nilsson2015, Reference Berggren and Nilsson2016) look at tolerance as a function of economic-legal institutions, as measured by economic freedom indices and the KOF index of globalization. Among other things, they show that a high-quality legal system and monetary stability are positively associated with tolerance both towards people of a different race and towards gays and lesbians; that social trust enhances this effect of institutions; that more general taxation across US states is conducive to tolerance towards atheists, communists, and gay people; and that social and economic globalization seems to induce parents to want to teach their children tolerance.
Doebler (Reference Doebler2015) focuses on various aspects of religion across Europe and generally finds that individual-level indicators (e.g. being a member of a religious denomination and attending religious services) predict a moral rejection of homosexuality and intolerance against gays and lesbians. Belief in a personal God is related to the former but not very much to the latter measure of “homonegativity.” In addition, looking at country-level measures, religiosity, corruption, income inequality and non-equal rights are found to make moral rejection and intolerance more likely. Jäckle and Wenzelburger (Reference Jäckle and Wenzelburger2015) similarly use multilevel analysis for the relationship between religion and attitudes towards homosexuality across 79 countries and find differences in how negative people are towards gays and lesbians depending on which religion they belong to. Fielding (Reference Fielding2018) documents a historic influence from migration patterns in the Middle Ages in the UK on attitudes towards immigrants today. Towns that historically welcomed Jews have more tolerant inhabitants today, indicating intergenerational transmission of attitudes and persistence over time, as well as one type of tolerance (towards Jews) encompassing another (towards all kinds of modern-day immigrants). Aldashev et al. (Reference Aldashev, Chaara, Platteau and Wahhaj2012) show that legal reforms can influence social norms, not least in the area of family life, suggesting that cultural variables can be shaped by formal institutions. Lastly, Fernández et al. (Reference Fernández, Parsa and Viarengo2019) find evidence that political rhetoric, policy decisions and the prevalence of AIDS encouraged more favorable attitudes towards gay people in the United States. It demonstrates the malleability of values and attitudes like tolerance.
Compared to the existing studies of tolerance we add valuable insights in at least four ways:
(1) We rule out reverse causality and provide causal evidence for what shapes tolerance. As noted in our theoretical discussion (in online appendix 1), several variables that we (and previous studies) examine can both determine and be determined by tolerance, stressing the need to rule out reverse causality when testing the relationship empirically.
(2) We examine the richest set of potential explanatory variables in the literature so far, with a particular focus on formal and informal institutions.
(3) We use three model-specification approaches to examine the question (one thematic approach and two mechanical variable selection methods), along with a number of robustness checks and extensions, as well as an instrumental-variable analysis to gain further understanding of relevant mechanisms.
(4) We focus on immigrants and the link to integration, arguably providing a further benefit of immigrants being tolerant.
3. Data and empirical method
Data
Our main outcome variable is tolerance, measured with a question from the second to sixth rounds of the European Social Survey (ESS), spanning the period 2004–2012, asking to what degree respondents agree with the statement that “gay men and lesbians should be free to live their own life as they wish.” Possible answers range from “Disagree strongly,” coded as 1, to “Agree strongly,” coded as 5, with intermediate categories “Disagree” (2), “Neither agree nor disagree” (3) and “Agree” (4). There are indications that this measure is a useful indicator of tolerance more generally, but we do not want to overemphasize generalizability.Footnote 7 Even so, we consider it worthwhile to identify factors that shape tolerance towards gay people, as we consider that an important outcome variable in its own right.Footnote 8
In a complementary analysis, we replace the tolerance measure by another indicator of liberal values, the degree to which one agrees, on a five-point scale, with the statement “Women should be prepared to cut down on paid work for sake of family,” with a higher number indicating stronger disagreement (and a stronger liberal value orientation).
The ESS has representative samples for each country and round, and it features information about the country of birth of each respondent as well as of both parents. This enables us to look at second-generation immigrants and to identify which country the parents migrated from. The data span 31 European countries in which the second-generation immigrants were born and reside, which makes it likely that our findings are not the result of the particular conditions of some idiosyncratic country. The following countries of birth and residence for our second-generation immigrants are included: Austria, Belgium, Bulgaria, Croatia, Cyprus, Czech Republic, Denmark, Estonia, Finland, France, Germany, Greece, Hungary, Ireland, Israel, Italy, Lithuania, Luxembourg, Netherlands, Norway, Poland, Portugal, Russian Federation, Slovakia, Slovenia, Spain, Sweden, Switzerland, Turkey, Ukraine and United Kingdom. We are able to observe the tolerance of individuals whose parents come from about 150 countries from all over the world.Footnote 9 The fact that the second-generation immigrants stem from different background countries facilitates generalizations on the basis of our findings.Footnote 10
As for explanatory factors, we sort 46 characteristics of the ancestral countries thematically into six groups: political institutions, culture, development and education, fractionalization, economic-legal institutions, and religion. In addition, we include exogenous individual-level controls for age and gender throughout the analysis and, in a sensitivity analysis, further individual control variables: education, income, marital status, employment status, subjective health, and happiness. All these explanatory variables are defined and motivated, theoretically and empirically, in online appendix 1, where we also present regression tables and data sources. The summary statistics are in Table A11 in online appendix 2.
Empirical method
We apply the epidemiological method (Fernández, Reference Fernández, Benhabib, Bisin and Jackson2011) to infer how ancestral country characteristics influence tolerance among second-generation immigrants, using ordinary least squares (OLS) to estimate regressions of this kind:

Toleranceicat is the measure of the tolerance level of second-generation immigrant i, born and residing in country c with a parent born in country a, where a≠c, in period t. The vector X a contains the 46 characteristics of country that may affect the tolerance of individuals whose parents stem from it. Z icat captures individual controls, γct is the country-of-residence-by-year fixed effects, while εicat is the error term.Footnote 11 Standard errors are clustered by the parent's birth country to allow for arbitrary correlations of the error terms among second-generation immigrants from the same ancestral country.Footnote 12 Importantly, we can rule out reverse causality by using this method, since the tolerance of an individual born and residing in country c cannot affect country-level features in the parents’ birth country a, for spatial and temporal reasons.
The analysis is undertaken in two main ways: through systematic tests of the 46 variables grouped thematically and through mechanical tests. The first part consists of three steps: (1) each ancestral variable is regressed on tolerance one at a time; (2) then the variables are combined by category into cumulative models; (3) the variables that are statistically significant at the 5% level or lower in the preceding analysis are put in a regression together. The second part examines the roots of tolerance using mechanical variable selection techniques, in the form of Extreme Bounds Analysis (EBA) and LASSO (Least Absolute Shrinkage and Selection Operator) (a machine learning method), which results in regressions with the most important variables for explaining our measure of tolerance. For both parts of the analysis, we then evaluate how the identified variables fare against each other in “horse races”; and we perform further robustness checks.
A main advantage of our empirical approach is that we impose few assumptions a priori on what matters: that is, we allow a wide set of factors to influence tolerance. Our priority is to avoid “bad assumptions” about what influences tolerance, which risk being part of more narrow analyses that focus on a particular relationship. Given the state of the literature, which has far from settled how tolerance is shaped, we believe it to be a fruitful approach.
4. Main empirical results
We present our main empirical results in two subsections. The first reports systematic tests of how the 46 ancestral-country characteristics, grouped thematically as indicated in Figure 1, predict tolerance. It ends with a “horse-race” test with those variables from the thematic tests that showed a robust relationship to tolerance (having attained a 5% significance level both when entered individually and when entered with the other variables of the group). Exogenous individual-level control variables and country-by-year fixed effects are always included. The second presents two mechanical model-specification tests, EBA and LASSO, of which of the 46 variables that predict tolerance. While the preceding tests depend on our choice of how to group the variables thematically, the mechanical tests show what happens when they are grouped according to other principles.
Tolerance regressions: six groups of explanatory variables and a “horse race”
First, we study how political institutions in the parents’ country of birth relate to the tolerance of second-generation immigrants (see Table A1 in online appendix 1). All variables (democracy, communist regime, political stability, constraints on the executive, impartiality, and professionalism) except communist regime are statistically significant at the 1% or 5% level when added individually, with positive signs in line with our theoretical predictions. When including all variables at once, only democracy is statistically significant, but the p-value is 0.055. None of these variables therefore go through to the “horse race.”
Second, we look at culture. We begin by presenting estimates for Hofstede's five cultural dimensions (individualism, masculinity, pragmatism, power distance, and uncertainty avoidance) – see Table A2 in online appendix 1. Two of them attain statistical significance when added individually, and three of them do when included simultaneously: individualism (positive sign), masculinity (negative sign), and pragmatism (positive sign), where the signs are the expected ones. Pragmatism is the only factor that is strongly significant both on its own and in the cumulative model. A second set of cultural background factors are presented in Table A3 in online appendix 1 and capture what values people think are important to teach children (independence, hard work, feeling of responsibility, imagination, tolerance and respect, thrift, determination and perseverance, religious faith, unselfishness, and obedience). While estimates for five of them are statistically significant when included one at a time, only two are still significant when they are all included: tolerance and respect (positive sign) and religious faith (negative sign).
Third, we examine development and education. Each of the six variables – GDP per capita, life expectancy, years of schooling, IQ, non-religious share, and female labor force participation rate – are positive and statistically significant when added one by one (see Table A4 in online appendix 1). But in the cumulative model, only IQ and the female labor force participation rate remain significant.
Fourth, we look at fractionalization. All four indicators – income inequality, ethnic fractionalization, religious fractionalization, and genetic diversity – are significantly related to tolerance, and all of them in a negative way (see Table A5 in online appendix 1). They have the same sign and similar significance, both individually and in the cumulative model.
Fifth, we focus on economic-legal institutions. The first indicators are the five areas of the Economic Freedom of the World index (size of government, quality of the legal system/protection of property rights, access to sound money, freedom to trade, and regulation). It is clear that one area of economic freedom seems strongly related to tolerance: the quality of the legal system, with a positive sign (see Table A6 in online appendix 1). As argued in Berggren and Nilsson (Reference Berggren and Nilsson2013, Reference Berggren and Nilsson2014), a higher-quality legal system can generate tolerance by ensuring that interactions between people are protected under the rule of law, which reduces the risk of opportunistic and exploitative behavior, which in turn enables people to trust and tolerate each other. We also examine the KOF index of globalization (Table A7 in online appendix 1). Even though indicators of both economic and social globalization are positive and significant when included separately, when put together, none of the globalization variables significantly predict tolerance, hence not providing support for the theoretical prediction in this domain.
Sixth, we come to religion. We include the religious adherence shares of Christianity, Judaism, Islam, Hinduism, and Buddhism (Table A8 in online appendix 1). The robust finding is a significant negative relation between the share of Muslims and tolerance. While the share of Christians in the ancestral country is positively related to tolerance when entered on its own, the estimate changes to negative and significant in the cumulative model, indicating a non-robust relationship. The Jewish fraction is significant and positive on its own, but it becomes insignificant in the cumulative model. The Hindu fraction is insignificant and negative on its own and becomes significantly negative in the cumulative model.
Last, we come to a cumulative model with the strongest predictors, from the six thematic analyses presented above, or a “horse race.” The analysis thus far has uncovered a number of significant predictors of tolerance across a spectrum of possible influences. To examine which of these are the most important we put the variables that are significant at the 5% level or lower (both when included individually and in the combined models) into a cumulative model to see which emerge as significant.Footnote 13 In a second specification GDP per capita in the ancestral country is added to account for the level of development. As can be seen in Table 1, only one of the strong candidates remains statistically significant at 5% or lower: the Muslim share.
Table 1. Cumulative model with the ten strongest explanatory variables

Notes: The dependent variable is attitudes to the statement “‘Gays and lesbians free to live life as they wish.” Both specifications study second-generation immigrants and estimate the effect of factors in the parents’ country of birth. Individual controls include age, age squared, and gender. Standard errors in parenthesis, which allow for clustering on the parents’ birth country.
*p < 0.1, **p < 0.05, ***p < 0.01.
Mechanical model-specification tests
The specification with the strongest predictors in Table 1 is based on a grouping of variables guided by a theoretical understanding of what predicts tolerance, along with a selection rule based on variable significance. Since the grouping of variables means that the number of control variables in each table is limited in a particular way, our results might derive from this manner of specifying the models – or there might be severe multicollinearity when similar variables are put into the same regressions (although collinearity tests indicate that this is not a problem). We therefore use alternative approaches to examine which the strongest predictors are.Footnote 14
We use three mechanical variable selection methods to assemble “horse races” corresponding to that of Table 1. First, we use EBAFootnote 15 to rank all variables by how often they are significant in predicting tolerance when all other variables are added in all possible combinations of up to three.Footnote 16 This unconditional EBA yields that the Muslim fraction in the ancestral country is significant at the 5% level or lower in 99.98% of all model combinations, which means that it ranks first among all the variables. A number of other variables are also very often significant, as indicated by the fact that the variable ranked tenth is significant in two-thirds of the regressions.
Second, we follow a similar approach, but rank variables based on an EBA conditional on the Muslim fraction. This approach selects the variables that are most frequently significant when the Muslim fraction is always included in the model, along with all combinations of up to three of the remaining variables. The results from this exercise show that the significance shares become lower for other variables (the tenth most frequently significant variable is significant at the 5% level or lower in about 17% of the regressions).
The third mechanical approach, a machine learning method, is fundamentally different. LASSO ranks variables based on how much they contribute to explaining the variation in the outcome variable. LASSO adds a penalty for including variables to the standard OLS objective of minimizing the squared deviations. The LASSO penalty is the sum of the absolute values of the estimated coefficients (betas), and the weight of the penalty is given by the parameter lambda.Footnote 17 The absolute values in the penalty induce the operator to set several coefficients to zero and hence shrink the model. By estimating LASSO for a range of lambdas we rank variables by the order they are selected (assigning a non-zero coefficient). The Muslim fraction in 1970 is the first variable selected by LASSO, indicating that it is the most important factor for explaining tolerance. Subsequent variables are selected based on their marginal contribution to explaining tolerance conditional on the already included variables.
For each of the three approaches, we take the top-ten-ranked variables and put them in an OLS regression (with individual controls and fixed effects). This gives us Table 2. All underlying results are available on request. As can be seen, the Muslim fraction is strongly significant in all three specifications based on mechanical variable selection. The results reinforce our finding that the Muslim fraction is the most important and robust ancestral country factor to explain tolerance.Footnote 18 Point estimates for the Muslim fraction are very similar in the conditional EBA- and LASSO-based models, while the point estimate is double the magnitude in the unconditional EBA. This appears to be due to issues of multicollinearity in the unconditional EBA, where the Muslim fraction has a VIF of 17 (and the Christian fraction has a VIF of 12).Footnote 19 There are no indications of multicollinearity in the conditional EBA or the LASSO models.
Table 2. Models based on mechanical specification
Notes: The dependent variable is attitudes to the statement “Gays and lesbians free to live life as they wish.” The first specification includes the ten most frequently significant variables according to an unconditional EBA. The second column includes the ten most frequently significant variables according to an EBA conditional on Muslim fraction being in the model. The third specification includes the ten first variables selected by LASSO. All specifications study second-generation immigrants and estimate the effect of factors in the parents’ country of birth. Individual controls include age, age squared, and gender. Standard errors in parenthesis, which allow for clustering on the parents’ birth country.
*p < 0.1, **p < 0.05, ***p < 0.01.
5. Extended empirical analysis
We conduct a number of further analyses to investigate the character and robustness of our results.
Sensitivity analysis regarding the Muslim share
We have seen that the Muslim share is uniquely strong in predicting (in)tolerance in all models.Footnote 20 We undertake four additional tests that demonstrate its robustness even further.
1. We include the Muslim fraction in all the cumulative models (in the rightmost columns) of all our thematic regression tables (Tables A1–A8 in online appendix 1) on political institutions, culture, etc. We find that the fraction of Muslims in the ancestral country remains negative and strongly statistically significant in all settings. Results are available on request.
2. The Muslim fraction estimate is not sensitive to the boundary values of the variable, such as comparing homogenous Muslim ancestries to those where no Muslims were present. Restricting the sample, based on the ancestral country Muslim share, from the top or the bottom, yields strongly significant estimates of similar magnitudes. Table A12 in online appendix 2 presents the estimates.
3. The Muslim fraction estimate is not the result of the parents emanating from a particular continent. When excluding ancestral countries from Africa, Asia, the Americas and Europe, respectively, the estimate does not change much and retains its statistical significance. The estimate is reduced and becomes insignificant when only European ancestral countries are included, but this is not surprising given the limited variation in Muslim shares there. Lastly, we add ancestral-continent fixed effects and again reassuringly find that the estimate retains both its size and statistical significance. For details, see Table A13 in online appendix 2.
4. We include five other measures of the influence of Islam in society: membership in the Organization of Islamic Cooperation (dummy), whether Islam is constitutionally entrenched (dummy), the Islamic State Index, the degree to which the constitution denotes the supremacy of Islam (SI-clause) and whether the constitution identifies Islam as a source of legislation (ISL-clause). The three first measures are from Gutmann and Voigt (Reference Gutmann and Voigt2015) and the latter two from Gouda and Gutmann (Reference Gouda and Gutmann2018).Footnote 21 These measures are all negatively related to tolerance when included on their own, but lose or continue not to display significance when the share of Muslims is included in the model, while the latter predictor always retains its strong significance. Results are presented in Table A14 in online appendix 2.
The sensitivity of the results to the inclusion of further individual control variables
In the analysis so far, we included age, age squared, and gender as individual controls, as these are exogenous to the individual's tolerance level. However, it could be that other individual factors play a role in explaining tolerance and that omitting them biases the results. Even though these other individual control variables risk being endogenous, we included more of them to the specifications of Table 1 and report the findings in Table A15 in online appendix 2. Notably, the Muslim share remains strongly statistically significant throughout this exercise. Among the newly added individual control variables, these are significantly and positively related to tolerance: female, tertiary education, health, and happiness. Four are significantly and negatively related to tolerance: age, being out of the labor force, being a low-income earner, and being married. Also when controlling for these individual characteristics, the Muslim share still plays a large explanatory role (even though the size of the point estimate is somewhat reduced).
The role of selection
Although we study second-generation immigrants who are born and reside in the destination country of their parents, selection of migrants could still be a concern. Uniform selection, if all migrants are a little more (or less) tolerant than the ancestral country average, is not a concern, since the variation used to identify estimates is in the form of differences across ancestries. The concern is if selection is differential in a way that mimics the estimated relationship between tolerance and the ancestral characteristic. In the case of Muslim share we would be concerned if migrants from Muslim countries were less tolerant than non-migrants in their ancestral country and if migrants from non-Muslim countries were more tolerant than the non-migrants. To address this concern, we study first-generation migrants and compare their tolerance to non-migrants in their ancestral country. The tolerance difference between migrants and non-migrants is plotted against the ancestral country Muslim share in Figure 2.Footnote 22 It would be troubling if the relationship were negative, since that is what we get in the analysis above, but reassuringly, the relationship in the graph is positive. This indicates that our estimates of the Muslim share could be biased towards zero – the relationship in the graph works against finding a negative relationship between tolerance and Muslim share. Thus, there is no evidence of migrant selection driving our very robust estimate.

Figure 2. Tolerance differences between migrants and non-migrants across ancestral country Muslim share
Attitudes towards women as the dependent variable
The analysis so far has used tolerance towards gay people as the dependent variable, interpreted by us as an indicator of a liberal value orientation. We here examine another aspect of a liberal value orientation, the attitude towards the statement “Women should be prepared to cut down on paid work for sake of family,” with a higher number indicating stronger disagreement. The results, using the model specifications of Table 1, are reported in Table A16 in online appendix 2. Reassuringly, the share wanting children to learn tolerance and respect is positively, and the Muslim share negatively, related to supporting working women. The results show that the strong factors identified in our analysis predict two dimensions of a liberal value orientation: tolerance towards gay people and a positive view of women's role in labor market.
Summary of the results of the extended analysis
The Muslim share is a very robust predictor as it is strongly significant, both statistically and economically, in all the models. What other predictors are important? If we look at the findings of Tables 1 and 2, no other variable is significant in all these “horse races.” This means that their robustness is less clear than for the Muslim share. Still, it is relevant to consider some of the variables. As a starting point, these are the variables that obtain a significance level of 5% or lower in any of the models: democracy, power distance, impartiality, and three attitudes that are valued in children: tolerance and respect, a feeling of responsibility, and unselfishness. In our view, some of these are more credible as predictors of tolerance than the others. If we add the two criteria that a variable should be significantly related to tolerance (at the 5% level or lower) when included on its own in the baseline models (Tables A1–A8 in online appendix 1) and have the same sign throughout all empirical exercises, three variables remain: two values considered important for children – tolerance and respect and a feeling of responsibility – as well as impartiality as an institutional quality. These results point to an important role for both values and institutions in shaping tolerance, in addition to the share of Muslims.
6. Instrumental-variable analysis
What mechanism may explain the very robust finding that the Muslim share in the ancestral countries predicts intolerance? To gain further insight into this issue, and inspired by Acemoglu and Robinson (Reference Acemoglu and Robinson2005), we conduct an instrumental-variable analysis of the Muslim share using 2SLS. Our first idea is that the negative tolerance effect works through the individual second-generation immigrant being a Muslim her- or himself. Indeed, when using the Muslim fraction in the ancestral country as an instrument, the first stage reveals a strong positive relationship between being a Muslim and stemming from a country with a large Muslim fraction, and the second stage indicates that Muslims express lower tolerance. See column 1 of Table 3. But a second round of tests indicates that there is more to the story.
Table 3. Instrumental-variable analysis

Notes: The dependent variable is attitudes to the statement “Gays and lesbians free to live life as they wish.” All specifications study second-generation immigrants, using up to three factors in the parents’ country of birth as instruments for two individual characteristics (being a Muslim and the degree to which they consider themselves to be religious). Exogenous individual controls include age, age squared, and gender; extended individual controls include marital and labor market status, education and income. Standard errors in parenthesis, which allow for clustering on the parents’ birth country.
***p < 0.01.
Our next idea is that the effect might work through the individual second-generation immigrant being religious, making a distinction between Muslims of varying religiosity and noting that non-Muslims can also be religious (even though Muslims express a higher degree of religiosity on average compared to Catholics and Protestants). Column 2 shows that the Muslim fraction in the ancestral country also strongly predicts the individual's degree of religiosity, and that higher religiosity decreases tolerance. We estimate a model with both variables, being a Muslim and the religious degree, in column 3. In this model with two individual channels we need to add one instrument. We include the non-religious fraction in 1970 in the ancestral country, a plausible factor for predicting the individual's religiosity. Interestingly, the religious degree estimate is virtually identical to that of column 2, while the estimate on being a Muslim is close to zero. The results suggest that the mechanism for the very robust result of the Muslim share as a predictor of intolerance is the degree of individual religiosity of the second-generation immigrant rather than the particular type of religion (in line with Berggren and Bjørnskov, Reference Berggren and Bjørnskov2011, who show that religiosity, not membership of a particular religion, is related to lower social trust).
To examine if there is evidence against the exclusion restriction, we add a third instrument from the ancestral country: the share that thinks that religious faith is an important characteristic in children (another plausible instrument for individual religiosity).Footnote 23 In column 4, we report Hansen's J-statistic, which shows we cannot reject the null hypothesis that the over-identification restrictions are valid. Lastly, in column 5, we add GDP per capita to the model of column 3, which yields similar results. The estimates on the religious degree are similar, both in magnitude and significance, across specifications. We conclude that the influence of the ancestral country Muslim share works through individual religiosity, not as one might think at first through the individual being a Muslim as such.
7. Discussion and conclusions
Tolerance has many benefits, such as the respectful treatment of minorities, absence of conflict, innovativeness and subjective well-being. A society in which people assess and treat others on their merits rather than on their belonging to a certain group is a more cooperative, open and dynamic place. In a situation where Europe is continuing to receive a large number of immigrants, it becomes interesting to see what determines their degree of tolerance, since, in addition to other benefits, tolerance can arguably facilitate their integration into European societies. If one knows what the main determinants are, it becomes easier to try to stimulate the tolerance of those of foreign descent, should one wish to do so.
In this study, we identify factors that explain how tolerant second-generation immigrants are towards gay people, an indicator of liberal values widely held in many European countries today. The factors (46 in total) are features – not least formal- and informal-institutional ones – of the countries in which the parents of these second-generation immigrants were born and grew up, before migrating. By using this type of explanatory variables, we avoid the problem of reverse causality.
Our empirical analysis reveals that one factor stands out: the share of Muslims in 1970 in the parents’ country of origin. The higher the share, the lower the tolerance towards gay people. This finding is very robust, as it survives all robustness checks, including mechanical model-specification tests in the form of EBA and LASSO. Regarding other background characteristics, results are more mixed, but we wish to highlight three additional variables that are relatively robustly related to tolerance: valuing tolerance and respect in children, valuing a feeling of responsibility in children and impartial institutions. We have also exchanged tolerance against gay people for another outcome variable indicative of a liberal value orientation, namely, positive attitudes towards women working, and we find that the Muslim share and the share who think that children should learn tolerance and respect are (negative and positive) predictors of this attitude as well. Hence, both formal and informal institutions contribute to shaping the social attitudes of Europe's second-generation immigrants.
When considering how our findings may be useful for policymaking, a first thing to note is that tolerance among second-generation immigrants in Europe seems to be affected by influences from far away and from the past. Conditions in the parents’ home countries exercise an influence. This suggests that integration is a long-term process and not always an easy one to shape by political means, especially not when cultural characteristics, such as tolerance, are involved.Footnote 24
Still, there are implications for both migration and integration policies. To the extent that tolerance is valued, there may be a rivalry between promoting tolerance and accepting migration from countries that had large shares of Muslims, as well as from countries that lack impartial institutions and do not value tolerance or a feeling of responsibility in children.
Notably, our IV analysis reveals that the mechanism at work, linking ancestry from a country with a high Muslim share to intolerance, is individual religiosity. The finding indicates that being a Muslim is not the key avenue through which the influence works – indeed, Muslims can be more or less religious, and non-Muslims can be highly religious as well. This result should mitigate fears that Muslims necessarily introduce less tolerance in European societies and rather points at the central role of devoutness. A process of secularization can reduce the strength of the link between originating from a Muslim-dominated country and intolerance.
Lastly, it bears noting that we have not, due to a wish to focus on proximate, policy-relevant cultural and institutional causes, included an analysis of the “deep” roots of tolerance, locating the ultimate determinants of this type of social attitude in factors such as prehistorical events, climate, geography and biogeography. We do, however, consider such a topic suitable for future research.
Author ORCIDs
Niclas Berggren, 0000-0003-0673-5123; Martin Ljunge, 0000-0001-7628-620X.
Acknowledgements
We wish to thank Daniel Bennett, Andreas Bergh, Christian Bjørnskov, Carl Magnus Bjuggren, Michael Clemens, Jan Fidrmuc, Rosemarie Fike, Erich Grundlach, Jerg Gutmann, Hans Pitlik, Niklas Potrafke, Martin Rode, Samuel Škoda, participants at the 2016 conference of the Southern Economic Association in Washington, DC, at the 2017 workshop “How important is culture in shaping behavior?” at Radboud University Nijmegen, at the 2017 Danish Public Choice Workshop at Aarhus University, at the 2017 conference of the Public Choice Society in New Orleans, at the 2017 conference of the European Public Choice Society in Budapest, and at the 2017 conference “EU 2.0: Challenges of Globalization” at Mendel University in Brno, at a 2017 seminar at Linnæus University in Växjö, at the 2018 Young Economists’ Meeting at Masaryk University in Brno and at a 2018 seminar at Hamburg University for valuable comments and Jan-Egbert Sturm for Stata assistance. We are grateful to the Swedish Research Council (grant 2103-734), the Czech Science Foundation (GA ČR) (grant 19-03102S), Johan & Jakob Söderbergs Stiftelse (grant 47/19), the Riksbanken Tercentenary Fund (grant P17-0206:1) and Jan Wallanders and Tom Hedelius stiftelse and Tore Browaldhs stiftelse (grants P2017-0075:1 and P19-0180) for financial support.


