INTRODUCTION
Reconstruction of Holocene sea-level rise (SLR) has been accomplished worldwide through geologic study and radiometric dating of leading-edge transgressive wetland deposits cored from a wide latitudinal and biological range of peat-forming estuarine, coastal, and open marine environments, tidal regimes, and sediment inputs. Accurate paleo sea-level reconstructions provide an essential linkage to modern tide gauge measurements (e.g., Gornitz, Reference Gornitz1995; Donnelly et al., Reference Donnelly, Cleary, Newby and Ettinger2004; Gehrels and Woodworth, Reference Gehrels and Woodworth2013). In the absence of, or correction for, tectonic overprints, paleo sea-level reconstructions have the potential to reveal rates of SLR with which peat-forming systems have kept pace in the recent geologic past as predictors of the sustainability of such systems into the next 50–100 yr under accelerating rates (Woodroffe, Reference Woodroffe1990; Ellison and Stoddart, Reference Ellison and Stoddart1991; Ellison, Reference Ellison1993; Parkinson et al., Reference Parkinson, Delaune and White1994; Field, Reference Field1995; Stumpf and Haines, Reference Stumpf and Haines1998; NRC, 2005; Gehrels et al., Reference Gehrels, Kirby, Prokoph, Newnham, Achterberg, Evans, Black and Scott2005; Gilman et al., Reference Gilman, Van Lavieren, Ellison, Jungblut, Wilson, Areki and Brighouse2006; Church and White, Reference Church and White2006; Nicholls et al., 2007; Bindoff et al., Reference Bindoff, Willebrand, Artale, Cazenave, Gregory, Gulev and Hanawa2007; Krauss et al., Reference Krauss, McKee, Lovelock, Cahoon, Saintilan, Reef and Chen2013).
Peat-based sea-level reconstruction relies in large part on obtaining accurate peat paleo elevations at the time of formation, i.e., sea level within the paleo tide range (Allen, Reference Allen2000). Auto-compaction is a highly complex, ongoing, and long-term process that includes decay, compression, dewatering, and consolidation resulting in loss of void spaces and volume and reorientation of plant matter (Scholander et al., Reference Scholander, van Dam and Scholander1955; Kaye and Barghoorn, Reference Kaye and Barghoorn1964; Skelton and Allaway, Reference Skelton and Allaway1996; Allaway et al., Reference Allaway, Curran, Hollington, Ricketts and Skelton2001). It also increases bulk density as peat material is vertically displaced or pushed downward from its original depositional level through compression (Bird et al., Reference Bird, Fitfield, Chua and Goh2004). Studies have suggested that it occurs during peat deposition, continues through time, and decreases asymptotically with depth (Kaye and Barghoorn, Reference Kaye and Barghoorn1964; Pizzuto and Schwendt, Reference Pizzuto and Schwendt1997; Paul and Barras, Reference Paul and Barras1998; Shaw and Ceman, Reference Shaw and Ceman1999; Allen, Reference Allen2000; Bird et al., Reference Bird, Fitfield, Chua and Goh2004). These processes would effectively lower the elevation of samples used to establish paleo-sea-level index points. While the potential influence of compaction on Holocene sea-level records is well recognized, it is commonly not quantified or modeled over millennial timescales because of the complexity involved to quantify its influence, yet arbitrary compaction corrections have been applied (e.g., Khan et al., Reference Khan, Ashe, Shaw, Vacchi, Walker, Peltier, Kopp and Horton2015).
Compaction is assumed to affect all coastal peat types, from mainland salt marshes with meso- to macro-tidal ranges and significant siliciclastic sediment input (e.g., Williams, Reference Williams2003), to open ocean mangrove islands in carbonate settings associated with coral reefs with microtidal ranges (e.g., Macintyre et al., Reference Macintyre, Toscano, Lighty and Bond2004). The expectation of an ongoing process of compaction within Holocene peat deposits has governed/limited sea-level researchers’ choice of samples for analysis to the extent that only basal peats sampled directly on pre-compacted or solid basement substrates are considered un-compacted and at their original depositional elevations. Thus, they have been regarded as the only reliable sea-level index points (e.g., Shennan et al., Reference Shennan, Lambeck, Horton, Innes, Lloyd, McArthur and Rutherford2000; Törnqvist et al., Reference Törnqvist, Van Ree, Van’t Veer and Van Geel1998, Reference Törnqvist, Wallace, Storms, Wallinga, Dam, Blaauw, Derksen, Klerks, Meijneken and Snijders2008). The exclusive use of basal mangrove peats, particularly those resting on isolated buried carbonate banks, would severely limit the depth and age range of samples available to reconstruct Holocene SLR. In open-ocean settings dominated by organic matter with minimal or episodic sediment inputs, pure and thick mangrove peat sequences deposited above Pleistocene carbonate banks (e.g., Macintyre and Toscano, Reference Macintyre and Toscano2004) have been shown through 14C dating to contain a record of the past 8 ka of Holocene SLR (e.g., Belize; Macintyre et al., Reference Macintyre, Littler and Littler1995; Cameron and Palmer, Reference Cameron and Palmer1995; Macintyre et al., Reference Macintyre, Toscano, Lighty and Bond2004; McKee et al., Reference McKee, Cahoon and Feller2007; Monacci et al., Reference Monacci, Meier-Grunhagen, Finney, Behling and Wooller2009). Macintyre et al. (Reference Macintyre, Toscano, Lighty and Bond2004) corrected for mechanical compaction from vibracoring, while McKee et al. (Reference McKee, Cahoon and Feller2007) and Monacci et al. (Reference Monacci, Meier-Grunhagen, Finney, Behling and Wooller2009) used the non-compacting Russian peat borer, which introduces only minimal measurement- and non-vertical coring errors. However, auto-compaction due to peat decomposition and compression-induced compaction from overburden pressure may alter original depositional elevations so that even samples acquired with no mechanical compaction require the assumption of vertical displacement and increased error in elevation ranges.
In order to have greater confidence in the elevations of intermediate peats from continuous deposits as sea-level indicators, the challenge is to determine whether the thick peat sequences have been compacted/compressed, bioturbated, interrupted by mangrove diebacks, or otherwise disturbed. An objective, quantitative assessment of density and other attributes of the peat must be made to address the issues concerning expected and inherent elevation errors due to the presumption of peat compaction. The goal of this study is to investigate the evidence for compaction on mangrove peat over long sequences using imagery and quantitative density measurements from computed tomography (CT), an innovative method for assessing structure, texture, water, and sediment content/composition. This method derives high-resolution density profiles measured along the length of cored sequences, which help determine if peat sequences are progressively compacted and dewatered, which would result in increasing peat density with depth and time. Dried peat scanned from stored cores also reveals structural characteristics of peat, including fine root matrices, large root sections, and presence of void/air space, while peat cored from under ~4 m of sediment provides density metrics for a classic setting for compaction. CT data were integrated with standard peat petrologic analysis (dry bulk density, water content, and loss on ignition [LOI]) and to field (coring) observations of subsurface peat characteristics. To calibrate the CT density scale for oceanic peat deposits, allochthonous materials from surrounding lagoon and reef areas (sediments, carbonates, and drift seeds) that might be incorporated into the peat were scanned to aid in identification and comparison to peat densities. CT scans and petrology of peat buried under 3–5 m of siliciclastic sediments provide data from a setting conducive to compaction. We tested the hypothesis that thick, continuous, sediment-starved peat deposits are of consistent composition and density (i.e., not compacted) throughout. We propose that they provide more comprehensive and potentially continuous sea-level proxy records in sequences spanning the full elevation range of Holocene deposition than could be sampled over the local range of basal elevations. Determining the degree of peat compaction will also shed light on the subsurface hydrologic environment of open ocean peat sequences and the role of seawater saturation in maintaining paleo peat elevations over millennia of SLR.
PREVIOUS WORK
Toscano and Macintyre (Reference Toscano and Macintyre2003) reconstructed Caribbean Holocene SLR as the western Atlantic sea level (WASL) curve, using the shallow reef crest coral Acropora palmata (Lighty et al., Reference Lighty, Macintyre and Stuckenrath1982) and intertidal Rhizophora mangle mangrove peat (Robbin, Reference Robbin1984; Digerfeldt and Hendry, Reference Digerfeldt and Hendry1989; Macintyre et al., Reference Macintyre, Littler and Littler1995) as the main proxies for paleo sea levels. For their model, they assumed Holocene tectonic stability in the western Atlantic and Caribbean and microtidal ranges for all sites. The coral field exhibited elevations reflecting the habitat range (0–>15 m; Lighty et al., Reference Lighty, Macintyre and Stuckenrath1982) of A. palmata, with the uppermost corals representing the reef crest, presumably within 1–2 m of sea level.
Intertidal R. mangle peat (composed overwhelmingly of fine surface and deeper-anchoring roots with lesser detrital components of leaf and wood fragments) forms essentially at the peat surface in the intertidal zone (e.g., Ono et al., Reference Ono, Fujimoto, Hiraide, Lihpai and Tabuchi2006; McKee, Reference McKee2011; Srikanth et al., Reference Srikanth, Kaihekulani, Lum and Chen2016). Based on previous studies (e.g., Toscano and Macintyre, Reference Toscano and Macintyre2003; Macintyre et al., Reference Macintyre, Toscano, Lighty and Bond2004; McKee et al., Reference McKee, Cahoon and Feller2007), mangrove peat has the potential to be a precise sea-level indicator and act as an upper limit for sea-level models if age, elevation errors, and compaction can be accounted. The WASL curve included basal peats and peat sampled from intermediate levels in 7–10 m-thick sequences. Elevation errors due to mechanical compaction from vibracoring, push/piston coring and extrusion, and non-vertical coring were reduced where possible by field measurements (Macintyre et al., Reference Macintyre, Littler and Littler1995, Reference Macintyre, Toscano, Lighty and Bond2004). Control of core top elevations was minimized based on the small tidal and surface elevation ranges (Woodroffe, Reference Woodroffe1995; Kjerfve et al., Reference Kjerfve, Rützler and Kierspe1982). Despite microtidal ranges, the peat field exhibited an elevation spread of up to 4 m above the coral field, as did a subset using only basal peats (Toscano and Macintyre, Reference Toscano and Macintyre2003), leading to lack of confidence in both ages and elevations of the peat data field to inform the placement of the WASL curve. Compaction is inconsistent with such a large positive elevation range in the data. Alternatively, up to 4 m tree heights cannot account for the high-plotting peats. Whole trees die, decay rapidly, are consumed by large cryptic insect populations (particularly termites) and disintegrate before they could be buried whole (assuming maximum measured peat accumulation of 0.4 cm/yr; McKee et al., Reference McKee, Cahoon and Feller2007). Continuous peat sequences cored by us and presumably by other scholars (e.g., Macintyre et al., Reference Macintyre, Littler and Littler1995, Reference Macintyre, Toscano, Lighty and Bond2004; Wooller et al., Reference Wooller, Morgan, Fowell, Behling and Fogel2007; McKee et al., Reference McKee, Cahoon and Feller2007; McKee, Reference McKee2011; Monacci et al., Reference Monacci, Meier-Grunhagen, Finney, Behling and Wooller2009) have not reported or dated standing canopy wood in the peat.
CT is a standard, non-destructive method for three-dimensional imaging and quantitative analysis of a wide range of organic and inorganic substances, including structural, compositional, and density measurements (Ketcham and Carlson, Reference Ketcham and Carlson2001; Cnudde and Boone, Reference Cnudde and Boone2013). CT uses a narrowly collimated beam of X-rays that rotate around a sample and record images with a series of detectors positioned at various angles. As the sample moves through the X-ray beam, data are obtained as a series of vertical slices of <1 mm thickness. Quantitative imagery results from computer computation of X-ray absorption or attenuation to produce a representation of internal structure resulting from changes in attenuation or density. Reconstruction of the slices into a 3-dimensional unit allows for multi-dimensional views of the internal features of the sample. CT numbers, or Hounsfield Units (HU), are indicative of the amount of X-ray attenuation of elements or fabrics seen in the CT image and calibrated based on the attenuation produced by air (–1024 HU), the attenuation produced by water (0 HU), and the attenuation produced by bone (+1000 HU). Many other materials have been scanned in many scientific contexts. In the geosciences, CT has been applied to a number of complex analyses, such as to computing bulk densities in fine sediments (e.g., Amos et al., Reference Amos, Sutherland, Radzijewski and Doucette1996); differentiating structures and components in peat and soil sciences (e.g., Pierret et al., Reference Pierret, Capowiez, Belzunces and Moran2002; Sleutel et al., Reference Sleutel, Cnudde, Masschaele, Vlassenbroek, Dierick, Van Hoorebeke, Jacobs and De Nevea2008;Taina et al., Reference Taina, Heck and Elliot2008; Rezanezhad et al., Reference Rezanezhad, Quinton, Price, Elrick, Elliot and Heck2009; Kettridge and Binley, Reference Kettridge and Binley2011; Elyeznasni et al., Reference Elyeznasni, Sellami, Pot, Benoit, Vieublé-Gonod, Young and Peth2012; Helliwell et al., Reference Helliwell, Sturrock, Grayling, Tracy, Flavel, Young, Whalley and Mooney2013); measuring physical and hydraulic properties in peats (pore size, shape, distribution; Mooney, Reference Mooney2002; Quinton et al., Reference Quinton, Elliot, Price, Rezanezhad and Heck2009); identifying ice-rafted stones in deep sea sediment cores (e.g., Takana and Nakano, Reference Tanaka and Nakano2009); differentiating peat and sediment components of marsh soils (Davey et al., Reference Davey, Wigand, Johnson, Sundberg, Morris and Roman2011); and determining 3-dimensional water distribution and soil macroporosity (Heijs et al., Reference Heijs, De Lange, Schoute and Bouma1995).
METHODS
Field areas
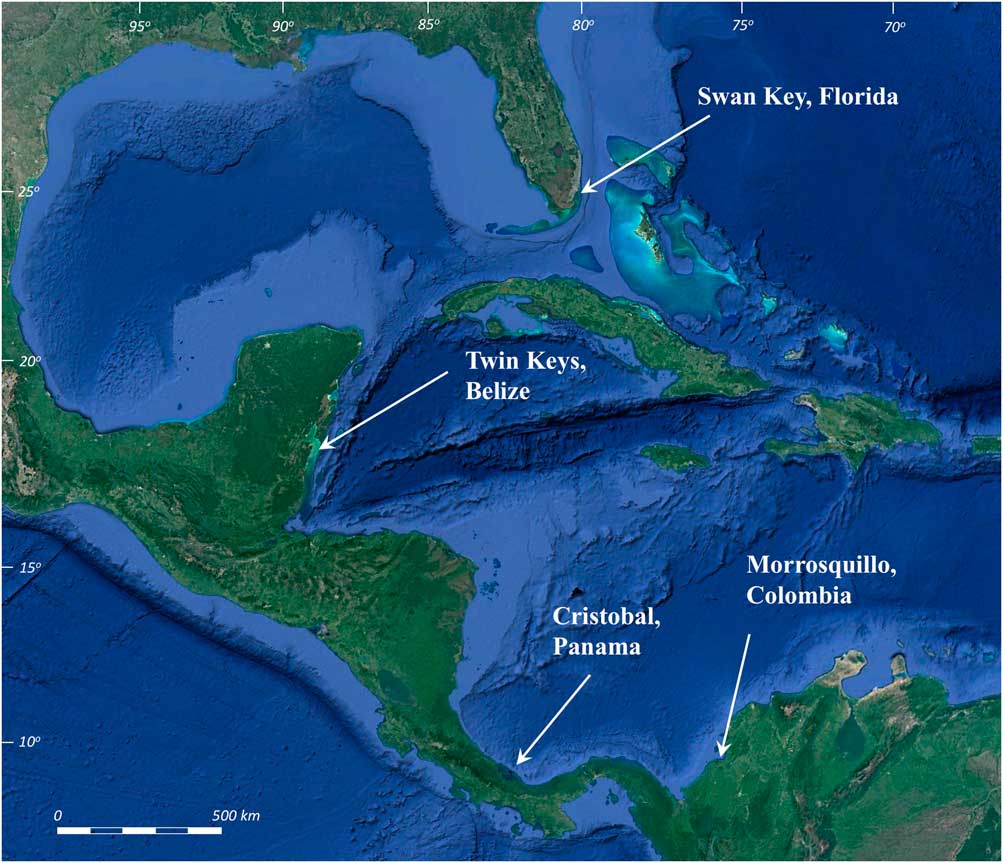
We collected new continuous R. mangle peat cores spanning the Holocene history of sea-level changes at offshore mangrove islands along the upper Florida Keys, USA; the Mesoamerican Barrier Reef in Belize, Central America; and mangrove islands in the Bocas del Toro Archipelago, Panama. Our northern locality at Biscayne National Park, Florida contains an area of historically unaltered mangroves on the southeastern side of Swan Key (25°20.77’N, 80°14.90’W, Fig. 1), consisting of 1 to >6 m of continuous R. mangle peat sequences over the highly variable, high-relief surface of the late Pleistocene Key Largo Limestone (Stanley, Reference Stanley1966; Perkins, Reference Perkins1977; Multer et al., Reference Multer, Gischler, Lundberg, Simmons and Shinn2002). In Belize, the Twin Cays mangrove archipelago, (16°50.06’N, 88°06.4’W, Fig. 1) is constructed almost entirely of continuous mangrove peat deposits ranging in thickness from 7.5 to >12 m over Pleistocene carbonate bedrock (Macintyre et al., Reference Macintyre, Littler and Littler1995; Reference Macintyre, Toscano, Lighty and Bond2004; Macintyre and Toscano, Reference Macintyre and Toscano2004; McKee et al., Reference McKee, Cahoon and Feller2007; Wooller et al., Reference Wooller, Morgan, Fowell, Behling and Fogel2007). Our Panama sites (~9°14.93’N, 82°14.45’W, Fig. 1) have <4 m of R. mangle peat in mangrove fringes surrounding siliciclastic islands (Coates et al., Reference Coates, McNeil, Aubry, Berggren and Collins2005). Sediment input to Panama mangrove peat is potentially a mixture of biogenic lagoonal carbonates and eroded siliceous sediments from the island interiors.

Figure 1 (color online) Mangrove core sites: Swan Key, Florida (25°20.77’N, 80°14.90’W); Twin Cays, Belize (16°50.06’N, 88°06.4’W); Isla Cristobal, Panama (9°14.927’N, 82°14.455’W); and Morrosquillo, Colombia (9°33.87’N, 75°32.88’W).
Additional calibration data include five basal Holocene peat samples from Morrosquillo, Colombia (9°33.87’N; 75°32.88’W, Fig. 1), cored from beneath a 3–5-m-thick sedimentary unit, to provide an example of peats presumably compacted by overburden pressure (e.g., Bird et al., Reference Bird, Fitfield, Chua and Goh2004). Lengths of air-dried peat cores from thick peat sequences in Belize (from Macintyre et al., Reference Macintyre, Littler and Littler1995) were also scanned and analyzed to study the structural and density aspects of the peat in the absence of water saturation.
Coring methods and core site selection
We conducted reconnaissance auguring of mangrove sites to determine bedrock elevation ranges and continuity of peat sections, record horizons of interest, and examine the peat before taking pristine cores. We recorded subsurface peat characteristics, species, root density, woody intervals, wet and unrecoverable intervals, water content, allochthonous materials, and the presence and type of sediment. Cores were obtained using a Russian peat borer (RPB), which cuts peat from the side of the core hole in sequential 50 cm increments, eliminating mechanical compaction. Previously cored sites with known intermediate lagoonal carbonate lenses (Macintyre et al., Reference Macintyre, Toscano, Lighty and Bond2004) were avoided. Only known/augured sites with continuous peat to bedrock were cored. Basal peat was attained when the RPB was stopped by pre-Holocene bedrock or impenetrable coral/carbonate sediment. The RPB has a 10 cm point to facilitate penetration, thus any basal sample was 10 cm above the actual bedrock level. The unsampled section between bedrock and lowest cored material may have contained marine carbonate sediment filling low areas of the platform prior to mangrove establishment or the true basal peat on bedrock, which we are unable to collect with this device. Compacted peats from Colombia were collected using a 6-cm-diameter gouge. Dried peat sections were vibracored (Macintyre et al., Reference Macintyre, Littler and Littler1995).
Core processing
Peat core sections were visually examined and photographed upon collection and described by identifiable plant components and attributes of R. mangle at all sites plus Avicennia germinans in Belize. Identifications used diagnostic root structure and coloration, species-specific rhizomes, leaf fragments and wood, all of which aid paleoenvironmental interpretations (McKee and Vervaeke, Reference McKee and Vervaeke2010). Peat is visually and qualitatively described by the size and texture of plant remains, using the relative terms very coarse, coarse, finer, and pastier. Sand, identifiable coral fragments and hash (median particle size 2 mm to <64 mm; US Federal Geographic Data Committee, 2012) and carbonate mud are reported. Sections were thoroughly plastic-wrapped to prevent water loss, covered with plastic tubing, securely taped, and refrigerated. Whole cores were CT scanned at the Smithsonian Institution. Cores were also sampled at 10 cm intervals for bulk peat LOI analysis.
Computed tomography
We used standard CT methods, and calibrated densities of air, water and seawater, bone, and shallow coastal sediments (Amos et al., Reference Amos, Sutherland, Radzijewski and Doucette1996; Davey et al., Reference Davey, Wigand, Johnson, Sundberg, Morris and Roman2011) to provide a basic framework from which to evaluate the CT densities of scanned peats and incorporated sediments. Table 1 provides these published values with new reference densities in HUs determined for a range of potential local marine components (from environments adjacent to field sites) that may have been incorporated into peat over time (pumice pebbles, drift seeds, shell, and coral) to account for compositional changes. Table 1 includes HU averages for the compacted Colombian peats and the dried peat sections.
Table 1 HU densities for established calibrations (in bold) and new data for reef and mangrove-related materials collected in this study at field sites that might be encountered in CT scan data in peat cores. “CT slice” refers to a measurement taken from the surface of a 0.62 mm cross-sectional scan or “slice” of the material (Fig. 2A). “CT profile” represents a series of CT values or HUs at sub mm increments from a profile line along the core or sample. Dried peat is from Core TR7 from Macintyre et al. (Reference Macintyre, Littler and Littler1995; Belize). Compacted peat is from a deposit in Morrosquillo, Colombia.
a Measurements of Amos et al. (Reference Amos, Sutherland, Radzijewski and Doucette1996).
b Measurements of Davey et al. (Reference Davey, Wigand, Johnson, Sundberg, Morris and Roman2011) for sedimentary types.
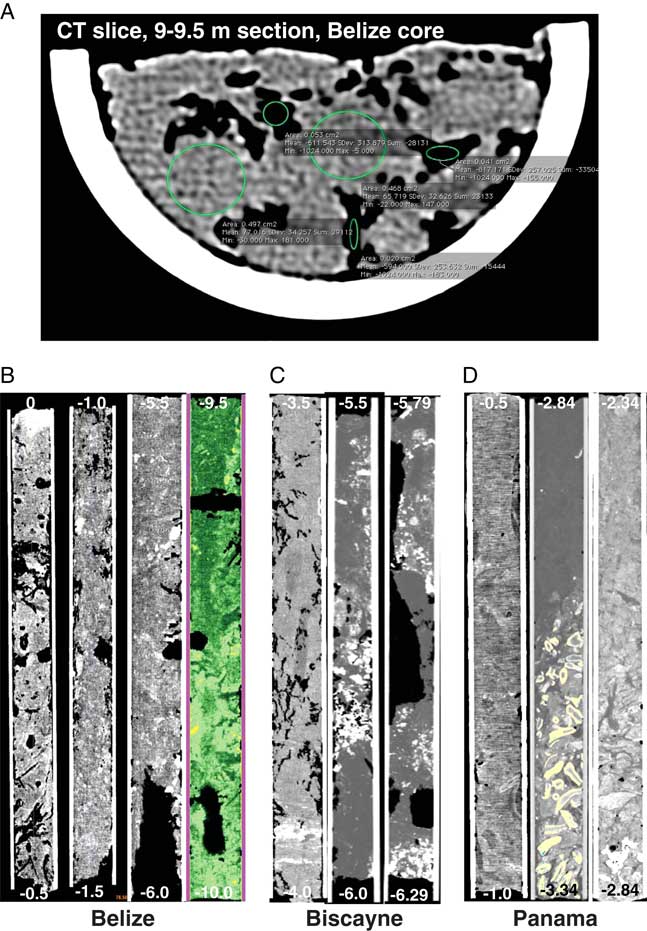
CT scanning of cores 6A (Swan Key, Biscayne, 6.5 m), 11A (Twin Cays, 11.66 m), single cores from two sites in Panama (Isla Cristobal, 3.5 m; Isla Popa, 3 m), compacted samples from Colombia, and dried peat, was completed using the Siemens Somatom Emotion Single Slice CT scanner at the National Museum of Natural History. Core sections were laid parallel to the long axis of the scanner bed and scanned in horizontal “slices” (Fig. 2A) at mA= 80 and KV= 130, with a slice width of 0.63 mm. Core scans were combined into a continuous series for each core section using a reconstruction increment of 0.6 mm, resulting in 823 slices over 493.8 mm, which accounted for 49.4 cm of the 49.6 cm core pipe length.

Figure 2 CT images of mangrove peat. (A) OsiriX image of CT slice from the 9–9.5 meter section of Belize core 11A. Green circles indicate locations of density measurements; density measurements indicated are not readable at this scale but values are given in Table 1. Black areas indicate voids. (B) CT topogram images of Belize core 11A sections 0–0.5 and 1.0–1.5 m; 5.5–6.0 m; 200 HU green mask in 9.5–10.0 m section. (C) Biscayne core sections 3.5–4.0 m showing high density sediment layer; overlapping sections covering 5.5–6.29 m with coral hash highlighted and watery voids. (D) Cristobal, Panama topograms showing typical peat from 0.5–1.0 m; carbonate material at base of Cristobal core highlighted by a 2500 HU yellow mask; and basal carbonate sediments in the Popa core. (For interpretation of the references to color in this figure legend, the reader is referred to the web version of this article.)
OsiriX was used to do initial density measurements on CT slices (Fig. 2A). Materialise Mimics Innovation Suite biomedical image processing software was used to create 3-d models of core contents. CT images of the peat textures were obtained from whole-core composition and using selected density (HU) thresholds or ranges of interest to highlight specific components, such as peat matrix or sediment lenses (Fig. 2B–D). Profile lines were drawn along the long axis of each 3-d core image to obtain continuous quantitative density measurements in HUs.
Bulk Peat Analysis
We performed standard bulk peat and LOI analysis (at 550°C) to determine bulk density, water content, percentage of organics and inorganics, along with X-ray diffraction on ash samples to determine sediment mineralogy. Measured volumes of wet bulk peat were sampled at 10 cm intervals from Biscayne core 6A (50 samples/6.5 m core), Belize core 11A (107 samples/11.66 m core), a core from Isla Cristobal (33 samples/3.44 m core), a core from Isla Popa (29 samples/2.84 m core). The CT-scanned sample XII from Colombia is comparable in peat type and thickness of overburden to a separate sample from the same deposit, with 18 LOI samples at 10 cm spacing from –4.2 to –6.0 m relative to mean sea level (MSL). Dried peat, having no water, was not analyzed. Bulk samples were processed using standard procedures for LOI (Dean, Reference Dean1974; Heiri et al., Reference Heiri, Lotter and Lemcke2001; Chambers et al., Reference Chambers, Beilman and Yu2011) and standard calculations to determine water content as percent water by volume and mass, wet bulk density, dry bulk density, LOI, ash content, and ash-free (organic matter) bulk density.
X-Ray diffraction
Following LOI, mineralogic analysis by X-ray diffraction (XRD) was conducted on LOI550 ash residues of five Biscayne samples from a sediment-rich interval (400 to 450 cm) with visible coarse quartz grains in the 30 µm size range (some FeO-stained), carbonate and coral particles, low LOI, and high bulk density values. Nine ash samples from Panama cores (5 from Isla Cristobal and 4 from Isla Popa) covered the entire sample range from uppermost peat to sediment-rich basal sections. The Belize core contained no sediment, so ash was not analyzed.
Small (~100–150 mg) portions of ashed samples were ground in an alumina mortar and pestle in ethanol, then transferred to glass slides to dry. XRD scans were obtained on a Bruker D-80 system using Cu-Kα radiation, a range of 10–70° 2θ, and a scan speed of 2°/min. Bruker EVA software was used to do background subtraction and to identify the phases through the search/match program using the International Centre for Diffraction Data PDF-2 (2008) database (http://www.icdd.com/products/pdf2.htm). Phase abundances were estimated by comparing the most intense peaks for each mineral, adjusted by I/Icor factors in the database. Intensity of the highest peak for each mineral divided by I/Icor factor corrects for relative sensitivity.
RESULTS
Core analysis
We obtained continuous CT densities along complete peat sequences to determine the normal range of peat density and to look for evidence of increasing CT and dry bulk densities down core that might be indicative of compaction. We also looked for anomalous density values indicative of compositional changes in the core (sediment or allochthonous inputs, Table 1), and assessed CT densities in concert with bulk peat characteristics. XRD indicates that pure peat samples with CT densities close to that of seawater contain minor inorganic components such as marine salts (halite [NaCl], gypsum [CaSO4·2H2O], anhydrite [CaSO4], and thenardite [NaSO4]) related to seawater saturation of peat, and evaporation of higher salinity waters in mangrove pond environments. Aragonite (CaCO3) is not detected by XRD in any peat-derived ash component despite obvious coral-rich basal sediment in several cores, which was not sampled for LOI. Calcite (CaCO3) dominates (85%) the ash at 2.79 m (5 cm above the core base) in the Popa core, and at 3.29 m (the core base) of the Cristobal core (82%).
Florida
The deepest Biscayne peat core 6A at 6.29 m in length did not reach the high-relief surface of the underlying Pleistocene Key Largo Limestone on Swan Key; however, an adjacent core (6B; ~0.5 m away) reached bedrock at –4.5 m. Core 6A consisted of very coarse R. mangle peat from 0–3.0 m in core, coarse R. mangle peat to 4.0 m, somewhat finer/pastier peat with sediment to 4.5 m, followed by an extremely watery interval from 4.5–5.0 m that retrieved only small amounts of sand and peat. This was underlain by coarse/pasty wet R. mangle peat with stringy roots and quartz sand, underlain by coarse/pasty R. mangle peat to –6.29 m with Diploria sp. coral detritus. Although the core did not reach bedrock, it contains an interval with both sand and coral for contrast with peat CT density profiles (Fig. 3).

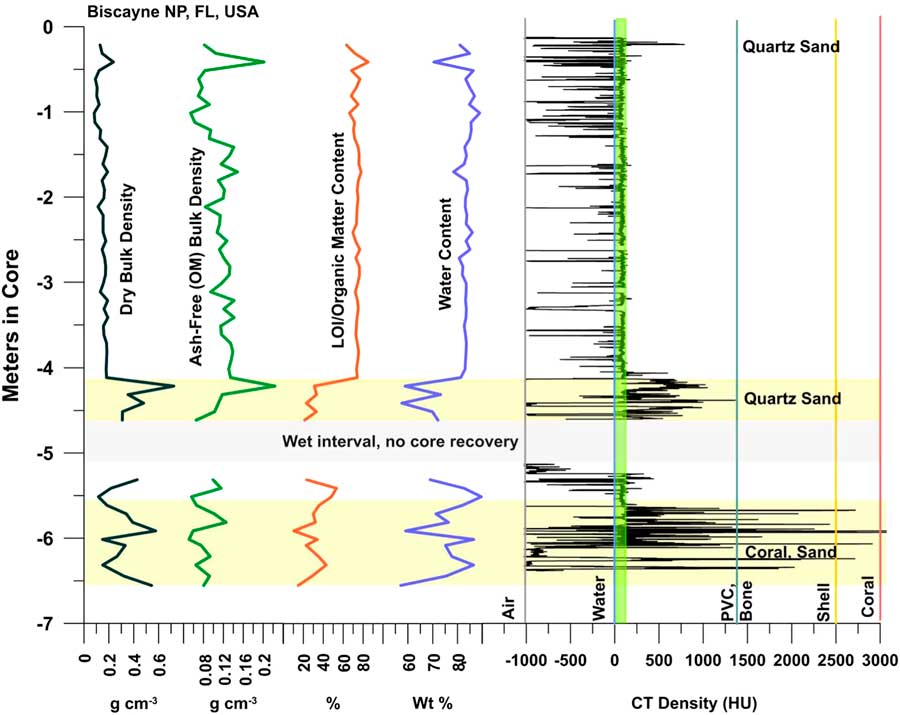
Figure 3 (color online) Graph of CT and bulk peat densities, LOI, and H2O content for Biscayne Core 6A. See Figure 2C for selected topogram images. R. mangle peat forming the upper 4 m of core becomes mixed with siliciclastic sediment and carbonate material at ~–4 m. CT densities in the peat are consistently near the HU range for seawater (~60 HU). OMC ranges from 63–85% in the peat section. Bulk densities are approximately constant with no increasing trend with depth. Void (air) spaces occur at all depths as indicated by negative spikes in CT densities, even in the sediment intervals. Water contents are >80% in the peat, dropping to ~60% in sediment. Note un-cored interval (–4.5 to –5.0 m) due to excess water in the peat. Loose, wet peat also occurred at the base of the core at –6.29 m. Ash-free bulk densities determined for both the sediment-free peat (0.11±0.03 g cm–3) and lower section with sediment (0.09±0.04 g cm–3) are identical and show no trend suggesting increasing peat decomposition down core. Positive spikes occur at the top and in the –4 to –4.5 m section where sand was encountered.
CT/LOI /XRD
From 0–4.0 m in the core, pure R. mangle peat exhibits bulk densities from 0.082 to 0.237 g cm–3, (mean 0.15±0.33 g cm–3; Fig. 3), which is consistent with tropical ombotrophic peats (Page et al., Reference Page, Wust, Weiss, Rieley, Shotyk and Limin2004) and other continuous offshore mangrove peat deposits (Monacci et al., Reference Monacci, Meier-Grunhagen, Finney, Behling and Wooller2009). LOI values representing organic matter content (OMC) are high, ranging from 63 to 85% in peat, but decreasing to 28.3±5% in the lower sediment-rich interval. CT densities include negative numbers signifying void spaces, and peat values ranging from 24.2 to 104.1 HU. Ash yields from peat average 4.3%, from a minimum of 3.5% to a maximum of 7% at the top of the core where sand grains were observed. Water content of the peat interval (Table 2, Fig. 3) ranges from 70 to 89%, averaging 83%.
Table 2 Core description, CT densities, and LOI data for Biscayne Core 6A. Rm refers to Rhizophora mangle peat.

From 4.0–4.5 m, significant sediment present in the peat immediately increases bulk densities to a maximum of 0.72 g cm–3 (0.34±0.16 g cm–3) with order of magnitude higher ash yields to 36.7% (Table 2). Water content remains high, ranging from 57 to 89.6%, averaging 73%. Five samples had low (21–33%) LOI/OMC indicative of high inorganic matter values, generally high CT densities (238–769 HU; one void at –984 HU), coarse grains of quartz, and coral hash.
The interval from 4.5–5.0 m was too wet to recover a core, and from 5.0–5.5 m core recovery was low, again due to high subsurface water content (69–89%), but ash yields remain high due to sediment. CT values indicate voids at this level as well as typical values for peat (79 HU) and sandy peat (141.6 HU; Table 2, Fig. 3). From 5.5–6.29 m, water content (57–86%), ash (7.7–36.7%), and CT densities (66–1055; Table 2) remain high.
Ash-free bulk density ranges from 0.05 to 0.22 g cm–3, which is similar to other peat types. Aside from anomalies at 0.3 and 4.1 m (Fig. 3) where quartz sand was also detected, virtually the same ash-free bulk densities were determined for both the sediment-free peat (0.11±0.03 g cm–3) and lower section with sediment (0.09±0.04 g cm–3). Ash samples analyzed via XRD were dominated by quartz (65–78%; Table 2) with small percentages of halite, anhydrite, and hematite. Despite coral hash seen in cores, no carbonates or gypsum were detected by XRD in the ash samples.
Belize
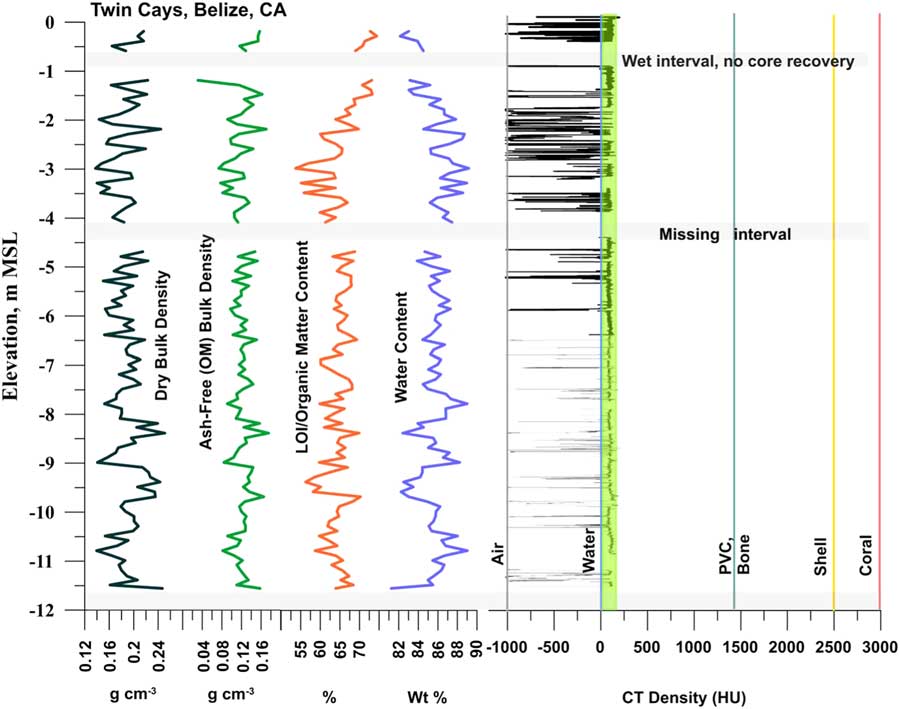
Core 11A consisted of 11.66 m of 100% R. mangle peat from top to Pleistocene bedrock; many similar thick, wet peat cores have been taken on Twin Cays. A basal carbonate sediment layer was not present above the RBP tip at this core site, and there was no discernable sediment throughout its length. The lowermost 50 cm of peat was extremely loose and wet and oozed from the coring device (Fig. 4).
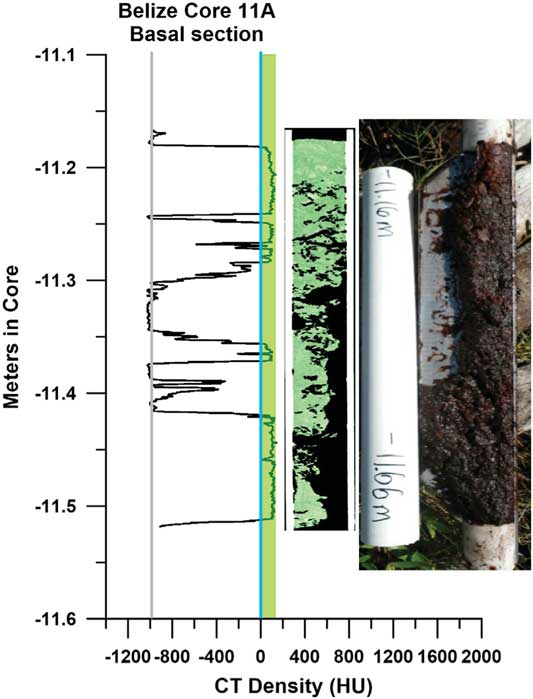
Figure 4 CT density profile of basal section of Belize core 11A, recording large gaps and low-densities, with topogram showing void spaces and field photo showing loose, water-saturated, un-compacted peat at –11.66 m.
CT/LOI/XRD
Through the entire core, R. mangle peat exhibited dry bulk densities averaging 0.19±0.03 g cm–3 (Fig. 5), similar to the range for Biscayne but over almost twice the depth of that core. LOI/OMC averages 64.9%. CT densities include high negative numbers approaching the density of air (–1000), including at ends of core sections and intervals of low recovery, to a maximum of 155.6 HU near the base of the core. If values (<–800 HU; voids in peat) are removed, the minimum peat density rises to –739.9 HU, and the mean density is –6.6 HU with a standard deviation of 222.13 HU. Removing a wider range of voids (HU <–200) from the calculation yields a mean value of 60.5 HU (~seawater value) for the peat.

Figure 5 (color online) CT densities and bulk peat analysis for Belize Core 11A. See Figure 2B for selected topogram images. Note the consistent R. mangle peat composition over the full 12 m, with no basal sediment or lagoonal material. OM averages 64±4%. CT densities are consistent down core, near the upper HU range for seawater (~60 HU). Bulk densities vary but do not trend higher down core. Void (un-compacted) spaces occur at all depths indicated by negative CT densities. Water contents are >80% throughout; note un-cored intervals due to excess water in the peat, and the loose, wet peat at –11.66 m (Fig. 4). Ash-free (OM) bulk densities averaging 0.12±0.02 g cm–3 are identical to the 6.3 m Biscayne section and show no trend in peat decomposition or major changes in surface moisture conditions over time.
Ash yields average 4.97% in the 9.0–9.5 m interval. Water content of the entire core is essentially uniform and very high, averaging 85.8±1.6% (Table 3). Ash-free bulk density averages 0.12±0.02 g cm–3 (Table 3), values essentially identical to the shorter section at Biscayne and showing no trend with depth. The 12 m peat section at Belize shows no increase in peat density (via any metric) down core.
Table 3 Core description, CT densities, and LOI data for Belize Core 11A. Rm refers to Rhizophora mangle peat.

Panama
Peat depths to basal/underlying sediments at Panama sites occur over a shallow range of <1 m, ~20 m inland of the fringe zone, to just >3 m in the fringe zone. In both the Isla Cristobal core at 3.34 m long (Fig. 6), and the Isla Popa core at 2.84 m long (Fig. 7), peat rests on lagoonal carbonate sediments. The deepest 50 cm section of the Isla Cristobal core contained ~30 cm of sediment and Porites sp. rubble. We could not core through this underlying sediment with the RPB and do not know if the sediment is basal or an interfingering lens above deeper peat. This core depth is consistent with a core from Isla Cristobal represented in McKee et al. (Reference McKee, Cahoon and Feller2007).
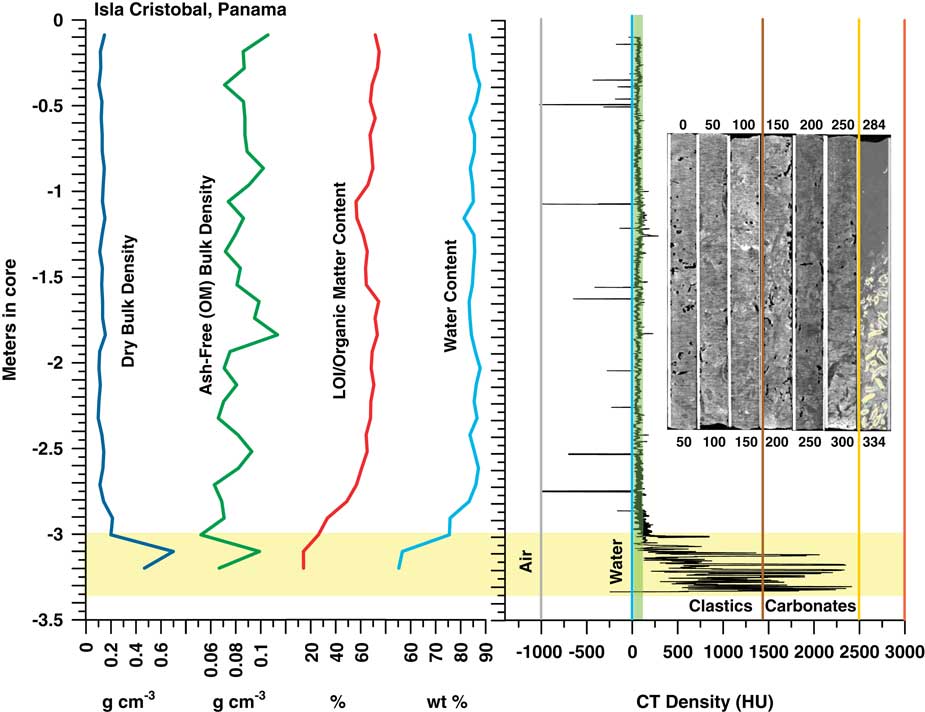
Figure 6 (color online) Graph of CT and bulk peat densities, LOI, and H2O content analysis and CT topogram images for the Cristobal, Panama core. OMC averages 67±5% in the peat section. CT densities are slightly higher in this short core compared to Belize and Biscayne, possibly due to the presence of minor terrigenous and carbonate sediment in the peat. The peats exhibit no trend in CT or bulk density with depth. High densities at the bases of cores reflect the lagoonal sediment and coral underlying the peat. Water content in peat is uniformly >80%, dry bulk density is uniformly low (0.13±0.02 g cm–3), and ash-free organic matter OM bulk density (0.09±0.01 g cm–3) is consistent with Biscayne and Belize.

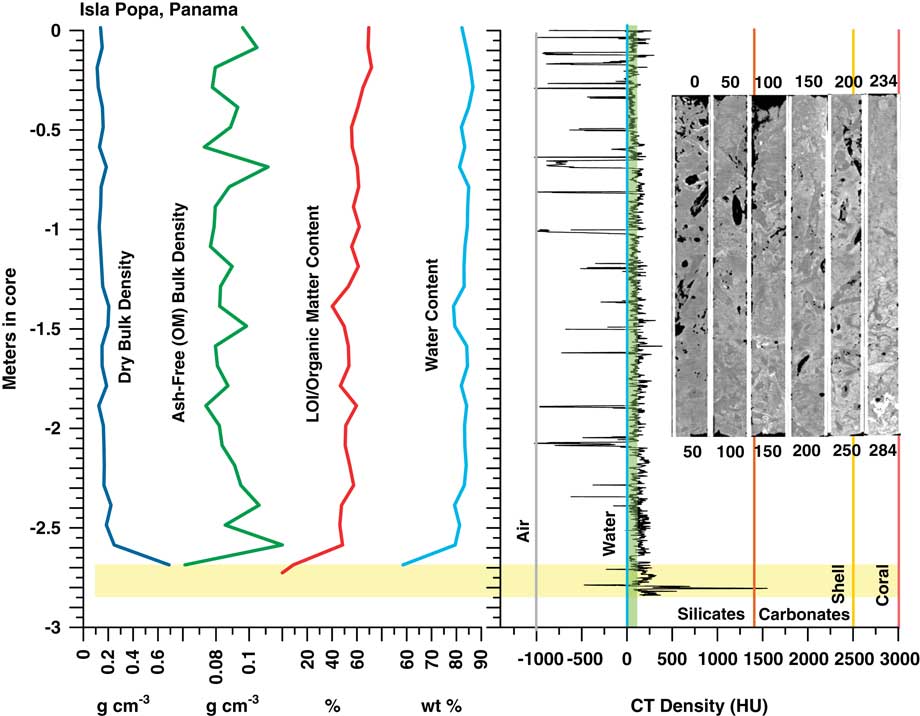
Figure 7 (color online) Graph of CT and bulk peat analysis and CT topogram images for Popa, Panama core. OMC averages 57±7%, somewhat lower than other cores, and CT densities are higher than in the Cristobal core, likely due to the presence of terrigenous and carbonate sediment in the peat, or more woody components. Despite the higher density overall, the peat section exhibits virtually no trend in density with depth. High densities at the base of the peat reflect the underlying lagoonal sediment and coral. Water content in the peat section above the sediment is uniformly >80%, dry bulk density is uniformly low (0.16±0.03 g cm–3), and ash-free (OM) bulk density is (0.09±0.01 g cm–3) is consistent with all other cores in this study.
CT/LOI/XRD, Isla Cristobal core
The CT and LOI profile in Figure 6 shows consistent peat densities to ~–2.9 m in core where peat transitions into lagoonal carbonates. Samples from 9 and 69 cm (0.09–0.69 m) are pure peat with CT densities (66 and 50 HU) very close to that of seawater (Table 4). Minerals found include halite (90 and 80%), anhydrite (10 and 10%), thenardite (0 and 5%), hematite (5 and 0%), and quartz (3 and 3%). At 119 cm, CT density peaks at 141 HU, likely due to the presence of woody matter or small amounts of sediment. Minerals include hematite (60%), thenardite (30%), and gypsum (<5%).
Table 4 Core description, CT densities, and LOI data, Panama Isla Cristobal and Isla Popa cores. Rm refers to Rhizophora mangle peat.

At 219 cm, the core returns to pure peat with CT density (32 HU) very close to that of seawater and minerals similar to the 9 cm and 69 cm samples (halite 80%, anhydrite 10%, thenardite 5%, and quartz 3%). At 289 cm CT density increases slightly to ~94 HU, halite decreases to 40%. Hematite (25%), quartz (25%) and feldspar (<10%) are present at this depth. In the sediment at 329 cm (Table 4), the highest CT density of 1344 HU occurs with a correspondingly low LOI of 14.3% and with calcite dominating the sediment at 82% of the ash component.
OMC averages 67±5% in the peat section, dropping to 61±10% including the basal sediment (Fig. 6). Ash yields average 7.7%, from a minimum of 3.8% to a maximum of 38.4%, with highest values occurring in the sediment section from 319–329 cm. Water content of the entire core (Table 4) is essentially uniform and very high, averaging 82.8%, apart from the sediment section (55.25%) below 319 cm (Fig. 6). Dry bulk density above the sediment ranges from 0.1 to 0.21 g cm–3 (0.13±0.02 g cm–3) while ash-free bulk density ranges from 0.05 to 0.11 (0.08–0.09±0.01 g cm–3), similar to Biscayne and Belize.
CT/LOI/XRD, Isla Popa core
Although of slightly higher density overall than the Cristobal core, CT and LOI profiles of the Popa core in Figure 7 show consistent peat densities to ~–2.7 m in core where peat transitions into lagoonal carbonates. Samples at 9, 89, and 149 cm (0.09, 0.89, 1.49 m) have CT densities very close to that of seawater (~78–100 HU; Table 4). Minerals present at 9 and 89 cm include halite (80%, 75%), hematite (10%, 5%), anhydrite (5%, trace), thenardite (5%), quartz (trace, 15%), plagioclase (trace, 5%), and traces of calcite. At 149 cm (1.49 m) clastic components increase with 50% plagioclase, 30% quartz, 15% hematite, and 5% calcite. CT density of ~660 HU at 279 cm (2.79 m; Table 4) shows a high peak due to the presence of 85% silt-sized calcite grains. Salts include halite 10%, anhydrite 5%, with traces of quartz and hematite. Ash yields average 8.6%, from a minimum of 4.1% to a maximum of 37.8% at 2.79 m (the peat-sediment interface). OMC averages 57±7% in the peat section, dropping to 54±11% including the basal sediment. Water content of the entire core (Fig. 7; Table 4) is essentially uniform and very high, ranging from 58% in the sediment section to 87% in peat, averaging 82%. Dry bulk density above the sediment ranges from 0.11 to 0.25 g cm–3 (0.16±0.03 g cm–3) while ash-free (OM) bulk density ranges from 0.07 to 0.12 g cm–3 (0.09±0.01 g cm–3), similar to all cores in this study.
Compacted peat CT
Basal Holocene peats from Morrosquillo, Colombia (Fig. 1) were cored from beneath 3–5 m of sand, clay, and peat overburden, a classic setting for compression and dewatering (Bird et al., Reference Bird, Fitfield, Chua and Goh2004). Five samples were CT scanned for density profiles and total number of voxels at all HU values. Additional samples from similar depths were analyzed via LOI to characterize these buried peats against the attributes of continuous peats.
CT/LOI compacted peat
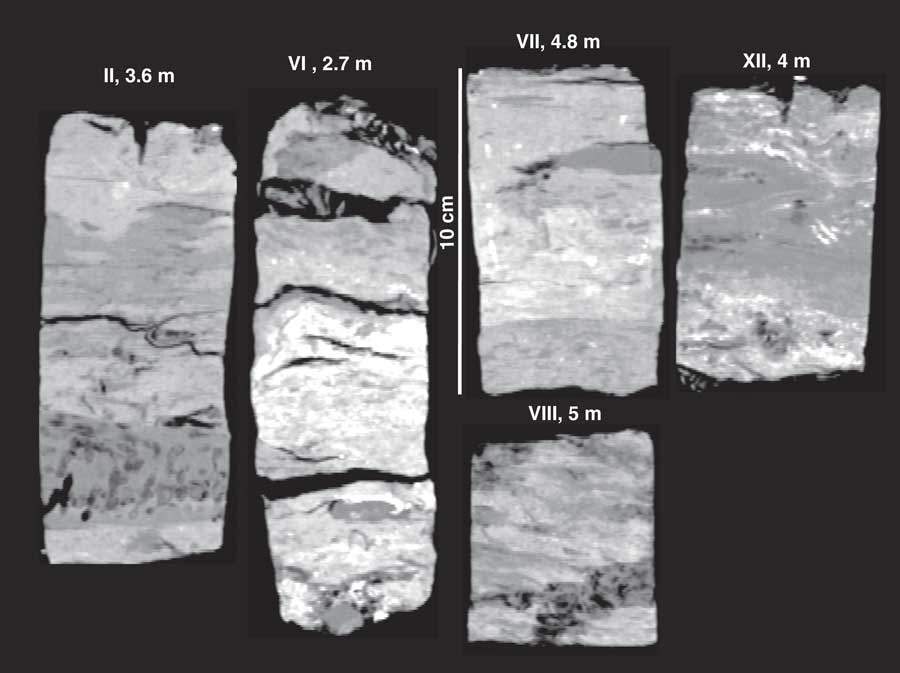
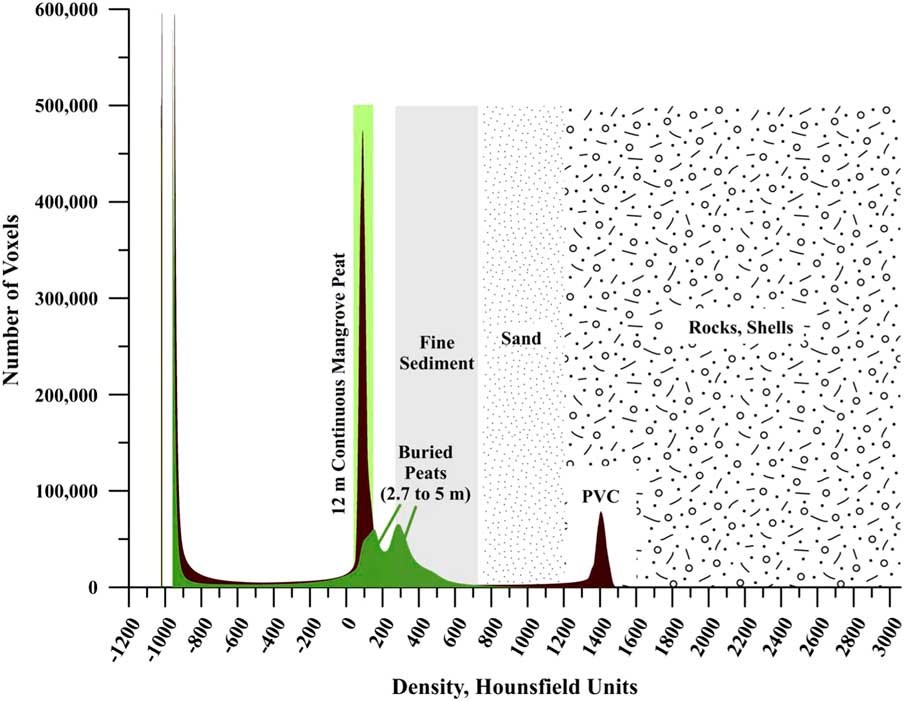
Figure 8 shows CT images of Morrosquillo peats with depths in core (= m overburden). Figure 9 plots CT densities measured (in 3-d) on all samples in Figure 8 as a histogram, with all core sections of Belize core 11A. Belize cores plot over the same density range regardless of depth in core, with 12 m appearing as a single peak centered on 75 HU. Morrosquillo samples exhibit a bimodal density distribution with peaks at 175 and 300 HU. Higher CT densities in buried peats are consistent with generally higher LOI values from another sample in this deposit that is depth- and type-correlative to sample XII (Fig. 8) under 4 m overburden (Table 5). Compacted ash-free bulk densities (averaging 18±5 g cm–3) are one to three orders of magnitude higher than continuous peats (~0.15 g cm–3) while dry bulk densities (averaging 0.5±0.2 g cm–3) are similar (~0.10 g cm–3). Compacted water content averaging 62±9% is generally lower than the >80% values for the continuous peats, and comparable to lower values in sediment sections of cores above. OM% ranges from 7–85%, averaging 42±22%, suggesting compaction combined with a sediment component.

Figure 8 CT images of buried peats from Morrosquillo, Colombia, with depths below the surface (=m of sediment overburden).

Figure 9 (color online) Three-dimensional analysis of all voxels counted from Morrosquillo peats, showing bimodal density peaks at 175 and 300 HU. For comparison, all core sections spanning the 12 m of continuous Belize core 11A are plotted, within a single peak (all sections overlapping) centered on 75 HU. Note PVC core liner peak at 1400 HU. The shift to higher HU values in the buried peats is likely a combination of overburden-forced compaction and dewatering and a minor sediment component in this area. See Table 5 for LOI analysis of the buried peat. Sediment HU ranges are from the analysis of Davey et al. (Reference Davey, Wigand, Johnson, Sundberg, Morris and Roman2011).
Table 5 LOI data, Morrosquillo, Colombia basal peat section 152005 below 4 m siliciclastic overburden. Sample is correlative to CT-scanned sample XII in Figure 8.
Dried peat CT
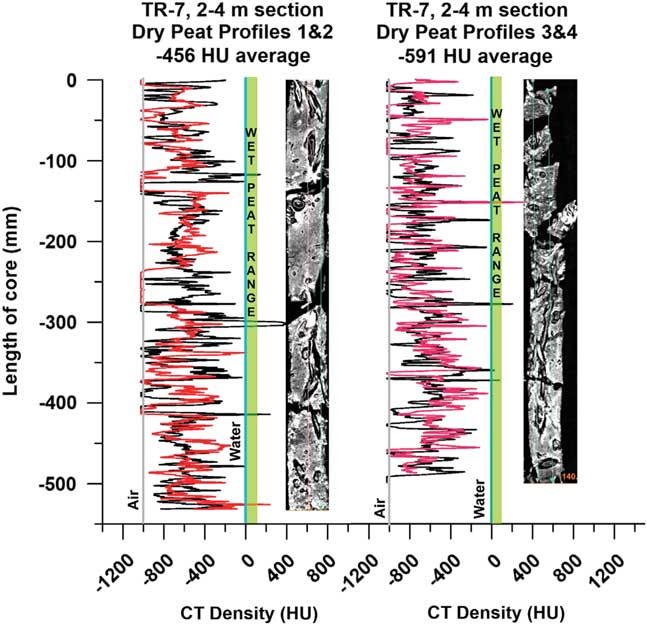
Air-dried R. mangle peat obtained from horizontally stored sections of Tobacco Range, Belize core TR7 (Macintyre et al., Reference Macintyre, Littler and Littler1995) from a 2–4 m depth range (3230 cal BP at –2.5 m MSL; Toscano and Macintyre, Reference Toscano and Macintyre2003) was scanned and densities measured on slices (Table 1) as well as from continuous core-length density profiles (Fig. 10). Drying of the peat occurred due to slow evaporation over long-term storage. CT images of the dried peat show well-preserved large root structures and woody debris in an airy, open matrix of fine surface roots (Fig. 10), indicating preservation of the original peat-forming substrate and spatial relationships with no visible packing, flattening, or loss of open root structure. Average CT densities were consistently below –500 HU, indicating that the dried sections consist of >50% air space in the material.

Figure 10 (color online) Dried peat CT density profiles, core TR-7 (2–4 m interval, ~3 ka old), Tobacco Range, Belize (Macintyre et al., Reference Macintyre, Littler and Littler1995). Density profiles 1 and 2 (left) and 3 and 4 (right) with corresponding CT topograms, showing uncompressed preservation of the fine root matrix and open structures of larger roots and voids in the peat. The dominance of air spaces and negative CT densities (~–500 HU) midway between Water (0.0 HU) and Air (–1000 HU) indicate that the water in fresh, waterlogged R. mangle peat fills void spaces and defines its general density throughout the deposit.
DISCUSSION (IMPLICATIONS FOR SEA LEVEL STUDIES)
Determining the degree of peat compaction via direct density measurements (CT), physical (core), visual (images), and proxy (BDs and water contents) data is a necessary step in understanding and possibly reducing one major area of uncertainty in assigning elevations to sea-level index points. The measurements of physical parameters in this study currently stand alone and have not yet been combined with geochemical indicators of decay or peat disturbance (such as C/N profiles and anomalies) that may indicate impacted peat ages. Density profiles and water contents cannot account for, or preclude, bioturbation, hiatuses, younger root contamination of underlying deposits, and remobilization of older peat carbon by younger roots. Our data do shed light on the subsurface hydrologic environment of open-ocean, sediment-starved peat sequences and the role of seawater saturation, tidal forces, and hydraulic pressure or conductivity in supporting and maintaining paleo peat elevations over millennia of sea-level rise.
In Belize and the Florida Keys, mangroves became established on shelf-edge Pleistocene carbonate banks after Holocene SLR reached the elevations of these sites (e.g., Robbin, Reference Robbin1984; Toscano and Lundberg, Reference Toscano and Lundberg1998; Macintyre et al., Reference Macintyre, Toscano, Lighty and Bond2004), and have accumulated peat to the present. Panamanian mangroves in the Bocas del Toro Archipelago were established on shallow carbonate lagoonal sediments around heavily vegetated clastic islands. Belize mangrove sites are 24 km offshore and receive essentially no mainland-derived sediment (Koltes and Opishinksi, Reference Koltes and Opishinksi2009), whereas in Florida, over the limited aerial extent of our core site, some pre-transgression, mainland-derived quartz sediment occurs in deeper sections of the peat above the Key Largo Limestone basement. At all sites, there is virtually no within-mangrove carbonate production apart from scattered cerithid gastropods and intertidal foraminifera, neither of which are preserved in subsurface peat, likely due to dissolution (e.g., Green et al., Reference Green, Aller and Aller1998). Bulk biogenic carbonate sediment, produced in surrounding shallow lagoons, occurs as thin basal sediment or as localized facies incursions into mangrove sequences (Macintyre et al., Reference Macintyre, Littler and Littler1995, Reference Macintyre, Toscano, Lighty and Bond2004). Uninterrupted, pure mangrove peat sequences have accreted over time in direct response to local-relative SLR through biotic mechanisms, with no assistance from incremental sediment inputs (McKee et al., Reference McKee, Cahoon and Feller2007; McKee, Reference McKee2011). Holocene accretion is represented solely by high (>80%) water content peat, whose thickness reflects the depth to basement, from –7.5 to >–12 m in Belize, >–6.5 to –1.5 m in the Florida Keys, and up to 3.5 m over basal coral-rich sediment in Panama.
RPB coring, which produces open half cores, clearly reveals peat wetness and lack of compression during the coring, including the intervals of no recovery due to excessive water mentioned above. Thus, despite our recognition of compaction for all pertinent reasons, our field observations of mangrove peat do not indicate dewatering and compression at any depth or at any site.
All of our offshore mangrove island sites have in common both the preservation of identifiable peat components (particularly refractory fine roots), persistence of voids at all depths, and consistently high water contents from surface to basement in these peat sequences regardless of thickness. Similarly, dry bulk densities, ash-free bulk densities and CT densities are consistent among sites and minimally variable down the full lengths of all cores, showing no trends of increasing density with depth regardless of peat thickness. Progressively increasing peat density and decreasing pore space and water content with depth, all primary indicators of compaction, are not observed in these sediment-free peat sections. In Belize, where the thickest peat sections occur, Monacci et al.’s (2009) peat core BT-79 from Spanish Lookout Cay similarly exhibited consistently low and minimally variable dry bulk density ranges (8 m; 0.12±0.02 g cm−3) similar to core 11A on Twin Cays (11.66 m; 0.19±0.26 g/cm3). Ash-free bulk densities in BT-79 averaging 0.12±0.02 g cm–3 were identical to core 11A and showed no trend with depth. Ash-free bulk densities from shorter peat sections in Biscayne core 6A (4 m; 0.11±0.03 g/cm3), Cristobal (3 m; 0.09±0.01 g/cm3) and Popa (3 m; 0.09±0.01 g/cm3) are essentially the same as in Belize (0.12±0.02 g cm–3), which is almost twice the thickness of the Biscayne peat and four times the thickness of the Panama peats. These values are consistent with ash-free bulk densities in continental ombotrophic peats, falling closer to the lowest values (~0.08 g cm−3) that signify well-preserved identifiable plant components accumulated more rapidly in a wet environment (such as a tidal mangrove), than to the highest values (0.2 g cm−3), which signify more decomposed and unidentifiable peats formed more slowly under drier conditions (Yu et al., Reference Yu, Campbell, Campbell, Vitt, Bond and Apps2003). Ash-free bulk density might therefore be used as a rough proxy for variation in the degree of total peat decomposition correlated to surface moisture conditions over time, which, in the case of intertidal mangrove fringe zones, is consistently high. Monacci et al. (Reference Monacci, Meier-Grunhagen, Finney, Behling and Wooller2009) specifically state that the relatively uniform bulk densities in their core indicate compaction was not significant and unlikely to have influenced the elevations of dated samples used in sea-level interpretation. Bird et al.’s (Reference Bird, Fitfield, Chua and Goh2004) compaction experiments were conducted on highly complex peat and sediment sequences, including peats under sediments, around Singapore in order to estimate the amount of compaction of any sediment or peat interval based essentially on the difference between initial bulk density (modern/surface, 0–5 cm) and compacted bulk density (fossil/subsurface, 15–20 cm). Our core sequences are comparatively uncomplicated, with no sediment intervals to compress the underlying peat and microtidal ranges limiting the degree of peat exposure and draining. In addition, our direct CT measurements of peat density and sample bulk densities demonstrate that density does not increase with depth. Water contents remain very high through the peat sections, with no decreasing trend with depth, as would be predicted by the assumption of compaction. In contrast, our peat samples from Colombia, taken from beneath several m of sediment, show up to three orders of magnitude higher ash-free BDs than continuous peats, as well as higher dry bulk densities, and lower water contents (~67% vs >80%). In addition, our dried-peat images and data indicate that peat maintains its open root structure, exhibits the negative CT densities of the observed air spaces, and shows no visual or quantitative evidence of compaction.
In sediment-free R. mangle peat, fine surface root production parallels surface litter production indicating healthy stands with high productivity, specifically in fringe zones (McKee et al., Reference McKee, Cahoon and Feller2007). Leaves and other aboveground materials undergo fragmentation and some decomposition before burial, while roots produced in an anaerobic environment are well preserved (Middleton and McKee, Reference Middleton and McKee2001; McKee et al., Reference McKee, Cahoon and Feller2007; McKee, Reference McKee2011). Roots were well preserved in another of our long cores to 10 m basal depths, representing up to 90% of the peat throughout the section. McKee and Faulkner (Reference McKee and Faulkner2000) determined that Cat Cay, Belize, has expanded horizontally and vertically through belowground, biogenic processes, with mangrove roots playing a critical role in peat formation and vertical accretion of oceanic mangrove cays. In Belize, the only one of our sites with Rod-Surface Elevation Table (RSET) measurements of peat elevation changes relative to benchmark depths over a 3-yr period. McKee et al. (Reference McKee, Cahoon and Feller2007) found trends ranging from -3.7 mm yr–1 (interior dwarf/pond) to +4.1 mm yr–1 (fringe). The interior dwarf/pond facies is a hypersaline, high-stress environment with slow growing dwarf R. mangle trees and low rates of peat (root and litter) accumulation, while the fringe zone is on the leading edge of SLR and allochthonous nutrient inputs (Feller et al., Reference Feller, McKee, Whigham and O’Neill2003), supporting the positive 3-yr elevation change rate which is of the same order of magnitude as the rate of local relative SLR. The rate of Holocene peat accumulation must likewise include peat productivity variations resulting from lateral migration of dwarf, transition, and fringe zones across core sites through time, and many possible but undetectable interruptions in peat deposition, including hiatuses due to mangrove diebacks (Cahoon et al., Reference Cahoon, Hensel, Rybczyk, McKee, Proffitt and Perez2003) and changes in the rate of SLR. In addition, processes occurring in deeper peat may have an effect on elevation change of the peat surface (Cahoon and Lynch, Reference Cahoon and Lynch1997; Cahoon et al., Reference Cahoon, Hensel, Rybczyk, McKee, Proffitt and Perez2003; Whelan et al., Reference Whelan, Smith, Cahoon, Lynch and Anderson2005; McKee et al., Reference McKee, Cahoon and Feller2007).
Surface litter is lost from the mangrove through tidal exportation, microbial decomposition, and detrivory (Middleton and McKee, Reference Middleton and McKee2001; Ono et al., Reference Ono, Fujimoto, Hiraide, Lihpai and Tabuchi2006), which indicate that mangrove roots are the primary component of peat (Cameron and Palmer, Reference Cameron and Palmer1995; McKee and Faulkner, Reference McKee and Faulkner2000). Over a short (1 m) Rhizophora spp. peat profile, Ono et al. (Reference Ono, Hirdate, Morita, Hiraide, Hirata, Fujimoto, Tabuchi and Lihpai2015) showed via closely-spaced 14C dating that modern fine roots penetrated to at least ~80 cm, indicating the importance of high production of mangrove fine roots to peat accumulation. Indeed, our dried peat CT scans clearly show the preservation of the open structure of the surface fine root systems making up the framework of the peat, precluding any possibility of compression and compaction. The air spaces are filled with water in wet peat, indicating that water pressure maintains the spaces between the roots and exerts sufficient multidirectional pressure throughout the system to prevent compaction and compression.
Mangrove surface water flows through established tidal channels and across prop roots (Mazda et al., Reference Mazda, Kobashi and Okada2005; Urish et al., Reference Urish, Wright, Rodriguez and Feller2009). Subsurface water flow through unsaturated peat is affected by irregular pore structure (Rezanezhad et al., Reference Rezanezhad, Quinton, Price, Elrick, Elliot and Heck2009) and effective porosity, assuming decreases in porosity with depth and increasing decomposition and increases in bulk density. However, subsurface hydraulic conductivity increases with increasing organic content (Kolay and Shafiee, Reference Kolay and Shafiee2007). Hansson et al. (Reference Hansson, Rydberg, Kylander, Gallagher and Bindler2013) compared bulk density and other proxies for decomposition in an ombotrophic peat and observed that the portion of the deposit situated below the lowest water table is permanently saturated and supported by water, and cannot be further compacted. When supporting water is removed from the deposit via drainage (Kolay and Shafiee, Reference Kolay and Shafiee2007) or decreases naturally (Whelan et al., Reference Whelan, Smith, Cahoon, Lynch and Anderson2005), the peat surface subsides. In the Everglades, Whelan et al. (Reference Whelan, Smith, Cahoon, Lynch and Anderson2005) positively correlated the rate of change of groundwater head pressure (from river stage, tidal influences, and seasonal changes in river discharge) to the RSET-measured rate of change in peat surface elevation for the complete peat section in which peat swelled in response to hydrological recharge and subsided in response to lowered groundwater pressure. The majority of the expansion occurred in deeper zones of peat directly above the underlying bedrock. In the continuously saturated, sediment-starved oceanic peats at our sites, subsurface water is the key environmental component supporting the uncompressed peat structure and vertical integrity up to 12 m depth. Saturation is maintained from the top of cored intervals at all sites where the peat surfaces lie within a microtidal (~15 cm) range.
Despite the demonstrated lack of compaction in R. mangle peats in this study, these deposits must still be approached with a wider range of geochemical and physical data to be successfully used in sea-level studies. Peats have undergone aerobic decomposition in the surface litter and likely further fragmentation and diagenesis over time, as well as incorporating signatures of physical disturbances (e.g., storms, bioturbation by crabs, and mangrove diebacks) that are not necessarily discernable from visual inspection or CT imaging of cores. If a mangrove dieback occurred within the peat sequence, the resulting cessation of root production and increase in surface decomposition will incorporate decreases in peat elevation (“peat collapse”) until the rate of new root production from surviving and new mangrove trees eventually recovers. Assuming peat elevations are not lowered by compaction or collapse, 14C age inconsistencies (ubiquitous in previous cited studies with 14C dating of peat), particularly the common problem of age reversals, may be attributed to the remobilization of older carbon into younger deposits by penetrating root systems as well as to younger, large root contamination of older peat (McKee, Reference McKee2001, Reference McKee2011; Ono et al., Reference Ono, Hirdate, Morita, Hiraide, Hirata, Fujimoto, Tabuchi and Lihpai2015). McKee (Reference McKee2001) discusses the proliferation of roots into old root channels in mangrove peat as a means of nutrient conservation in oligotrophic environments, thereby mixing younger and older peat, while Ono et al. (Reference Ono, Hirdate, Morita, Hiraide, Hirata, Fujimoto, Tabuchi and Lihpai2015) documented an 80 cm depth of penetration of modern fine roots into underlying peat. Peat C/N ratios decline with depth as carbon is lost due to decomposition (Malmer and Holm, 1994) but anomalously high C/N ratios occurring possibly as a result of mixing of younger material into older peat may account for out of sequence or reversed 14C ages (e.g., Hansson et al., Reference Hansson, Rydberg, Kylander, Gallagher and Bindler2013, citing Kuhry and Vitt, Reference Kuhry and Vitt1996). C/N may therefore provide a diagnostic for disturbed or mixed samples to avoid in 14C dating of peat.
CONCLUSIONS
Where peat deposits on offshore platforms are not interrupted by sediment lenses, we found that local hydrology, buoyancy, and tidal forces maintain water pressure throughout well-preserved subsurface root systems. These processes prevent dewatering and subsidence or compaction of continuous peats, and, barring undetected hiatuses, it is highly likely that peat captures paleo-sea level at any depth within the deposit. Down-core CT data, particularly in dried peat cores, are diagnostic of structural preservation of non-compacted root systems and the prevalence of air spaces throughout thick peats where water once maintained the original root spacing. Integration of CT density profiles, bulk densities, and high water contents indicate multi-variate consistencies with depth, contrary to the basic assumptions of compaction due to overburden pressure resulting in increased density and dewatering. Peat does not create its own overburden because it is supported by interstitial water and hydrostatic pressure. CT and bulk density of peats do not vary down cores in this study; thus if CT is not available, bulk density profiles alone are reliable indicators of peat compaction.
While non-compacted peat elevations are most likely reliable, mangrove peat remains a complex proxy for paleo-sea-level reconstructions. RSET-measured rates of peat accretion or subsidence are useful for understanding hydrologic processes affecting peat elevations in specific depositional settings. Other factors affecting accurate sea level indicator status of non-compacted peat include hiatuses in peat formation, peat decomposition processes, and 14C dating errors and age reversals. Our density data show that R. mangle peat maintains high water content and hydrostatic pressure at all depths, preventing dewatering and compaction and maintaining the original sea-level-indicative elevation range of any sample at depth. Thick, non-compacted peat sections can potentially provide a continuous proxy for the full site history of SLR, particularly at open ocean platform sites where the basal peat/bedrock depth range is limited.
ACKNOWLEDGMENTS
Funding was provided by NSF (0921879 Toscano), the Smithsonian Caribbean Coral Reefs Ecosystem and MarineGEO Programs (Toscano), and the Halliburton Foundation (Gonzalez). We thank the National Park Service for park-assigned Permit BISC-2012_SCI-0010 (Study No. BISC-00013); Michelle Prats, NPS Intern, and the University of Miami Broad Key Research Station. Sampling and export permits were processed by Belize Fisheries and ARAP, Panama. Dr. Patricia Tester, Christopher Holland (NOAA NMF), J. Hootman, E. and B. James, T.B. Opishinski and Z. Foltz (Carrie Bow Cay, Belize Station Managers), and Eric Brown, Bocas del Toro, Panama, provided field and logistical assistance. Dr. James Hinthorne (UTRGV, U.S. Army Research Office Grant W911NF-08-1-0353) and students Cruz Quintana, Emmanuel Higa, and Eli Gonzalez performed XRD and some LOI analysis. Ilka C. Feller provided a comprehensive review of the manuscript, which was further improved by the comments of anonymous reviewers.