INTRODUCTION
Groupers are of great importance in the marine ecosystems of all of the subtropical and tropical seas, and they play a basic role in the food chain because they are often one of the largest carnivores of the ecosystems in which they reside (Grandcourt et al., Reference Grandcourt, Al Abdessalaam, Francis, Shamsi and Hartmann2009; Erisman et al., Reference Erisman, Craig and Hastings2010; Craig et al., Reference Craig, Sadovy and Heemstra2011). They are important to both commercial and recreational fisheries worldwide (Heemstra & Randall, Reference Heemstra, Randall, Carpenter and Niem1999). As with other predatory fishes, grouper populations have been depleted by overfishing, the destruction of both juvenile and adult habitats, ineffective management plans for their fisheries or the lack of any management policies at all (Sadovy et al., Reference Sadovy, Craig, Bertoncini, Carpenter, Cheung, Choat, Cornish, Fennessy, Ferreira, Heemstra, Liu, Myers, Pollard, Rhodes, Rocha, Russell, Samoilys and Sanciangco2013). Grouper ecology is well-known in general, but detailed information on biological characteristics is scarce for many species.
The grouper Cephalopholis taeniops (Valenciennes, 1828) is a demersal species found in shallow tropical rocky reefs and sandy bottoms up to 200 m depth in the eastern Atlantic from the western Sahara to Angola, including Cape Verde and São Tomé and Príncipe islands (Rocha et al., Reference Rocha, Ferreira, Choat, Craig, Sadovy and Bertoncini2008; Craig et al., Reference Craig, Sadovy and Heemstra2011). It is a large-sized carnivorous species (Tariche, Reference Tariche2002; Brito et al., Reference Brito, Clemente and Herrera2011).
Cephalopholis taeniops is an important component of the Cape Verdean fisheries (Tariche, Reference Tariche2002). It is caught throughout the year and all over the archipelago by artisanal fishermen, mainly with handlines, and it is sold fresh in local markets. Artisanal fishermen have historically used the same size S-hook (7–9) for catching this species. The sustainable level of catches was estimated at 99 tons (Tariche, Reference Tariche2002); however, catches of this species increased from 50 to 375 tons during the period from 1986–2002. This high level of exploitation has produced a decrease in its abundance and size, and specimens are a lower proportion of the total abundance and biomass of the fishery (Tariche, Reference Tariche2002).
For this species, Siau (Reference Siau1994) described its sexual development and population structure in Senegal, Tariche (Reference Tariche2002) studied aspects of the life history in the Cape Verde archipelago, Pereira et al. (Reference Pereira, Simas, Rosa, Aranha, Lino, Constantino, Monteiro, Tariche and Menezes2012) determined length–weight relationships in the Cape Verde islands, and Lino et al. (Reference Lino, Bentes, Oliveira, Erzini and Santos2011) researched its movement patterns on artificial reefs in the Cape Verde region. No information on age, growth or longevity exists, and it has been listed by the IUCN as a Data Deficient status (Rocha et al., Reference Rocha, Ferreira, Choat, Craig, Sadovy and Bertoncini2008). Understanding factors related to age, growth and longevity are particularly important for the management and conservation of groupers (Sadovy, Reference Sadovy, Zhou, Zhou, Yao, Lu, Hu, Cuy and Din1997). Therefore, acquiring data on variables such as age composition, growth rate and lifespan are necessary to determine the vulnerability of each species to exploitation or create even the simplest management regulations (Young et al., Reference Young, Bornik, Marcotte, Charlie, Wagner, Hinch and Cooke2006).
The lack of biological data on C. taeniops is particularly worrying because the correct management of biological resources should be grounded in the most complete information possible about the ecology of the species involved. For this reason, the goal of this paper is to estimate the age composition, longevity and growth rate of the population of C. taeniops from the Cape Verde Islands by means of otolith studies and applying indirect age validation methods to support the accuracy of the age estimates. These results may contribute to a better understanding of the ecology of this poorly understood species, and can be used to implement management rules.
MATERIALS AND METHODS
Sample collection
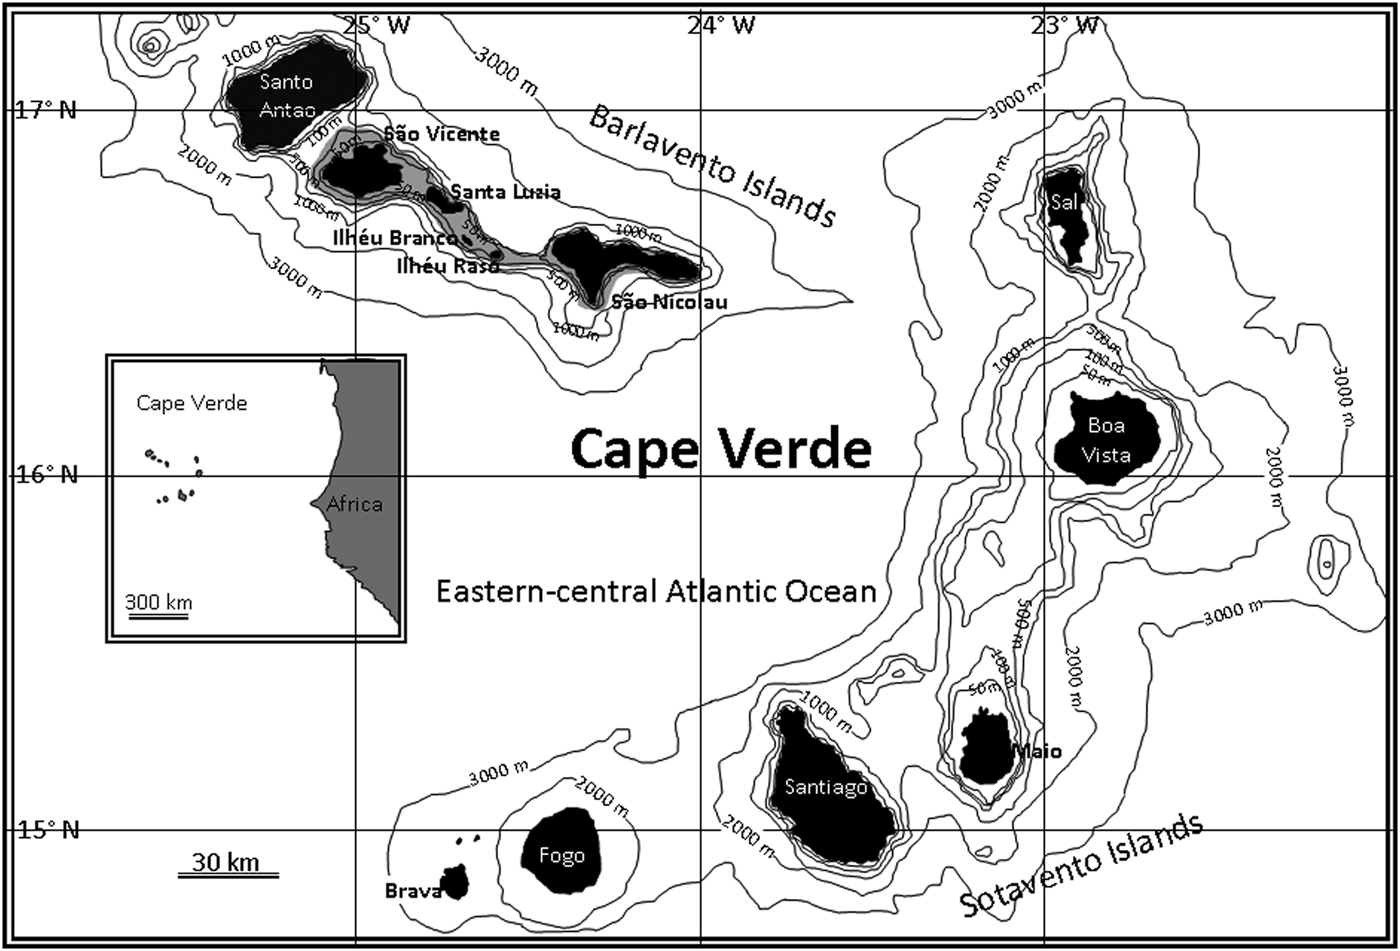
A total of 2804 individuals of C. taeniops from the islands of São Vicente and Santa Luzia (Cape Verde Islands, north-west Africa) (Figure 1) were sampled between January 2005 and December 2011. Of these, 2788 fish were caught by the local artisanal fleet with handlines at depths of 5–180 m. The remaining 16 individuals were collected with hand nets at depths of 2–5 m in a sampling which aimed to capture small fish during a fishing survey around these islands in April 2010 (cruise Cabo Verde 2010-04, Project PROACTIVA).

Fig. 1. Location of the sampling site in the Cape Verde Islands.
Each fish was measured to the nearest mm for total length (TL) and weighed to the nearest g for total mass (TW). Sagittal otoliths were removed, cleaned and stored dry for later age determinations.
Otoliths interpretation
A subsample of 173 specimens from 13 to 51 cm TL was studied to determine the most adequate age reading method, either between whole otoliths or on 1 mm otolith sections. The subsample was compared using an age bias plot and a paired t-test analysis, and the five section-based age categories 1–4, 5–8, 9–12, 13–16 and 17+ years were estimated (Campana et al., Reference Campana, Annand and McMillan1995; Campana, Reference Campana2001). Otoliths were sectioned by their frontal plane following that of the fish (Wright et al., Reference Wright, Panfili, Morales-Nin, Geffen, Panfili, de Pontual, Troadec and Wright2002) and prepared according to McCurdy et al. (Reference McCurdy, Panfili, Meunier, Geffen, de Pontual, Panfili, de Pontual, Troadec and Wright2002).
A binocular magnifying glass was used (×10) to conduct the readings. Whole otoliths were read on the concave part on the upper side (distal face) using reflected light. Otolith sections were read using reflected light. Prior to these readings, different liquids, which included seawater, ethanol and glycerol, were used in some otoliths to enhance the appearance of growth rings. Burning and staining techniques were also applied to enhance the appearance of growth rings (McCurdy et al., Reference McCurdy, Panfili, Meunier, Geffen, de Pontual, Panfili, de Pontual, Troadec and Wright2002). There were no differences in the readings with different techniques for the enhancement of the growth rings; therefore, seawater was adopted as the standard protocol.
Finally, annuli were counted on otolith sections following the transverse axis. All sections were aged twice by two readers without prior information on length or time of capture. When counts did not agree, a third reading was performed, and the two concurring readings were accepted as the age of the fish. When the three counts differed, the otolith was rejected from further analysis. In this comparison, readings were conducted in a random order (Dwyer et al., Reference Dwyer, Stephen and Campana2003). Data obtained from each of the readings were recorded in independent files, following Morales-Nin & Panfili (Reference Morales-Nin, Panfili, Panfili, de Pontual, Troadec and Wright2002a).
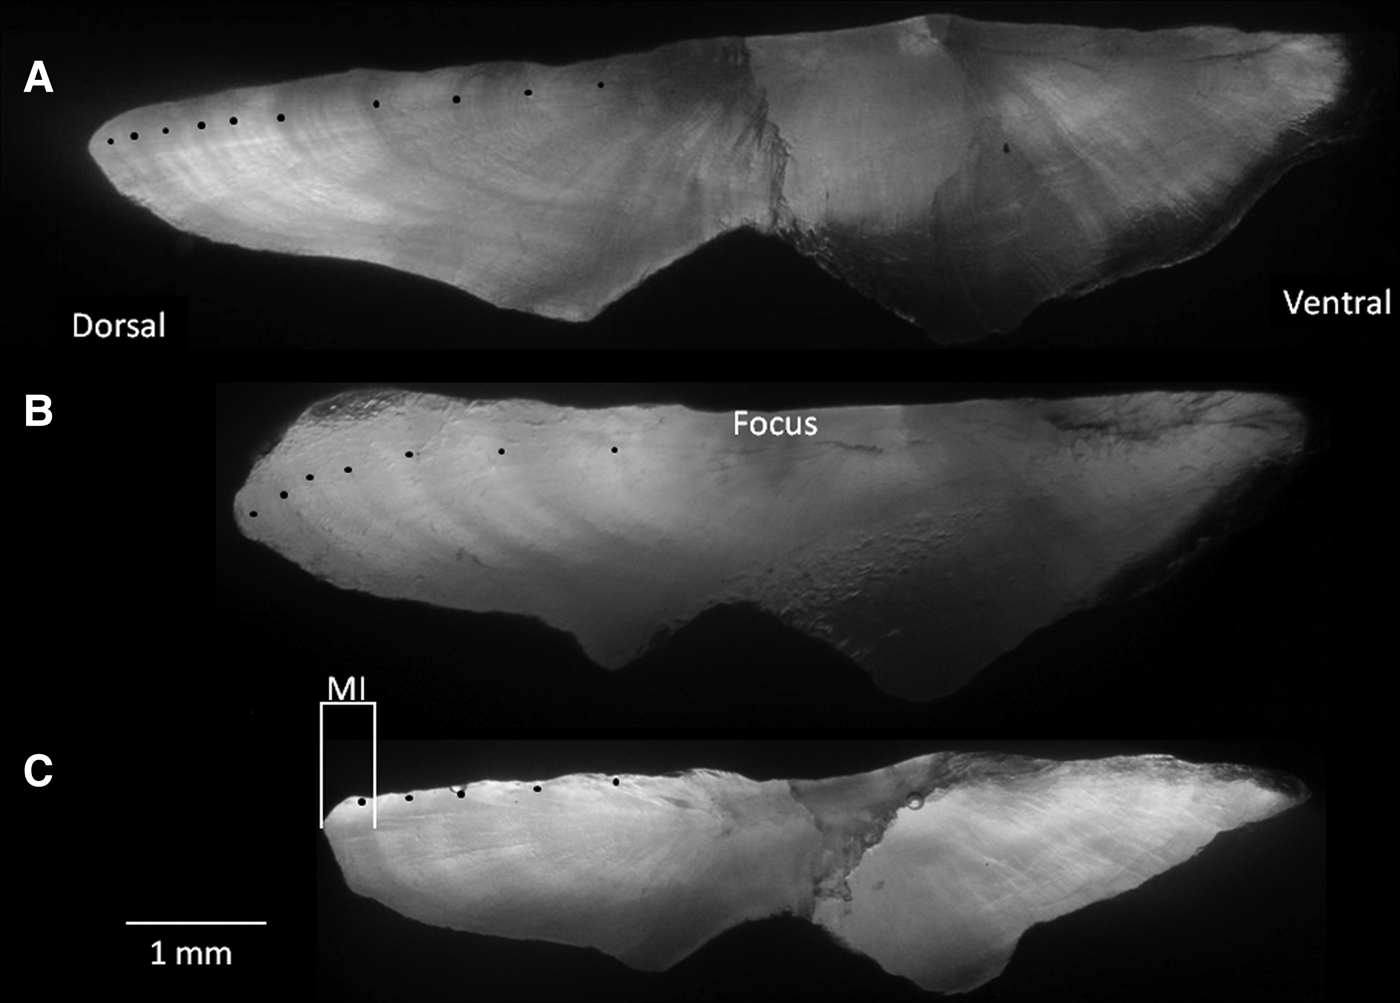
The marginal increment (distance from the inner margin of the outermost translucent ring and the periphery of each otolith, MI) was measured on otolith sections with an ocular micrometre (Figure 2). Measurements were always made along the longest axis of the otolith.
Fig. 2. Sectioned sagittal otoliths of Cephalopholis taeniops off the Cape Verde Islands. 10-year-old specimen (42.1 cm TL) (A); 7-year-old specimen (35.8 cm TL) (B); and 5-year-old specimen (29.7 cm TL) (C). MI is the marginal increment measured.
Data analysis
The bias and precision of annuli counts were compared between readers, using paired t-tests and age bias plots (Campana et al., Reference Campana, Annand and McMillan1995; Campana, Reference Campana2001). For each paired comparison, a coefficient of variation (CV) was also used to measure precision, together with a paired t-test to compare differences statistically (Chang, Reference Chang1982; Dwyer et al., Reference Dwyer, Stephen and Campana2003).
To validate the periodicity in the increment formation at each age class, a marginal increment analysis was performed (Panfili & Morales-Nin, Reference Panfili, Morales-Nin, Panfili, de Pontual, Troadec and Wright2002). Owing to the wide range of ages encountered, marginal increments were estimated by ages combined in four age groups representing, at least, young, moderate and old individuals (Campana, Reference Campana2001).
Temperature data, obtained from the Marinemet Project (www.afrimet.org/marinemet/), were used to relate the formation of translucent and opaque rings in the otoliths to the sea surface temperature. Temperature data were also recorded from 0 to 200 m in depth around the islands by a sensor for temperature, pressure and conductivity (XR–420–CTD, Richard Branker Research Ltd), to corroborate changes in temperature with depth.
To assign the age class (number of calendar years after the birth date) to which a fish belonged the number of annual rings was counted, and information on the date of capture, the nature of the margin of the otolith, the main period of a seasonal increment formation and the birth date were taken into account (Morales-Nin & Panfili, Reference Morales-Nin, Panfili, Panfili, de Pontual, Troadec and Wright2002b). The 1st of July was considered as the birth date, corresponding to the mid-point of the spawning period. The difference between the date of capture and the birth date helped to estimate the annual fraction elapsed since the last birth date, and the annual fraction is added to the number of complete translucent rings to avoid any potential bias in growth estimates due to the differences in sampling data (Gordoa & Molí, Reference Gordoa and Molí1997).
Growth models
Length-at-age was described using the von Bertalanffy growth function, the seasonalized von Bertalanffy growth function, the Schnute growth model and the Gompertz growth model (Pitcher & Macdonald, Reference Pitcher and Macdonald1973; Ricker, Reference Ricker1975; Schnute, Reference Schnute1981). A non-linear method of Levenberg–Mardquart's algorithm was used to estimate the growth parameters. The selection of the best growth model was based on the Akaike information criterion (AIC), which can be expressed as follows: AIC = n ln((R SS/n)2) + 2j, where R SS is the residual sum of squares, n is the number of observations and j is the total number of estimated regression parameters (Shono, Reference Shono2000). For model comparisons, the ΔAIC and the Akaike weights (w i) were calculated. The model with the smallest AIC value was selected as the best model (A b). The ΔAIC is the difference between the best model (A b) and all other models (i), expressed as: ΔAICi = AICi − A b, and represents the probability of choosing the correct model from the group of models used. The w i is calculated for each model as: w i = exp(−ΔAICi / 2) / ∑i=1rexp(−ΔAICi / 2).
RESULTS
Otolith ageing
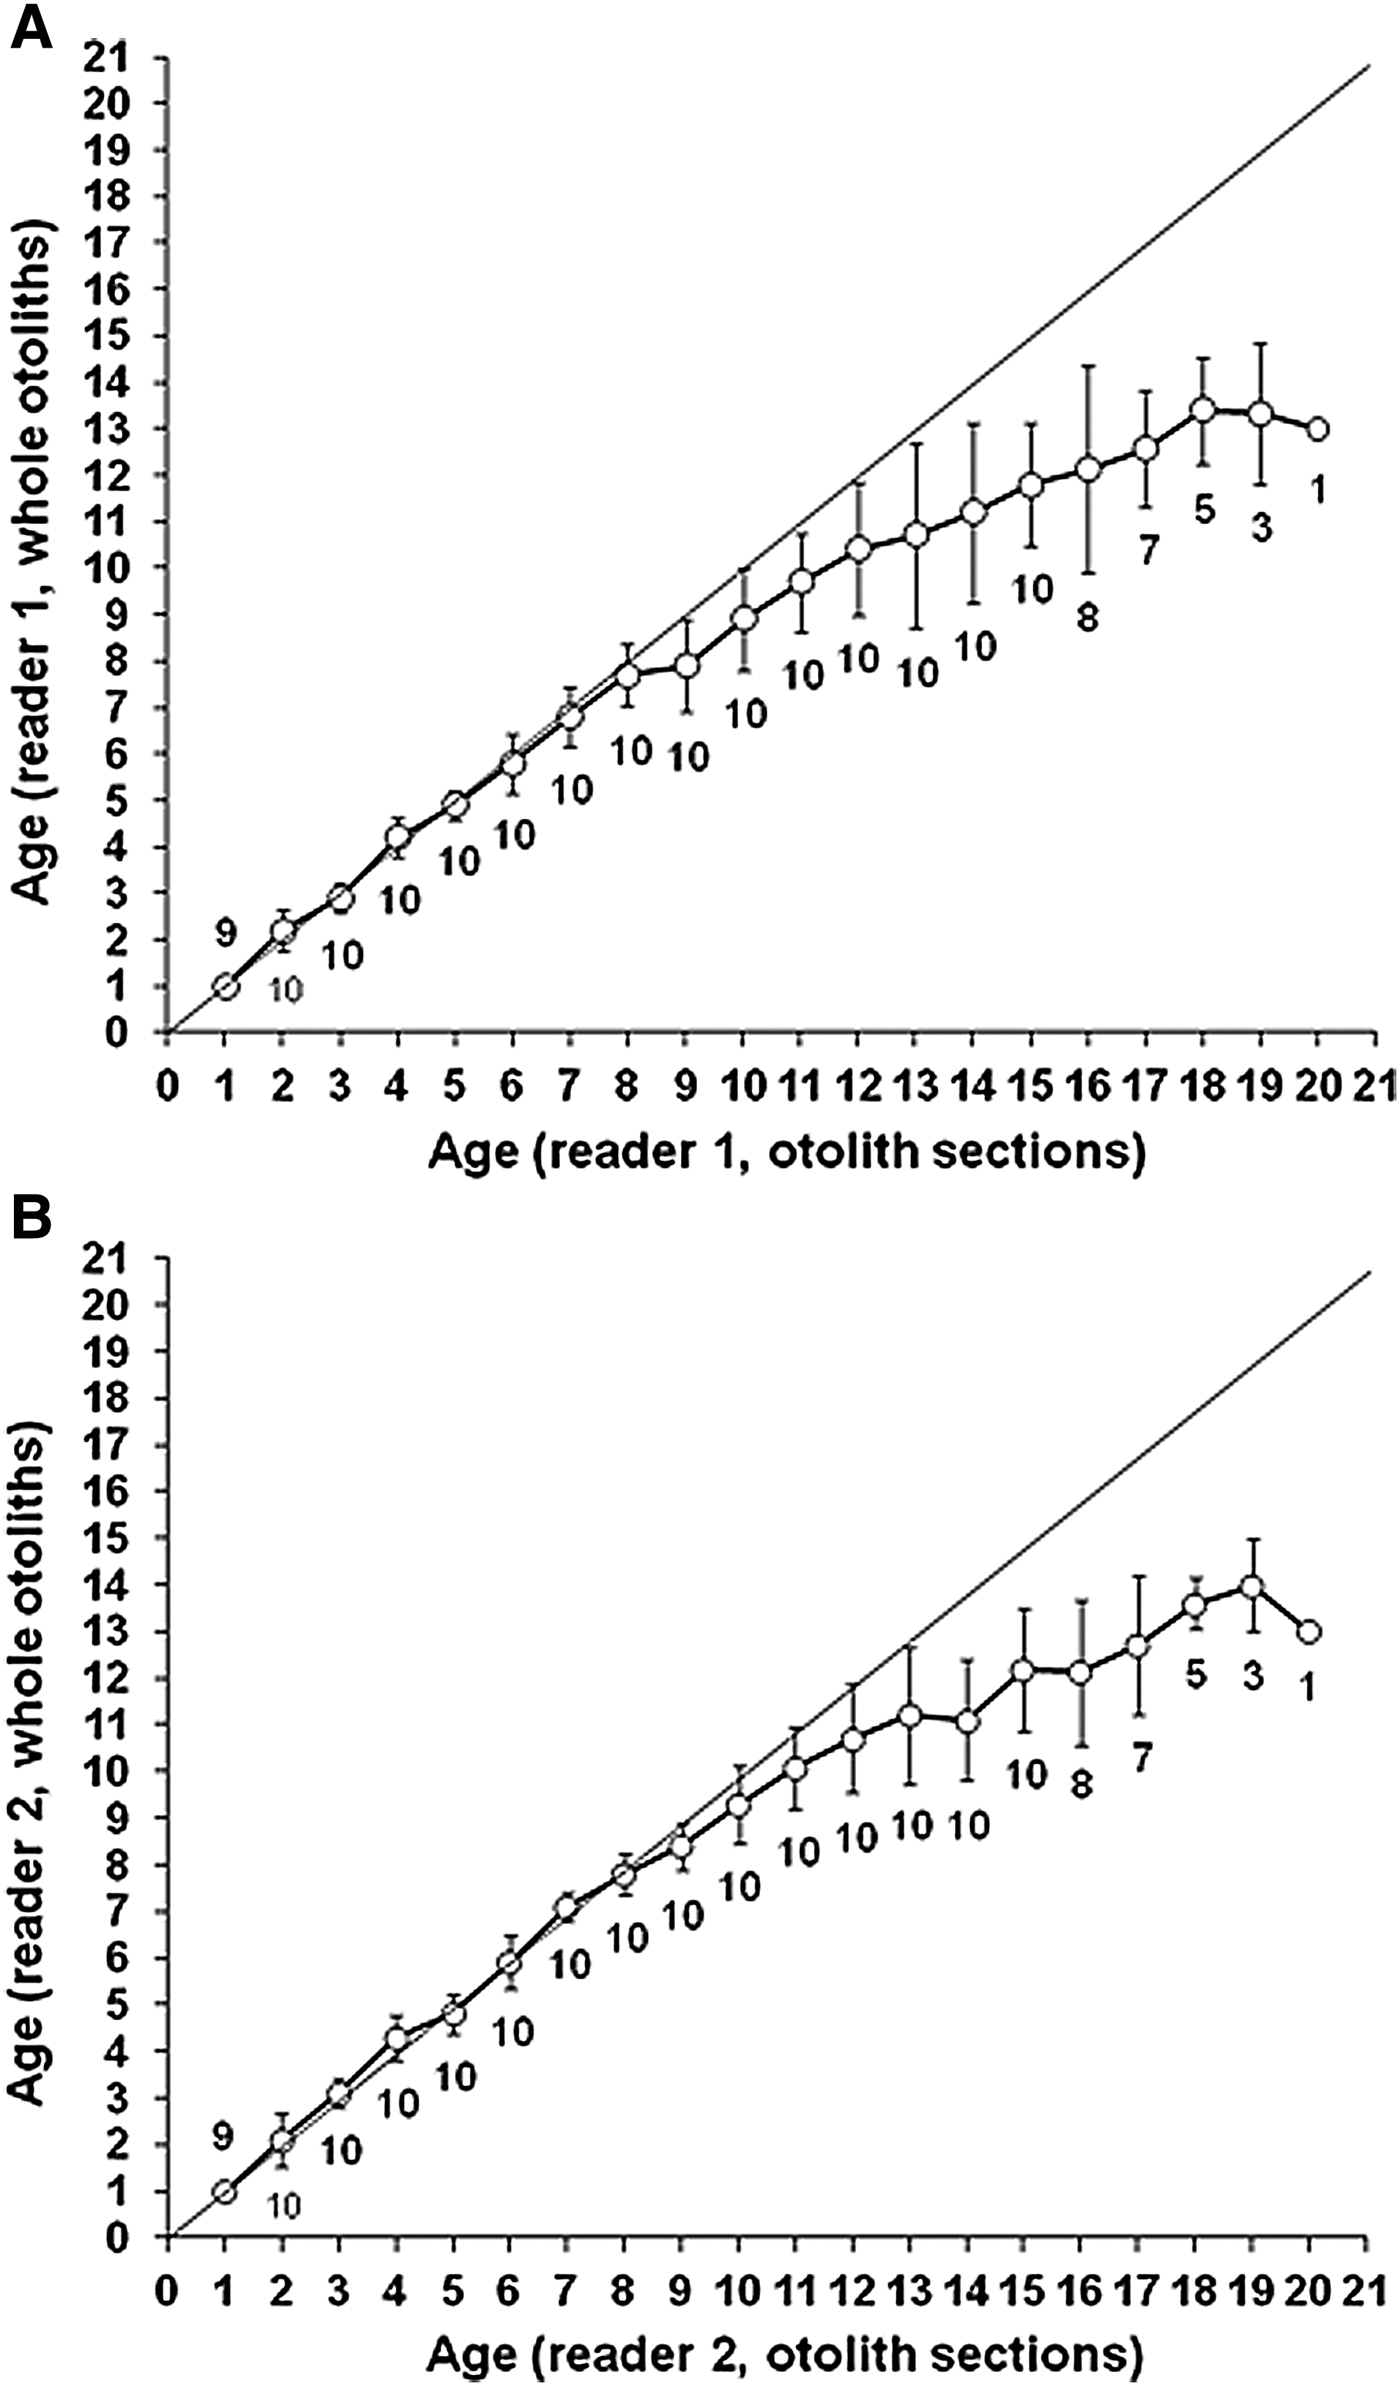
Growth zones, presumed to be annuli, were observed easily for the first 1 to 7 years in both whole and sectioned otoliths (Figure 2); subsequent annuli were more difficult to observe, especially in whole otoliths. Values of the matched pair t-test revealed that there were significant differences between the ages as determined by whole otoliths or sections across the 9–12, 13–16 and 17–20 section-based age groups (t-test, t > 2.84 > t 0.05,>20 = 1.96, P < 0.01). Age bias plots of ages estimated from whole otoliths compared with ages estimated from otolith sections revealed that readers 1 and 2 tended to underestimate ages of the whole otolith in older fish (CV > 14.3%; P < 0.01) (Figure 3). Beginning at age 12, ages estimated from whole otoliths tended to be much lower than those estimated from otolith sections. In the oldest fish, whole otoliths underestimated the age indicated in sections by approximately 70%; therefore, the age was estimated from otolith sections.
Fig. 3. Age bias plot for readers 1 (A) and 2 (B) ageing whole and sectioned otoliths of Cephalopholis taeniops off the Cape Verde Islands. Each error bar represents the SD. The 1:1 equivalence (solid line) is also indicated. The numbers indicate the sample size at each age.
Data analysis
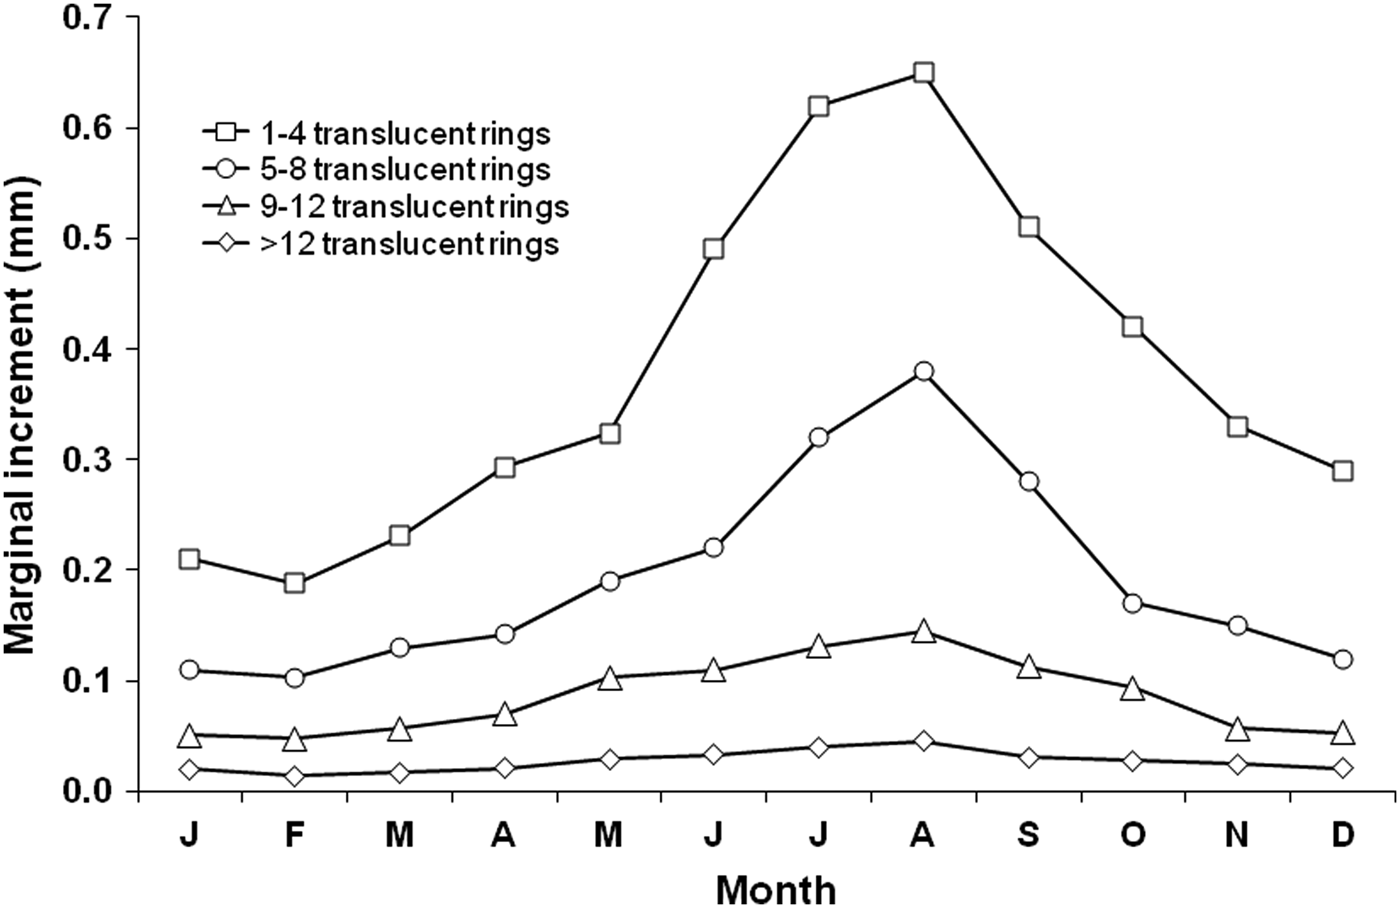
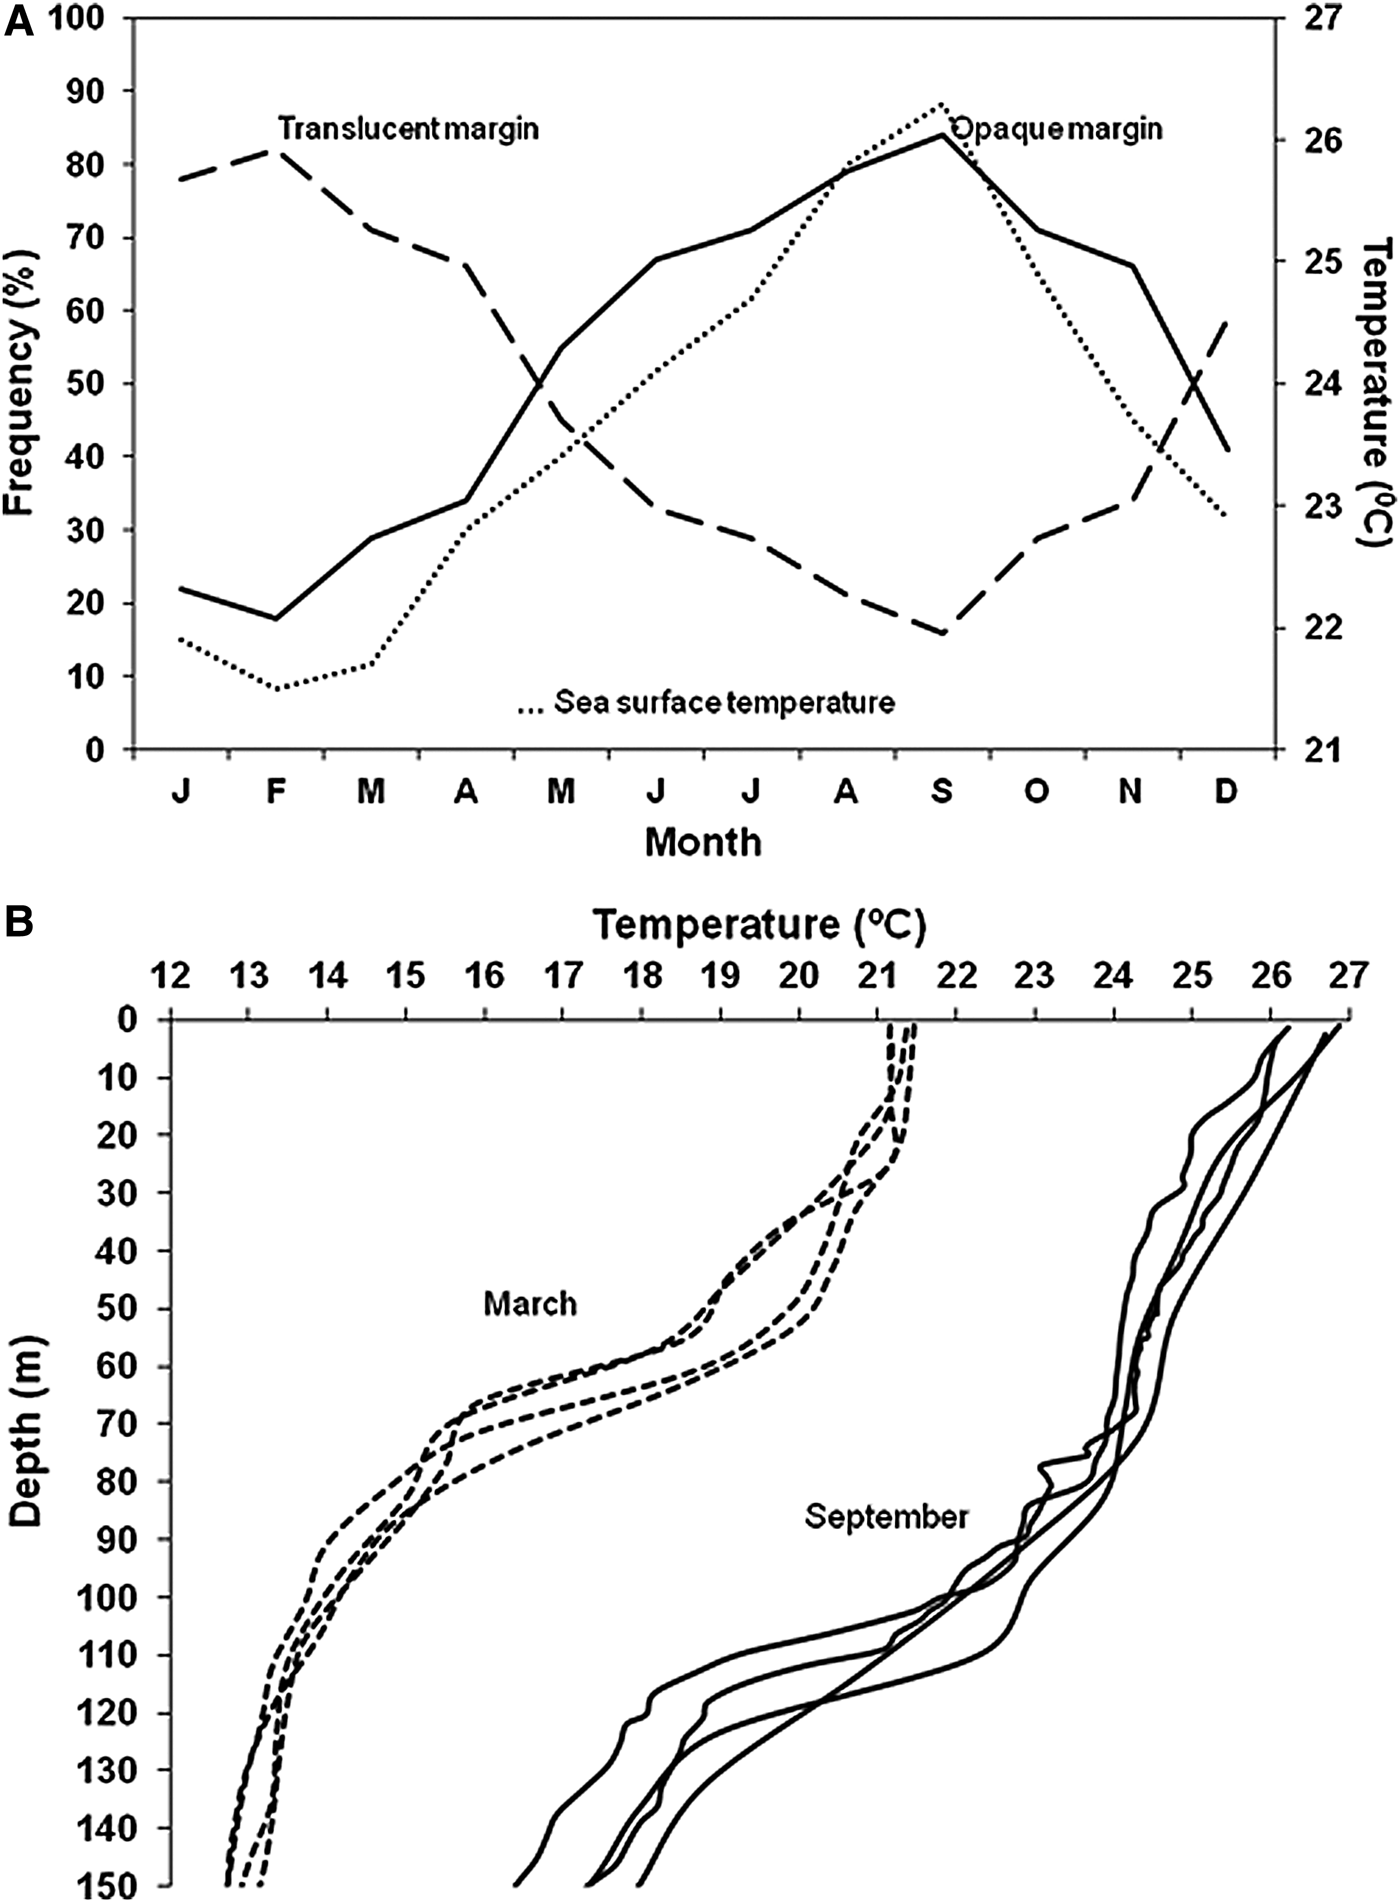
The lowest values of the mean monthly marginal increments were recorded in February, with an increasing trend observed throughout the year (Figure 4). Irrespective of the number of translucent rings in the otolith sections, one mode was observed during a 12-month period. Therefore, it was assumed that each translucent ring represents an annulus, with a year's growth represented by an opaque and its adjacent translucent ring. One growth increment consisting of one opaque and one translucent ring was formed on an annual basis, with the opaque ring being deposited mainly between May and October (Figure 4). The cross-correlation between the monthly mean temperature and the opaque margin frequency (Spearman's rho > 0.996, P < 0.01) showed that there was no apparent time lag from the start of the increase in seawater temperature and the beginning of the formation of the opaque ring. The formation of the translucent ring coincided with the decrease in the surface seawater temperature. The same pattern of variation in sea temperature was recorded with depth (Figure 5).
Fig. 4. Mean monthly marginal increments in otoliths of Cephalopholis taeniops off the Cape Verde Islands by age categories: individuals with 1–4 (N = 501), 5–8 (N = 1812), 9–12 (N = 180), and >12 translucent rings (N = 62).
Fig. 5. Mean monthly percentage of otoliths with opaque and translucent margins in Cephalopholis taeniops off the Cape Verde Islands, and the mean monthly variation of the sea surface temperature (A). Variation of the sea temperature between 0 and 150 m of depth in Cape Verde waters during the months of March and September 2011 (B).
Out of 2804 otoliths examined, only 239 (8.52%) were discarded because they were unreadable, broken or provided different age estimates across readings. In total 2565 individuals ranging from 7.4 to 51.1 cm TL were used to estimate age and growth. Both values of the coefficient of variation were low (CV reader 1 = 8.5%, P = 0.974; CV reader 2 = 9.1%, P = 0.965), indicating the reliability of the ageing procedure adopted and a reasonable level of consistency (or reproducibility) between readings.
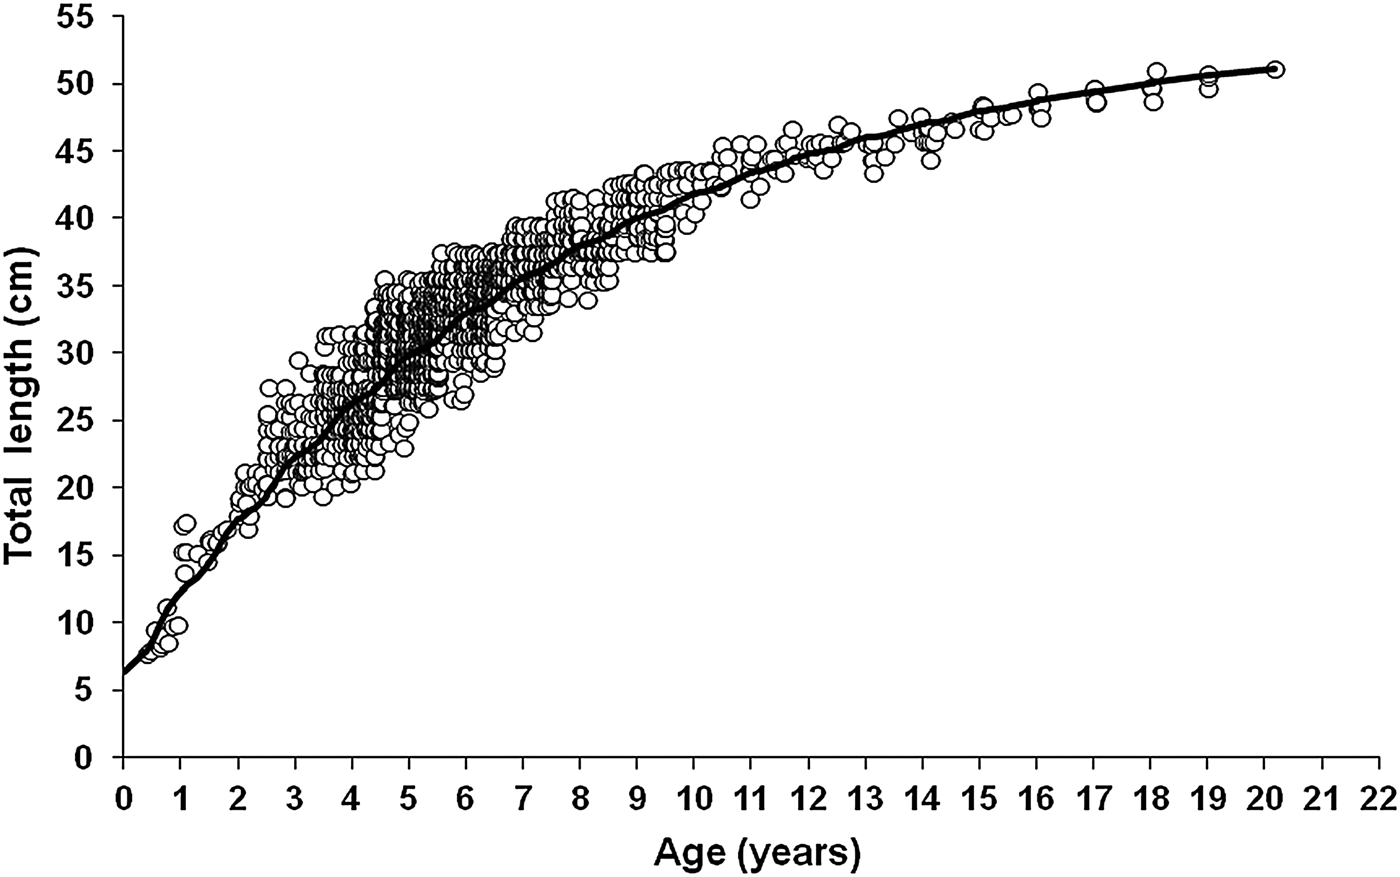
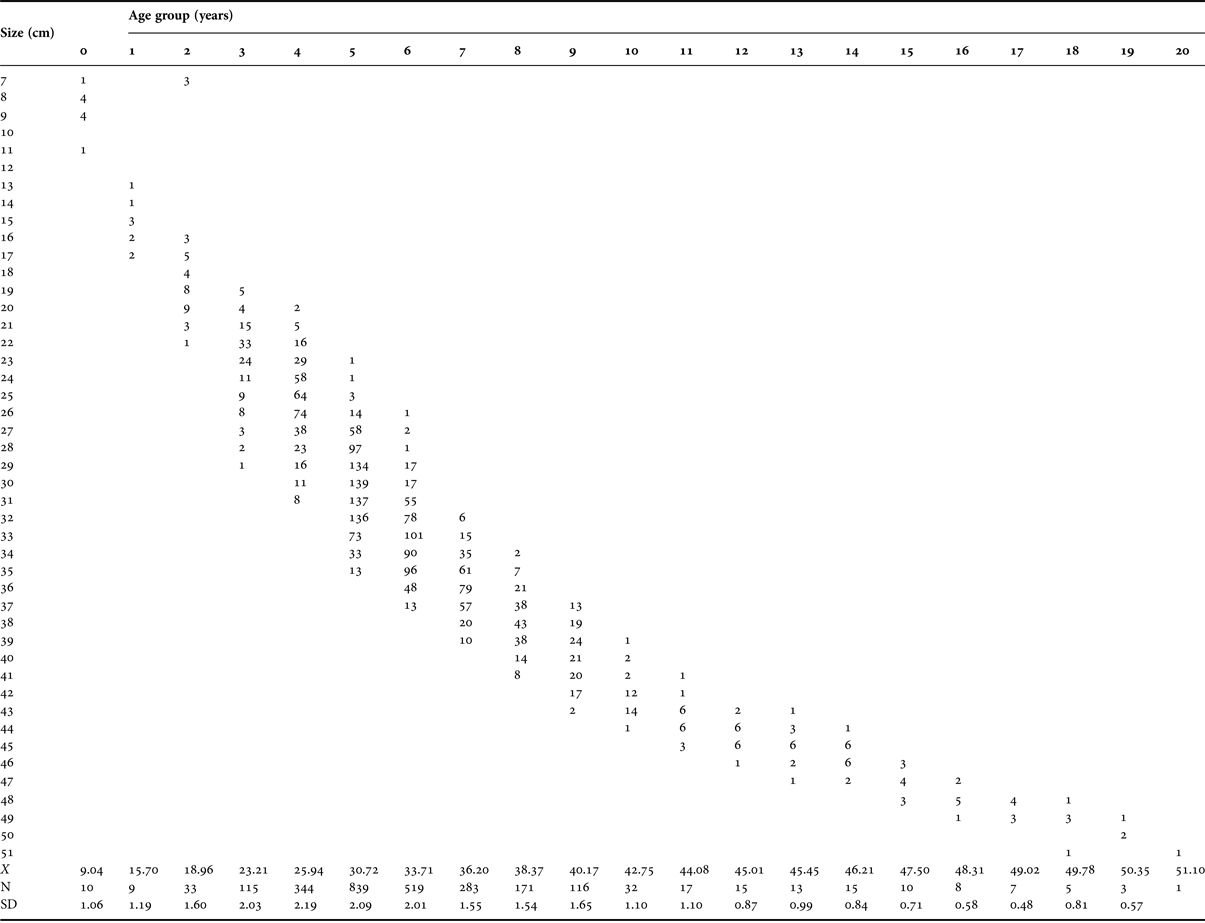
Up to 20 growth rings, assumed to be annuli, were visible in the otolith sections (Table 1). The dominant age classes were 3- to 9-year-old fish; only 4.9% of fish were 10 years old or older (Figure 6 and Table 1). Over 30% of the growth was achieved in the first year of life. In the fourth year, fish attained a size that was approximately half of the maximum length observed.
Fig. 6. Seasonalized von Bertalanffy growth curve for Cephalopholis taeniops off the Cape Verde Islands.
Table 1. Age–length key for Cephalopholis taeniops off the Cape Verde Islands. X is the mean total length, N is the number of fish by age class, and SD is the standard deviation. Length classes are in 1 cm intervals.
Growth models
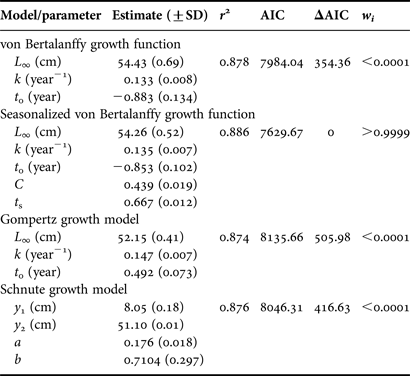
The four growth models used gave good fits to the length-at-age data (Table 2). The seasonalized von Bertalanffy growth function was the best of the growth models fitted, with an Akaike weight (w i) higher than 0.99 (Table 2); the other models gave very low values of w i, indicating that they do not fit the length-at-age data well. Therefore, the seasonalized von Bertalanffy growth function was used to represent growth (Figure 6). The computed value of 0.167 for the winter point of the seasonalized von Bertalanffy growth function indicated that the lowest growth rate occurs at about 4 months before the birth date, indicating that growth is reduced in late winter.
Table 2. Growth parameter values and model selection criterion for Cephalopholis taeniops off the Cape Verde Islands. L ∞ is the asymptotic length, k is the growth coefficient, t 0 is the theoretical age at zero length, C is the amplitude of the fluctuation in seasonal growth, t s is the addition of the point of the minimum growth +0.5, y 1 is the estimated mean length of the smallest age in the sample, y 2 is the estimated mean length of the largest age in the sample, and a and b are the model parameters. r 2 is the determination coefficient, AIC is the Akaike's Information Criterion, ΔAIC are the AIC differences between models, and w i are the Akaike weights. SD is the standard deviation.
DISCUSSION
Age estimation in epinephelids is often complicated because of the narrow fit between the growth rings towards the margins of the otolith, especially in older specimens (Manickchand-Heileman & Phillip, Reference Manickchand-Heileman and Phillip2000). Sometimes, age estimation is difficult due to the thickness of the otoliths, making it necessary to obtain otolith sections instead. In the case of C. taeniops, the narrowness between the growth rings produces an underestimation of age in older fish making it necessary to read otolith sections. In all studies performed on species of the genus Cephalopholis it has been necessary to create otolith sections to age the fish (Chan & Sadovy, Reference Chan and Sadovy2002; Araújo & Martins, Reference Araújo and Martins2009).
The values of the coefficient of variation obtained in this study suggest that the levels of precision are in line with the reference values, as indicated by Campana (Reference Campana2001).
Sagittal otoliths of C. taeniops grow proportionally through the life of the fish, and display a regular and interpretable pattern of growth marks, which can be used to assess the age of an individual. One opaque ring and one translucent ring are formed in the otolith each year, allowing the assignation of age with relative ease. This pattern has been observed in all studies carried out on Cephalopholis species (Craig et al., Reference Craig, Pondella and Hafner1999; Potts & Manooch, Reference Potts and Manooch1999; Chan & Sadovy, Reference Chan and Sadovy2002; Araújo & Martins, Reference Araújo and Martins2006, Reference Araújo and Martins2009; Trott, Reference Trott2006). Evidence indicates that almost all tropical epinephelids (and all Cephalopholis species studied) lay down increments annually (Craig et al., Reference Craig, Pondella and Hafner1999; Potts & Manooch, Reference Potts and Manooch1999; Chan & Sadovy, Reference Chan and Sadovy2002; Araújo & Martins, Reference Araújo and Martins2006, Reference Araújo and Martins2009; Bustos et al., Reference Bustos, Luque and Pajuelo2009; Choat et al., Reference Choat, Kritzer, Ackerman, Green, Mapstone, Carlos and Begg2009), including species in which annual periodicity has been confirmed by bomb radiocarbon analysis or OTC marks (Mosse, Reference Mosse2003; Trott, Reference Trott2006).
The pattern of ring formation at the same time in both juveniles and adults suggests that the regulating mechanism cannot be related solely to somatic growth or to reproductive activity. Wright et al. (Reference Wright, Panfili, Morales-Nin, Geffen, Panfili, de Pontual, Troadec and Wright2002) indicated that ring formation is an independent physiological process, more directly responsive to environmental variations. In this sense, the translucent and opaque rings are deposited on the otoliths of this grouper in winter and summer months, respectively. The opaque ring is formed when temperature reaches high levels (sea surface, 26–27°C; 100 m depth, 22.5°C), whereas the translucent ring is formed when the temperature is lower (sea surface, 21.5°C; 100 m depth, 14°C) (Figure 5). Manickchand-Heileman & Phillip (Reference Manickchand-Heileman and Phillip2000) indicated that a seasonal difference of 2–6°C is sufficient to cause the formation of these growth rings in Epinephelus flavolimbatus and Mycteroperca interstitialis. This pattern of opaque ring formation is characterized by being broad-ranging in time and taking place in the summer months, coincident with the pattern described by Chan & Sadovy (Reference Chan and Sadovy2002) for Cephalopholis boenack and Araújo & Martins (Reference Araújo and Martins2006) for Cephalopholis fulva.
Data available suggest that the increase in water temperature causes the formation of the opaque rings. The same close link between water temperature and the formation of opaque rings has been found for Mycteroperca fusca from the Canary Islands (Bustos et al., Reference Bustos, Luque and Pajuelo2009). Furthermore, Beckman & Wilson (Reference Beckman, Wilson, Secor, Dean and Campana1995) found that the period of formation of opaque rings essentially coincided with the summer months for most species distributed over lower latitudes. Moe (Reference Moe1969) noted that cycles of growth may be related to physiological changes linked to temperature, feeding regimes and reproductive cycles in Epinephelus morio from the eastern Gulf of Mexico. In this study, the formation of the opaque ring occurs during the reproduction period (unpublished data), as has been found in other species of the genus, such as C. boenak (Chan & Sadovy, Reference Chan and Sadovy2002) and C. fulva (Araújo & Martins, Reference Araújo and Martins2006). Taking into account that reproductive processes represent an energy cost for animals and, consequently, a decrease or even the stop of somatic growth, it was expected that the formation of the opaque rings would be affected by these processes. However, this has not been observed for C. taeniops in the studied area, suggesting that reproductive cycles do not affect the formation of the opaque rings.
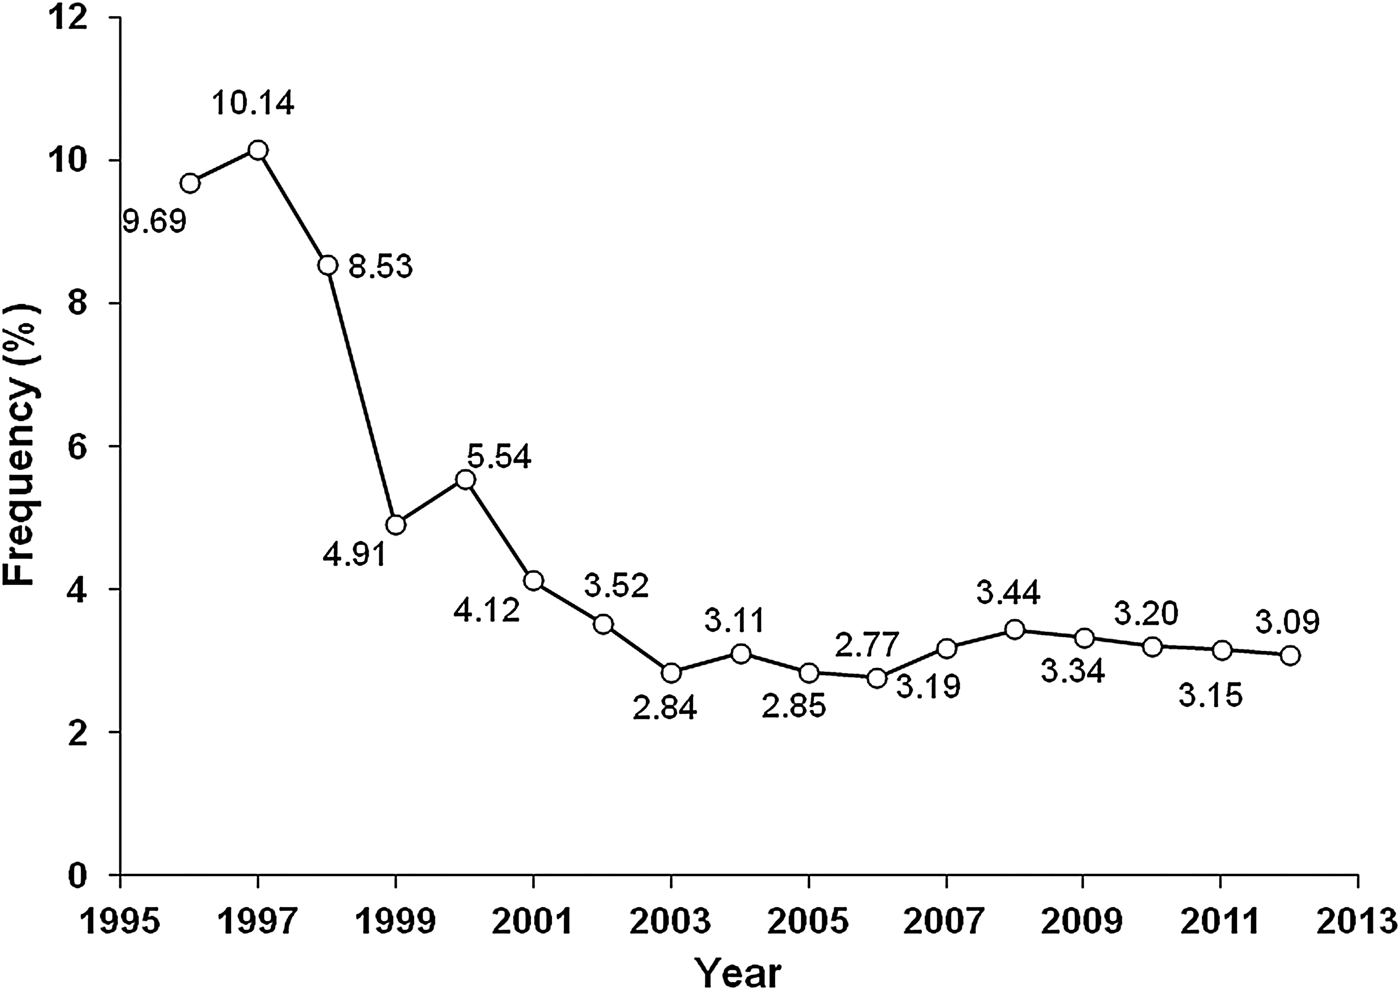
The oldest fish found in this study was 20 years old. The maximum age observed was similar to what was found for Cephalopholis hemistiktos in Jamaica where specimens of up to 26 years were found (Mathews & Samuel, Reference Mathews and Samuel1987), C. fulva in Brazil (25 years) (Araújo & Martins, Reference Araújo and Martins2006, Reference Araújo and Martins2009) and Cephalopholis panamensis in Mexico (14 years) (Craig et al., Reference Craig, Pondella and Hafner1999). However, the maximum age observed differs substantially from what was described for C. boenak in Hong Kong (11 years) (Chan & Sadovy, Reference Chan and Sadovy2002), C. fulva in the USA and Bermuda (13 and 28 years) (Potts & Manooch, Reference Potts and Manooch1999; Trott, Reference Trott2006), Cephalopholis spiloparaea (7 years), Cephalopholis urodeta (10 years), Cephalopholis leopardus (4 years), Cephalopholis sexmaculata (8 years) and Cephalopholis argus (5 years) in Papua New Guinea (Fry et al., Reference Fry, Brewer and Venables2006). The differences found among populations of the same species or species of the same genus, especially in island populations, may be attributed to differences in environmental conditions or in the method used (length frequency analysis or otolith readings), or attributed to differences in levels of exploitation. Populations under high levels of exploitation show changes in growth and in their reproductive patterns (Gulland, Reference Gulland1983), and the depletion of the oldest age class causes an underestimation of their longevity. Araújo & Martins (Reference Araújo and Martins2009) noted the inadequacy of the length frequency study in these species. In general, the species of Cephalopholis have a characteristically long lifespan and grow slowly (k = 0.11–0.19 years−1) (Mathews & Samuel, Reference Mathews and Samuel1987; Craig et al., Reference Craig, Pondella and Hafner1999; Potts & Manooch, Reference Potts and Manooch1999; Araújo & Martins, Reference Araújo and Martins2006, Reference Araújo and Martins2009; Trott, Reference Trott2006). Age 0 to age 1 specimens have been largely unavailable in the sampling effort owing to minimum size limits applied to the fishery. They were only collected with hand nets at depths of 2–5 m in a sampling aimed at the capture of small fish during a fishing survey. The low number of individuals aged higher than 10 years in the sample population likely results from their removal from the population through both fishing and natural mortalities. Figure 7 shows the decrease of individuals higher than 42 cm (>10 years) in the catches around the Cape Verde Islands from 1996 to 2012.
Fig. 7. Frequency of individuals of Cephalopholis taeniops longer than 42 cm (>10 years) caught around the Cape Verde Islands from 1996 to 2012.
The four growth models explain over 87% of the growth pattern, as shown by the determination coefficient for each curve. Although the use of the von Bertalanffy growth model has been criticized on various accounts (Booth, Reference Booth1997) because of its use of parameters of scarce biological significance (Schnute, Reference Schnute1981) or the absence of parameters which consider seasonal variations in the growth rate (Pauly, Reference Pauly1980), this model has been chosen to describe patterns of growth in species of Cephalopholis (Craig et al., Reference Craig, Pondella and Hafner1999; Potts & Manooch, Reference Potts and Manooch1999; Chan & Sadovy, Reference Chan and Sadovy2002; Araújo & Martins, Reference Araújo and Martins2006, Reference Araújo and Martins2009; Trott, Reference Trott2006; Choat et al., Reference Choat, Kritzer, Ackerman, Green, Mapstone, Carlos and Begg2009). The VB function provides a simple model with a smaller number of parameters than other models, which nevertheless allows for a comparison among species and groups of species. However, the seasonalized von Bertalanffy growth function is the best model describing the growth of C. taeniops in the Cape Verde Islands because a seasonal growth pattern exists there.
Cephalopholis taeniops found off the Cape Verde Islands is a slow-growing species (k = 0.13 years−1), as was found for C. fulva (k = 0.14 years−1) (Potts & Manooch, Reference Potts and Manooch1999; Araújo & Martins, Reference Araújo and Martins2006; Trott, Reference Trott2006), C. panamensis (k = 0.19 years−1) (Craig et al., Reference Craig, Pondella and Hafner1999), C. hemistiktos (k = 0.11 years−1) (Mathews & Samuel, Reference Mathews and Samuel1987) and Cephalopholis cruentata (k = 0.12 years−1) (Potts & Manooch, Reference Potts and Manooch1999). This slow growth pattern, common to all species of the genus Cephalopholis, is characteristic of a species that belongs to a high trophic level and has a moderate to long lifespan (Bullock & Murphy, Reference Bullock and Murphy1994).
The t 0 value obtained in this study was negative, as was obtained in other studies conducted on this genus (Craig et al., Reference Craig, Pondella and Hafner1999; Potts & Manooch, Reference Potts and Manooch1999; Chan & Sadovy, Reference Chan and Sadovy2002; Araújo & Martins, Reference Araújo and Martins2006, Reference Araújo and Martins2009; Trott, Reference Trott2006; Choat et al., Reference Choat, Kritzer, Ackerman, Green, Mapstone, Carlos and Begg2009). Negative t 0 values are common in species that grow rapidly during the first year of life, and slowly later in life (Sadovy et al., Reference Sadovy, Figuerola and Román1992; Craig et al., Reference Craig, Choat, Maxe and Saucerman1997). Although there are scarce data on the 1-year-old C. taeniops in the study area, their mean lengths are approximately 15–16 cm TL (30% of the maximum size observed).
The growth of epinephelids tends to be faster in the first stages of life, and slows down considerably later (Bullock & Murphy, Reference Bullock and Murphy1994; Manickchand-Heileman & Phillip, Reference Manickchand-Heileman and Phillip2000; Araújo & Martins, Reference Araújo and Martins2006, Reference Araújo and Martins2009). Cephalopholis boenak has been shown to grow to reach 90 mm in length in its first 18 months of life in Hong Kong (Liu & Sadovy, Reference Liu and Sadovy2005) and C. panamensis has been shown to grow 160 mm year−1 in its first few years of life in Mexico (Craig et al., Reference Craig, Pondella and Hafner1999) and in Brazil (Araújo & Martins, Reference Araújo and Martins2006, Reference Araújo and Martins2009), with a reduction in growth rate to 10–23 mm year−1 between 2 and 7 years of age (Araújo & Martins, Reference Araújo and Martins2006, Reference Araújo and Martins2009). For this reason, the seasonalized von Bertalanffy growth function does not properly describe the growth of the Epinephelidae species as far as the first few years of life are concerned.
Apart from the fact that the fishery tends to select the biggest groupers for economic reasons, the characteristics of the growth and reproductive aspects (Siau, Reference Siau1994) of C. taeniops, with a long lifespan, slow growth and late sexual maturation, make this species highly susceptible to overfishing (Sadovy et al., Reference Sadovy, Craig, Bertoncini, Carpenter, Cheung, Choat, Cornish, Fennessy, Ferreira, Heemstra, Liu, Myers, Pollard, Rhodes, Rocha, Russell, Samoilys and Sanciangco2013). To achieve the correct management and recovery of the populations, it is necessary to analyse and determine the characteristics of its habitat and its possible anthropogenic alteration (Erisman et al., Reference Erisman, Craig and Hastings2010), the distribution and the movement of the age groups and the existence of possible processes of aggregation during the spawning period, as in C. boenak in Hong Kong (Liu & Sadovy, Reference Liu and Sadovy2005). It is also necessary to evaluate how fishing activity affects these aggregation processes, which causes vulnerability in other groupers (Sadovy, Reference Sadovy, Zhou, Zhou, Yao, Lu, Hu, Cuy and Din1997; Chiappone et al., Reference Chiappone, Sluka and Sullivan2000).
ACKNOWLEDGEMENTS
The authors are very grateful to two anonymous reviewers for their critical and useful comments on the manuscript which enabled the contents to be improved. This publication is contribution no. 1 of the Partnership between the INDP (Department of Fisheries Research, DIH) and the ULPGC (Department of Biology) for biological studies on Cephalopholis taeniops from the Cape Verde Islands, signed in January 2012. Most data come from the monitoring programme of the fishery for this target species, developed by the INDP. The remaining data corresponding to the smaller individuals were obtained during the cruise Cabo Verde 2010-04, in the frame of the Project PROACTIVA (Dirección General de Relaciones con África, Canary Islands Government).