


Introduction
Advances in neonatal intensive care over recent decades have contributed to a marked improvement in the prognosis for preterm infants.Reference Itabashi, Horiuchi and Kusuda 1 , Reference Wilson-Costello, Friedman, Minich, Fanaroff and Hack 2 Although neurocognitive impairment is the most important adverse outcome of preterm birth,Reference Wilson-Costello, Friedman, Minich, Fanaroff and Hack 2 increasing data suggest an increased risk of metabolic syndrome (MS) in later life, including higher blood pressureReference Hack, Schluchter, Cartar and Rahman 3 , Reference de Jong, Monuteaux, van Elburg, Gillman and Belfort 4 and insulin resistance.Reference Hofman, Regan and Jackson 5 , Reference Tinnion, Gillone, Cheetham and Embleton 6 However, other data indicate that there is no difference in the risk of MS between adults born preterm and at term.Reference Parkinson, Hyde, Gale, Santhakumaran and Modi 7 , Reference Lapillonne and Griffin 8
Breast milk (BM) is considered the optimal source of nutrition for infants. Moreover, early nutrition (both prenatal and throughout infancy) is generally accepted as an important determinant of the risk of developing MS later in life. Breastfeeding has been reported to be inversely associated with adult risk factors for MS, including hypertension,Reference Martin, Gunnell and Smith 9 , Reference Lawlor, Riddoch and Page 10 obesityReference Owen, Martin, Whincup, Smith and Cook 11 , Reference Mayer-Davis, Dabelea and Lamichhane 12 and insulin resistance.Reference Singhal, Fewtrell, Cole and Lucas 13 , Reference Ravelli, van der Meulen, Osmond, Barker and Bleker 14
Several lipoprotein ratios or ‘atherogenic indices’ have been defined in an attempt to optimize the predictive capacity of the lipid profile. On the basis of total cholesterol (TC), low-density lipoprotein cholesterol (LDLc) and high-density lipoprotein cholesterol (HDLc), the TC/HDLc and LDLc/HDLc ratios are recognized as risk indicators with a greater predictive value than the isolated parameters used independently.Reference Millan, Pinto and Munoz 15 The major apoprotein present in HDL is apolipoprotein-A1 (apoA1), which provides structural stability to the spherical molecule. In LDL, apolipoprotein-B (apoB) constitutes most of the protein content. Therefore, the apoB/apoA1 ratio is important when detecting atherogenic risk, and can be more useful than both the TC/HDLc and LDLc/HDLc ratios.Reference Millan, Pinto and Munoz 15
Although many genetic and environmental factors affect glucose metabolism and the lipid and apolipoprotein profiles of preterm infants, there is less information linking these factors in early infancy to the metabolic state in adulthood. Thus, the present study aimed to assess the insulin sensitivity and atherogenic indices of preterm infants to assess the effect of breastfeeding on indices of MS.
Methods
Subjects
This pilot study was conducted in the neonatal intensive care unit (NICU) of Juntendo University Hospital, Tokyo, Japan. We enrolled singleton, preterm infants (gestational age, ⩽35.0 weeks) born at the hospital between May 2010 and August 2012. To minimize the influence of maternal glucose or lipid metabolism, the following infants were excluded: those with intrauterine growth restriction [standard deviation (s.d.) score for birth weight <−2.0], major congenital abnormalities or metabolic disorders, those born to mothers with diabetes (type-1, type-2 or gestational), chronic hypertension or intrauterine infections. Gestational age was estimated from the mother’s last menstrual period and confirmed through fetal ultrasound measurements. Sex and gestational age-independent s.d. scores for birth weight were calculated by comparison with the Japanese standard birth weight curve.Reference Itabashi, Fujimura, Kusuda and Tamura 16
According to our nutritional protocol, feeding was typically initiated within the first 8 h after birth (20 ml/kg divided over eight feeds per day), and the type of feeding depended on the mother’s willingness or ability to provide BM. When BM was unavailable, infants received a cow’s milk-based premature formula (GP-P®; Morinaga Milk Industry, Corporation, Limited, Tokyo, Japan; nutrient composition/100 ml: calories 76.5 kcal, protein 2.0 g). Milk intake was increased by ~20 ml/kg daily to 120 ml/kg, at which time the human milk fortifier (HMS-1®; Morinaga Milk Industry; nutrient composition/1 g: calories 3.37 kcal, protein 0.26 g) was added to human milk. The manufacturer recommends that 30 ml of human milk be mixed with 0.8 g of HMS-1® before enteral feeding. This fortified human milk was continued until discharge. Fortified human milk was assumed to contain about 74 kcal and 2.0 g of protein/100 ml.Reference Itabashi, Miura, Okuyama, Takeuchi and Kitazawa 17
The preterm infants were divided into two groups according to the type of feeding received at the time of the blood examination: (1) BM group receiving ⩾90% of their intake from BM, and (2) a mixed-fed (MF) group receiving ⩾50% of their intake from formula.
This study was approved by the Institutional Review Board of Juntendo University Hospital. Written informed consent was obtained from the parents of infants before study participation.
Biochemical measurements
Infants underwent a heel lance procedure several days before discharge from the NICU following at least 2 h of fasting. Blood samples (~600 μl) were collected in heparin sodium tubes. Blood glucose concentrations were quantified immediately using the OneTouch Ultra Glucometer (Johnson & Johnson, New Brunswick, NJ, USA), and serum specimens were obtained by centrifugation of clotted blood samples.
Serum insulin levels were measured with electrochemiluminescence immunoassays using the Modular Analytics E170 Analyzer (Roche Diagnostics K.K., Tokyo, Japan). The detection limit of the assay in our laboratory was 0.2 μU/ml for insulin with intra-assay and inter-assay coefficients of variation of 1.5 and 4.9%, respectively. The quantitative insulin sensitivity check index (QUICKI) was used to estimate insulin sensitivity and calculated according to the following formula:
 $${\rm QUICKI}= & & & {\rm 1}/[{\rm log plasma insulin }({\rm \rmu U}/{\rm ml}){\plus}{\rm log plasma glucose (mg}/{\rm dl})].$$
TC was measured enzymatically, and LDLc and HDLc levels were measured by direct homogeneous assay. ApoA1 and apoB levels were determined by immunoturbidimetric assay using the Hitachi Automatic Analyzer LABOSPECT008 (Hitachi High-Technologies Corporation).
Statistical analyses
Results are presented as the mean±s.d., and all comparisons are made between the BM and MF groups. Student’s t-test was used to compare normal parametric variables, whereas the Mann–Whitney U-test was used to compare non-normally distributed variables between the groups. Analysis of covariance was used to analyze for group differences controlling for estimated confounding factors. Values of P<0.05 were considered statistically significant. All statistical analyses were performed using StatView 5.0 software (Abacus Concepts, Berkeley, CA, USA) and SPSS software for Windows version 11.0 (MapInfo Corporation, Troy, NY, USA).
Results
The clinical characteristics and anthropometric indices of the mothers and infants are summarized in Table 1. In total, 41 (18 female and 23 male) singleton preterm infants (gestational age ⩽35 weeks) were included in the study; of these, 22 infants were in the BM group, and 19 were in the MF group. The mothers were between 29 and 47 years and were on a balanced diet with meat and dairy products. Table 2 summarizes the clinical and anthropometric indices of the infants at discharge. The BM intake was significantly higher in the BM group (P<0.01).
Table 1 General characteristics of mothers and preterm infants at birth
BM, breast milk; MF, mixed fed; BMI, body mass index.
Data are presented as the mean±s.d. or the number (percentage) of subjects.
*P<0.05 compared with the breast milk group.
Table 2 General characteristics of BM and infant MF preterm infants at discharge
BM, breast milk; MF, mixed fed.
Δs.d. score=(s.d. score for body weight for corrected gestational age at discharge)−(s.d. score for birth weight).
Data are presented as the mean±s.d. or the number (percentage) of subjects.
**P<0.01 compared with the breast milk group.
The levels of glucose, insulin, TC, HDLc, LDLc, apoA1 and apoB at the time of discharge were 93.2±15.6 mg/dl, 12.0±7.4 μU/ml, 135.6±27.8, 56.1±13.2, 53.3±15.5, 143.9±19.1 and 42.5±9.6 mg/dl, respectively. Infants underwent the heel lance procedure at a mean corrected age of 37.4 weeks. The glucose and insulin levels were significantly lower in the BM group. In addition, the glucose/insulin ratios and QUICKI scores were significantly higher in the BM group (Fig. 1).
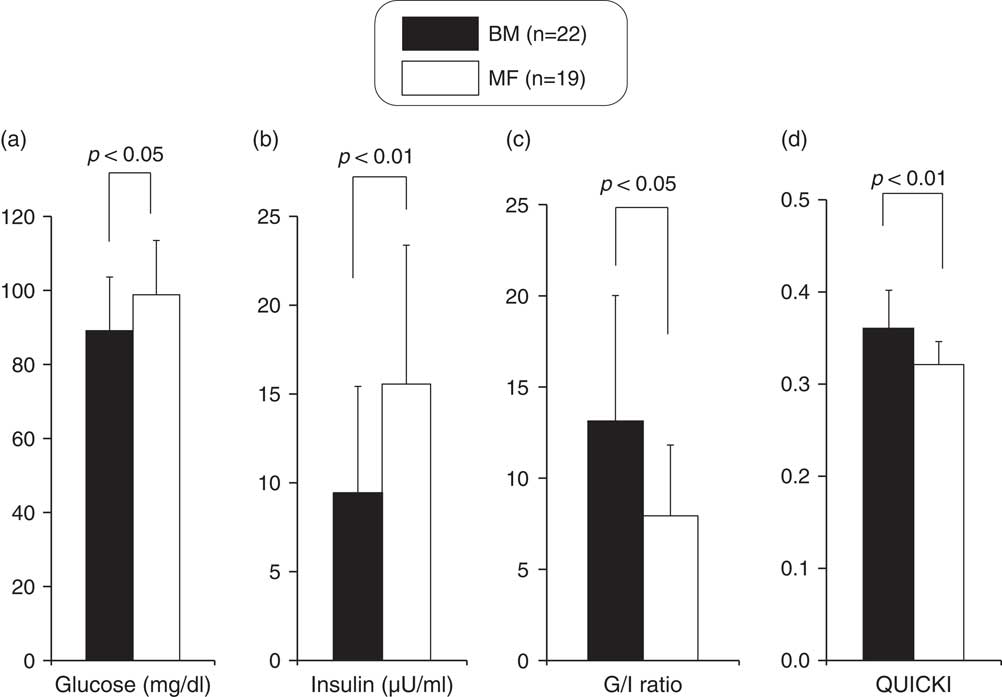
Fig. 1 Comparison of glucose (a), insulin (b), G/I ratio (c) and quantitative insulin sensitivity check index (QUICKI) (d) between breast milk (BM) and mixed-fed (MF) premature infants (mean+s.d.).
Although no significant differences existed in serum TC and HDLc levels between the two groups (Fig. 2), serum LDLc and the TC/HDLc and LDLc/HDLc ratios were significantly higher in the BM group (Fig. 2). The serum apoA1 level was not significantly different between the two groups (Fig. 3), but the serum apoB and the apoB/apoA1 ratio were significantly higher in the BM group (Fig. 3).
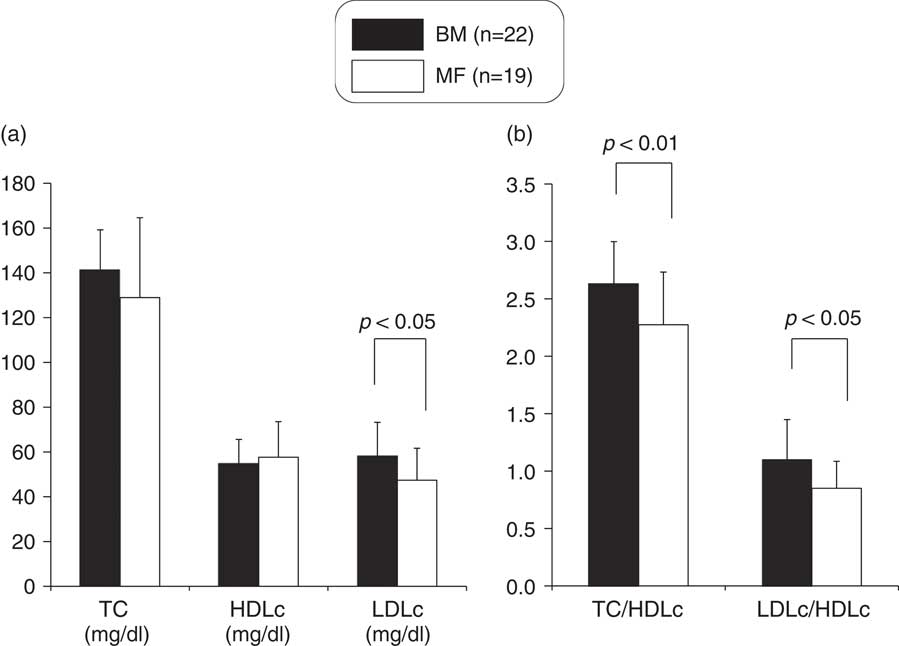
Fig. 2 Comparison of TC, HDLc and LDLc (a), TC/HDLc and LDLc/HDLc ratio (b) between breast milk (BM) and mixed-fed (MF) premature infants (mean+s.d.). TC, total cholesterol; HDLc, high-density lipoprotein cholesterol; LDLc, low-density lipoprotein cholesterol.
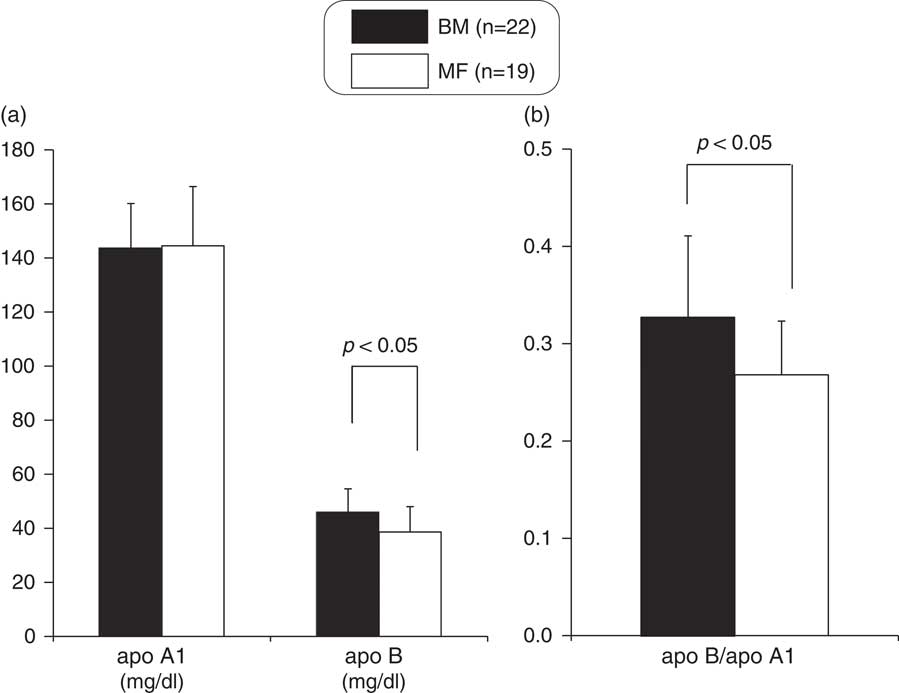
Fig. 3 Comparison of apoA1 and apoB (a), apoB/apoA1 ratio (b) between breast milk (BM) and mixed-fed (MF) premature infants (mean+s.d.). apoA1, apolipoprotein-A1; apoB, apolipoprotein-B.
To exclude the influence of the statistically significant different maternal characteristics on glucose, lipid and apolipoprotein metabolism in preterm infants, we compared these indices of the two groups after controlling for maternal age by using analysis of covariance. G/I ratio (P=0.00), QUICKI (P=0.00) and TC/HDLc (P=0.03), LDLc/HDLc (P=0.02) and apoB/apoA1 (P=0.04) ratios were still significantly higher in the BM group than in the MF group.
Discussion
To the best of our knowledge, this is the first study that assessed the glucose metabolism and atherogenic indices in blood samples collected from preterm infants in the early postnatal period, based on measurements of lipids and apolipoproteins. Our results indicate that breast-fed preterm infants have significantly better insulin sensitivity but worse atherogenic indices during the early postnatal period compared with MF infants.
Pearce et al. Reference Pearce, Unwin, Parker and Alberti 18 reported an inverse association between the duration of breastfeeding and the homeostasis model assessment (HOMA) score in adult men. Similarly, a meta-analysis of published observational studies suggested that, compared with formula feeding, breastfeeding was associated with a 39% reduction in the risk of type-2 diabetes in adulthood. Moreover, a modest inverse association was observed between breastfeeding and circulating insulin levels in infancy.Reference Owen, Martin, Whincup, Smith and Cook 19 Although it is not known whether these associations are causal, animal studies have demonstrated that the high content of long-chain polyunsaturated fatty acids in BM may suppress pro-inflammatory cytokine production, regulate neurotransmitter function, enhance insulin receptor numbers in the brain and other tissues, and decrease HOMA.Reference Lombardo and Chicco 20 Furthermore, BM contains hormones, such as leptin, adiponectin, resistin and ghrelin, which play important roles in the regulation of energy balance and in glucose homeostasis.Reference Savino, Liguori, Sorrenti, Fissore and Oggero 21
We calculated the QUICKI as a measure of glucose metabolism because the hyperinsulinemic–euglycemic glucose clamp technique is difficult to perform and ethically unsound in newborn infants. Takaya et al. Reference Takaya, Yamato, Higashino and Kaneko 22 recently reported the QUICKI scores of term infants using cord plasma insulin and glucose levels. They suggested that the QUICKI provides a useful parameter for the evaluation of insulin sensitivity in neonates.
The influence of nutritional factors on plasma lipoprotein cholesterols and apolipoproteins has also been studied in both preterm and full-term infants. Once milk is given enterally to newborn infants, their lipoprotein profiles change markedly within a few months from an HDL-dominant to an LDL-dominant pattern.Reference Lane and McConathy 23 , Reference Wang, Wilcken and Dudman 24 Such changes are plausible to be closely related to the increased synthesis of lipoproteins in the small intestine and liver. Previous reports indicate that plasma concentrations of TC, LDLc and apoB are increased in breast-fed term infants.Reference Akeson, Axelsson and Raiha 25 , Reference Harit, Faridi, Aggarwal and Sharma 26 It is reasonable to assume that their higher cholesterol levels may be owing to a higher intake of dietary cholesterol from BM.Reference Lane and McConathy 23 Indeed, Fujita et al. Reference Fujita, Okada and Inami 27 demonstrated that LDLc and apoB concentrations increased markedly over the postnatal days 0–5, and that these concentrations persisted in 1-month-old breast-fed and MF infants. On the other hand, a review of the evidence by Owen et al. Reference Owen, Whincup and Kaye 28 indicates that exclusive breastfeeding is associated with lower blood cholesterol levels in adult life. Furthermore, Singhal et al. Reference Singhal, Cole, Fewtrell and Lucas 29 reported that breastfeeding of preterm infants was associated with reduced atherogenic indices such as LDLc/HDLc and apoB/apoA1 in adolescence. This may be explained by a previously reported mechanism in which early cholesterol exposure was believed to suppress endogenous cholesterol synthesis through the downregulation of hepatic hydroxymethylglutaryl coenzyme A reductase.Reference Wong, Hachey, Insull, Opekun and Klein 30
A limitation of this study was that the sample size was relatively small, and the influence of maternal glucose and lipid metabolism could not be eliminated, and that glucose, insulin, TC and lipoprotein levels in maternal blood and/or BM were not assessed.
In conclusion, the results of the present study suggest that the type of feeding in the early postnatal period may influence glucose, lipid and apolipoprotein metabolism. In addition, breastfeeding appears to affect insulin sensitivity and atherogenic indices during the early postnatal period in preterm infants. Further research is needed to evaluate the changes in the QUICKI score, as well as the TC/HDLc, LDLc/HDLc and apoB/apoA1 ratios through adulthood as risk factors of future development of MS.
Acknowledgement
None.
Financial Support
This work was supported in part by Grants-in-Aid for Scientific Research (22791039) from the Japanese Ministry of Education, Culture, Sports, Science and Technology.
Conflicts of Interest
None.
Ehtical Standards
The authors assert that all procedures contributing to this work comply with the Ethical Guidelines for Clinical Studies by the Japanese Ministry of Health, Labour and Welfare and with the Helsinki Declaration of 1975, as revised in 2008, and has been approved by the the Institutional Review Board of Juntendo University Hospital.


