


Introduction
Barley (Hordeum vulgare L.) is one of the original crop species of Old World agriculture and is probably one of the earliest crop species domesticated by humans (Badr et al., Reference Badr, Muller, Sch, Rabey, Effgen, Ibrahim, Pozzi, Rohde and Salamini2000). Currently, barley is used as malt, animal feed or a component of various health foods (Newman and Newman, Reference Newman and Newman2006). Cultivated barley is one of the most important crop species in Jiangsu, especially in the Jiangsu coastal area. Several barley cultivars used for malt have been bred in the Jiangsu coastal area since the beginning of the 20th century.
Population genetics addresses variations in allele frequencies among and within populations. Several studies using molecular markers have been performed to investigate the genetic diversity in different barley germplasm collections, such as global barley germplasm (Malysheva-Otto et al., Reference Malysheva-Otto, Ganal and Roder2006; Milner et al., Reference Milner, Jost, Taketa, Mazón, Himmelbach, Oppermann, Weise, Knüpffer, Basterrechea, König, Schüler, Sharma, Pasam, Rutten, Guo, Xu, Zhang, Herren, Müller, Krattinger, Keller, Jiang, González, Zhao, Habekuß, Färber, Ordon, Lange, Börner, Graner, Reif, Scholz, Mascher and Stein2019), or mixtures of the wild and domesticated barley accessions to reveal genomic signatures of barley domestication (Pankin et al., Reference Pankin, Altmuller, Becker and Von Korff2018; Zeng et al., Reference Zeng, Guo, Xu, Mascher, Guo, Li, Mao, Liu, Xia, Zhou, Yuan, Tai, Wang, Wei, Song, Zha, Li, Tang, Bai, Zhuang, He, Zhao, Fang, Gao, Yin, Wang, Yang, Zhang, Henry, Stein and Tashi2018), or compare the local and exotic cultivated barley germplasms within a location (Usubaliev et al., Reference Usubaliev, Brantestam, Salomon, Garkavagustavson and Von Bothmer2013; Bengtsson et al., Reference Bengtsson, Manninen, Jahoor and Orabi2017; Elakhdar et al., Reference Elakhdar, Kumamaru, Qualset, Brueggeman, Amer and Capochichi2018).
Several types of molecular markers, such as simple sequence repeats, diversity array technology and single-nucleotide polymorphism (SNP) markers, have been used to study genetic diversity and structure of crop species (Kesawat and Kumar, Reference Kesawat and Kumar2009). Due to advances in SNP technology and abundance, relative ease of discovery via high-throughput sequencing data (Kumar et al., Reference Kumar, Banks and Cloutier2012) and costs per data point, SNP-based genotyping of crop species has increased in applicability (Ganal et al., Reference Ganal, Altmann and Roder2009). Double-digest-restriction-associated DNA (ddRAD) sequencing was developed to efficiently and accurately determine genotypes at a low cost (Peterson et al., Reference Peterson, Weber, Kay, Fisher and Hoekstra2012), and has become the most widely used genomic approach for high-throughput SNP discovery (Andrews et al., Reference Andrews, Good, Miller, Luikart and Hohenlohe2016).
Starch is the main storage component in barley grain (Wu et al., Reference Wu, Yao, Yao, Chi and Feng2017), and it ranges from 38.7 to 59.3% in the barley core collection of the USDA National Small Grain Collection (Bowman et al., Reference Bowman, Blake, Surber, Habernicht and Bockelman2001). The content and properties of starch affect the quality of barley products (Zhu, Reference Zhu2017). Breeding barley with a high starch content is one of the main goals of barley breeding. Characterization of markers associated with economically important traits is important for subsequent breeding processes and is thus useful for the community. Previous studies based on linkage mapping (Abdel-Haleem et al., Reference Abdel-Haleem, Bowman, Giroux, Kanazin, Talbert, Surber and Blake2010) and genome-wide association studies (GWAS) (Pasam et al., Reference Pasam, Sharma, Malosetti, Van Eeuwijk, Haseneyer, Kilian and Graner2012) have revealed many molecular markers associated with starch content in barley. However, it is usually expensive and time consuming to assay all individuals collected from a sample population for the target traits. Bulked segregant analysis, which works with selected and pooled individuals, has been extensively used in gene mapping (Cheng et al., Reference Cheng, Wang and Xu2016), and has been successfully used in maize for tolerance to waterlogged condition (Du et al., Reference Du, Zhu, Su, Huang, Wang, Ding, Zhang, Luo, Wei, Tian and Xu2017).
Thus, the objective of the present study was to (1) identify SNPs among the barley materials based on the ddRAD method; (2) evaluate the population structure and the genetic diversity of the barley materials; and (3) identify the SNP markers associated with starch content in barley.
Materials and methods
Plant materials
Varieties at both ends of the starch content spectrum (15 per end) were selected from 174 barley varieties that were chosen as parent materials in the Jiangsu coastal area, and they were grown in the Jiangsu coastal area during three growing seasons (2014–2017). Thirty materials were planted in randomized complete blocks with three replications. Each plot contained one 1.5 m long row, and the rows were separated by 30 cm. The starch content of each replicated grain sample from all three growing seasons was estimated using a near-infrared reflectance spectrometer (FOSS 1241, Denmark) (Pasam et al., Reference Pasam, Sharma, Malosetti, Van Eeuwijk, Haseneyer, Kilian and Graner2012). Ten local materials, which constituted the main released varieties bred in the coastal areas of Jiangsu, were included to identify SNPs and evaluate genetic diversity. A total of 40 cultivated barley varieties were ultimately used in this study (online Supplementary Table S1).
Phenotypic data analysis
Analysis of the phenotypic data was performed using R software. The phenotypic mean of each material across growing season was estimated. A joint analysis of variance (ANOVA) was conducted for starch content using ANOVA via the car package. The heritability (h2) of starch content was calculated as h 2 = σ g2/(σ g2 + σ gy2/n + σ e2/nr) for the combined data across growing season. Here, σ g2, σ gy2 and σ e2 represent the genotype, genotype × environment (growing season) and error component of the variance estimated from the expected mean squares of the ANOVA, respectively; n is the number of growing season; and r is the number of replications.
Genotyping
Genomic DNA of each individual was extracted from seeds using an E.Z.N.A. Tissue DNA Kit (Omega Bio-Tek, America) according to the manufacturer's instructions. Illumina paired-end sequencing (PE150) was used to perform the re-sequencing.
The reference genome of Hordeum_vulgare (IBSC_v2) (Mascher et al., Reference Mascher, Gundlach, Himmelbach, Beier, Twardziok, Wicker, Radchuk, Dockter, Hedley, Russell, Bayer, Ramsay, Liu, Haberer, Zhang, Zhang, Barrero, Li, Taudien, Groth, Felder, Hastie, Šimková, Staňková, Vrána, Chan, Muñoz-Amatriaín, Ounit, Wanamaker, Bolser, Colmsee, Schmutzer, Aliyeva-Schnorr, Grasso, Tanskanen, Chailyan, Sampath, Heavens, Clissold, Cao, Chapman, Dai, Han, Li, Li, Lin, McCooke, Tan, Wang, Wang, Yin, Zhou, Poland, Bellgard, Borisjuk, Houben, Doležel, Ayling, Lonardi, Kersey, Langridge, Muehlbauer, Clark, Caccamo, Schulman, Mayer, Platzer, Close, Scholz, Hansson, Zhang, Braumann, Spannagl, Li, Waugh and Stein2017) was obtained from Ensembl (http://plants.ensembl.org/Hordeum_vulgare/Info/Index). The high-quality sequencing reads were aligned to the Hordeum_vulgare reference genome sequence using BWA (http://bio-bwa.sourceforge.net/) software in ‘bwa aln’ mode (Li and Durbin, Reference Li and Durbin2009). After removing PCR-duplication reads via SAMtools (http://samtools.sourceforge.net/) software (Li et al., Reference Li, Handsaker, Wysoker, Fennell, Ruan, Homer, Marth, Abecasis and Durbin2009), the sequencing depth and coverage were calculated based on the alignments by custom Perl scripts. The valid BAM file was used to detect SNPs by the GATK ‘UnifiedGenotyper’ function (http://www.broadinstitute.org/gatk/) (DePristo et al., Reference DePristo, Banks, Poplin, Garimella, Maguire, Hartl, Philippakis, del Angel, Rivas, Hanna, McKenna, Fennell, Kernytsky, Sivachenko, Cibulskis, Gabriel, Altshuler and Daly2011). When the gene annotation file of the reference genome was provided, the annotation of detected variations, including SNPs (synonymous or non-synonymous mutations of SNPs), was performed by ANNOVAR (http://www.openbioinformatics.org/annovar/) (Wang et al., Reference Wang, Li and Hakonarson2010).
Population structure analysis
The programme FASTSTRUCTURE (https://github.com/rajanil/fastStructure) was used to perform a population structure analysis (Raj et al., Reference Raj, Stephens and Pritchard2014). The analysis was based on a Bayesian clustering program. The input parameter K was changed from 2 to 6, representing the assumed historical groups of the simulated population. Initially, a neighbour-joining (NJ) phylogenetic tree was constructed from the SNP data. An in-house script was then used to compute the sample distance. EMBOSS/fneighbor (http://emboss.toulouse.inra.fr/cgi-bin/emboss/fneighbor?_pref_hide_optional=1) was subsequently used to construct an NJ tree. To perform a principal component analysis (PCA) within the population, the population genotypes were transformed into a matrix that included only the numbers 0, 1 and 2. Zero indicates that the genotype was homozygous for the reference genotype, 1 indicates that it was heterozygous and 2 indicates that it was homozygous for the non-reference genotype. The sample covariance of the matrix that contained all individual information (with the numbers 0, 1 and 2) was then calculated. The eigenvector decomposition of the matrix was ultimately calculated using the R function eigen, and the PCA results were plotted.
Linkage disequilibrium (LD)
The correlation coefficient (r 2) of alleles was calculated to measure the LD within cultivated barley using Haploview (Barrett et al., Reference Barrett, Fry, Maller and Daly2005). The parameters were as follows: -maxdistance 1000 -dprime -minMAF 0.2, and -hwcutoff 0.001. The average r 2 value was calculated for each length of distance, and LD decay figures were constructed using R script for cultivated barley groups.
Genetic diversity analysis
The polymorphism information content (PIC), the average pairwise divergence within a population (θπ) and Watterson's estimator (θ w) were estimated for the whole genome of cultivated barley groups (Watterson, Reference Watterson1975). Sliding windows that were 100 kb in size and had a 50% overlap between adjacent windows were used to estimate π and θ w for the whole genome. In each window, these parameters were calculated with an in-house Perl script.
Association mapping and Fst calculation
A mixed linear model (MLM) (Zhang et al., Reference Zhang, Ersoz, Lai, Todhunter, Tiwari, Gore, Bradbury, Yu, Arnett, Ordovas and Buckler2010) implicated in TASSEL 5.0 (Bradbury et al., Reference Bradbury, Zhang, Kroon, Casstevens, Ramdoss and Buckler2007) was used to perform association analysis. According to the liberal approach proposed by Shu and Rasmussen (Reference Shu and Rasmussen2014), the kinship (K) model was used in this study, and the kinship matrix was obtained from TASSEL 5.0 based on 2770 SNP markers selected from seven chromosomes by every 1 Mb distance. To measure the differentiation of the two ends of the spectrum for barley starch content, Fst was calculated using the hierfstat package in R.
Results
SNP identification
A total of 40 barley accessions were re-sequenced using the ddRAD method by Illumina paired-end sequencing with an average sequencing depth of more than 8× for each line and with a coverage of more than 11% of the genome (online Supplementary Table S1). After mapping against the barley reference genome of Morex, a total of 3,587,027 SNPs were identified, of which 299,103 were considered to be high-quality markers after filtering by a missing rate of <0.5 and minor allele frequency (MAF) of ⩾0.2.
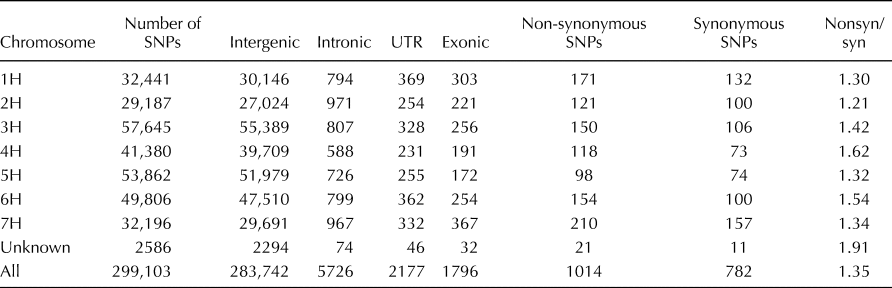
The SNP markers were distributed along all chromosomes of the genome (online Supplementary Fig. S1) and ranged from 29,187 to 53,862 for each chromosome. A total of 94.86% (283,742) of the identified SNP markers resided in the intergenic region, while only 0.60% (1796) of the SNP markers resided in the exonic region. The ratio of non-synonymous/synonymous SNPs was 1.35 and ranged from 1.21 (2H) to 1.62 (4H) for each chromosome (Table 1).
Table 1. Statistics of SNPs in the whole genome and genic regions of barley accessions
Population structure and genetic diversity of cultivated barley
The 299,103 SNP markers were used for analysing the population structure. Admixture analysis, PCA and pairwise dissimilarity analysis on the basis of the NJ method generated concordant pictures of the genetic relationships among accessions (Fig. 1). Group 1 was clearly separated from other groups in the NJ tree (Fig. 1(a)). Group 2, group 3 and group 4 were clearly separated according to the PCA (Fig. 1(b)). Admixture analysis (Fig. 1(c)) showed that the accessions in group 1, group 3, group 2 and group 4 arose from each barley clade with K from 2 to 4. C06 and C35 were Supi 3, and they coalesced according to all three methods (Fig. 1), indicating the accuracy of the population structure analysis. The population structure of the barley cultivar was considered to comprise four sub-populations according to the results based on the three population structure methods.
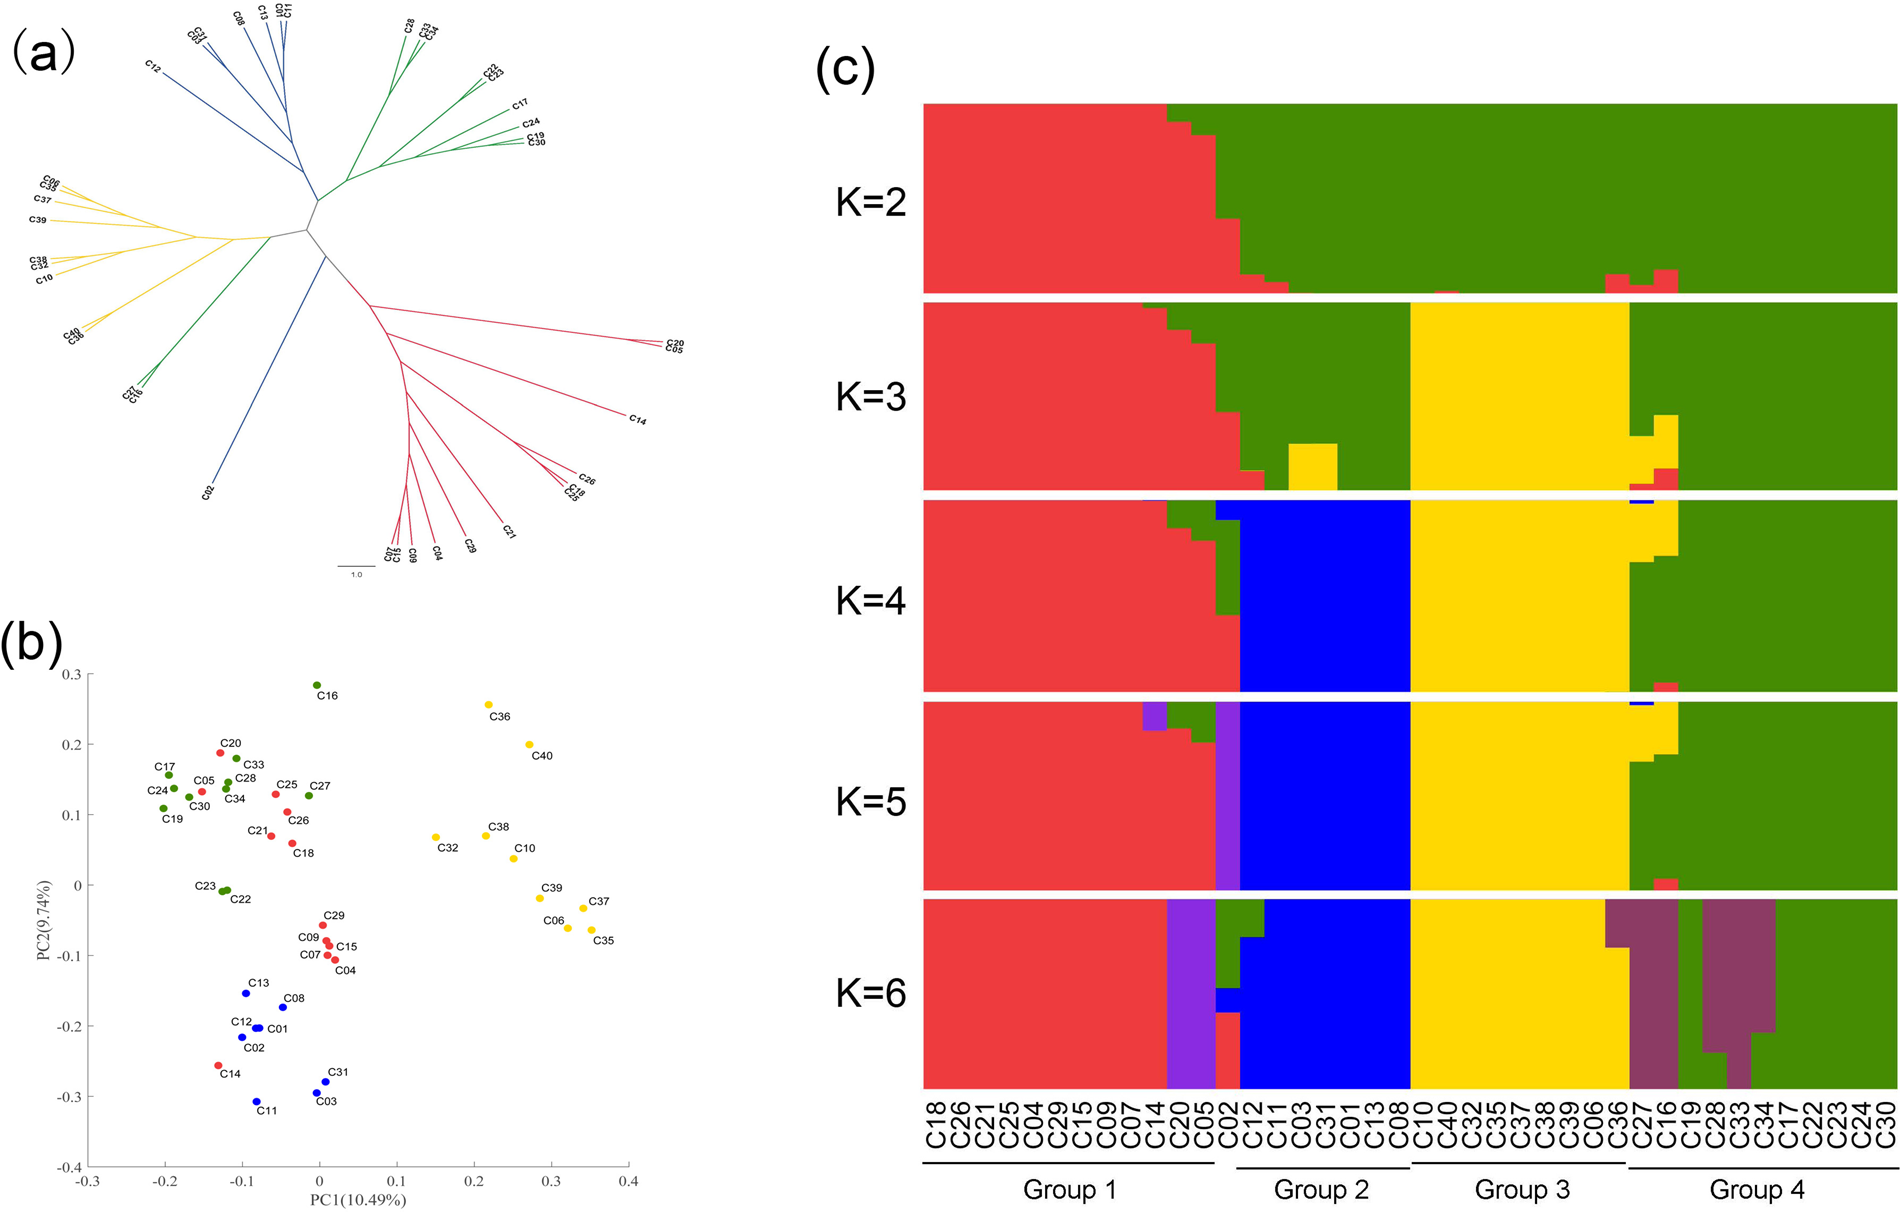
Fig. 1. Population structure of cultivated barley. (a) Neighbour-joining tree of Nei's genetic distance among the cultivated barley varieties. (b) Principal component analysis plot of cultivated barley. (c) Admixture analyses of the cultivated barley with k (number of populations assumed for analysis) ranging from 2 to 6.
When the source and row data of the cultivated barley were combined, group 1 mainly represented six-row cultivated barley, while groups 2, 3 and 4 mainly represented two-row cultivated barley. Group 3 mainly represented two-row cultivated barley bred in the Jiangsu coastal area in the last 20 years. The stringent cleistogamy of barley suggested that there was a high LD (measured in terms of r 2) in the barley genome. To understand the specific LD block patterns in four cultivated barley groups, LD analysis was carried out. In general, all four cultivated barley groups exhibited high LD, and the pattern of LD block distribution differed among the four cultivated barley groups (online Supplementary Fig. S2). Group 3, which represented the two-row cultivated barley recently bred for malting in the Jiangsu coastal area, showed the highest LD.
The genome-wide genetic diversity across the barley genome for all 299,103 SNPs was determined (Table 2). The PIC, π and θ w of group 3 were 0.107, 0.915 × 10⁻⁵ and 0.640 × 10⁻⁵, respectively, which were the lowest values among the four groups, indicating the recent loss of genetic diversity of cultivated barley in the Jiangsu coastal area. The genetic diversity for each chromosome of barley in terms of the PIC, π and θ w was also analysed (online Supplementary Table S2). Interestingly, chromosome 4H (0.336, 2.133 × 10⁻⁵ and 1.595 × 10⁻⁵, respectively) exhibited low genetic diversity, while chromosome 6H (0.344, 9.902 × 10⁻⁵ and 6.509 × 10⁻⁵, respectively) exhibited high genetic diversity. The genetic diversity of group 3 was lower than that of the other groups on chromosomes 1H, 2H, 3H and 7H, but showed relatively high genetic diversity on chromosomes 4H and 5H.
Table 2. Genetic diversity in cultivated barley groups

The diversity (1 × 10⁻⁵) is described by nucleotide diversity (π) and Watterson's estimator (θ w) and is reported per 100 kb.
Marker–trait association for starch content in barley
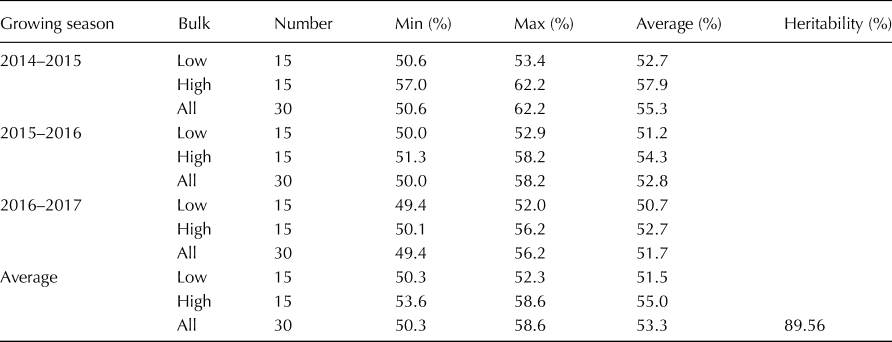
The starch content of the barley varieties at the two ends of the spectrum across the three growing seasons is listed in Table 3. The starch content ranged from 50.3 to 52.3% with an average of 51.5%, based on the mean of the three growing seasons at the low end of the spectrum and ranged from 53.6 to 58.6%, with an average of 55.0% at the high end of the spectrum. Approximately 89.56% of the phenotypic variation was accounted for by the genotypic variation. The starch content correlation coefficient among the different growing seasons was >0.74, and only three barley varieties whose starch content was at the high end of the spectrum presented a low starch content in one or two growing seasons. The joint ANOVA results indicated significant differences (P < 0.001) among the genotypes for starch content, while the varieties × environment (growing season) interaction was not significant (online Supplementary Table S3).
Table 3. Descriptive statistics for starch content of the bulked barley accessions
The distribution of the starch content among the four barley groups is listed in Table 4, which shows that the barley varieties whose starch content was at either end of the spectrum were present among the four barley groups, indicating that the starch content was affected by population structure. All the varieties in group 2 were at the low end of the starch content spectrum, while all the varieties in group 4 belonged to the high end of the spectrum.
Table 4. Distribution of starch content among the four barley groups

Three barley varieties that showed extreme variation among the growing seasons were not included, and they belonged to group 1.
The Fst which compares the varieties at the low end of the spectrum to the high end (in terms of starch content) was calculated, and 1766 SNPs were detected as having a value >0.8 (online Supplementary Fig. S3). These SNPs were distributed throughout the genome, indicating that a high degree of false positives was obtained based on the Fst method. The MLM method was then used to detect the SNP markers associated with starch content. A Q-Q plot showed that the false-positive rate was controlled based on the MLM method (online Supplementary Fig. S4), and 26 markers associated with starch content were detected at P < 0.001 based on the average starch content data across the three growing seasons. These SNP markers were located on chromosomes 1H and 4H. Due to the high LD of the population, the detected SNP markers were considered to constitute only two QTLs for starch content, named qSC1-1 and qSC4-1 (online Supplementary Table S4). When these results are compared with those of the Fst analysis, these two QTLs had SNPs with Fst values >0.8. A GWAS for starch content in a single growing season was also performed, and qSC1-1 was detected in both the 2014–2015 and 2015–2016 growing seasons, while qSC4-1 was detected in all three growing seasons (Fig. 2).

Fig. 2. Genome-wide association study (GWAS) of starch content of barley based on normalized averages across three growing seasons and within a single growing season The horizontal line indicates the significant threshold for the starch content, starch on the right for the result of average across three growing seasons, starch 1 on the right for the results of the 2014–2015 growing season, starch 2 on the right for the results of the 2015–2016 growing season, starch 3 on the right for the results of the 2016–2017 growing season.
Discussion
The ddRAD method was an effective way to determine SNP markers in barley
The SNPs were filtered with a missing rate <0.5 and an MAF ⩾0.2 due to the small number of samples (only 40 samples were used for re-sequencing), and a total of 299,103 SNPs were considered to be affected SNPs in this study. The ddRAD method used in this study to detect SNP markers in barley was considered an effective method because (1) the number of affected SNPs was slightly greater than that found by Milner et al. (Reference Milner, Jost, Taketa, Mazón, Himmelbach, Oppermann, Weise, Knüpffer, Basterrechea, König, Schüler, Sharma, Pasam, Rutten, Guo, Xu, Zhang, Herren, Müller, Krattinger, Keller, Jiang, González, Zhao, Habekuß, Färber, Ordon, Lange, Börner, Graner, Reif, Scholz, Mascher and Stein2019) who analysed genotyping-by-sequencing data from a total of 22,626 DNA samples, and (2) the ratio of SNPs present in the coding sequences compared with all affected SNPs was similar to that found by Zeng et al. (Reference Zeng, Guo, Xu, Mascher, Guo, Li, Mao, Liu, Xia, Zhou, Yuan, Tai, Wang, Wei, Song, Zha, Li, Tang, Bai, Zhuang, He, Zhao, Fang, Gao, Yin, Wang, Yang, Zhang, Henry, Stein and Tashi2018) who re-sequenced 177 barley genomes, with an average of 48.1 Gb per accession.
Population and diversity of barley materials
The population structure of the barley materials was explored using FASTSTRUCTURE, PCA and phylogenetic analysis, and the results of the three methods were relatively consistent, indicating that integrating the different methods could result in an effective population structure (Pankin et al., Reference Pankin, Altmuller, Becker and Von Korff2018; Zeng et al., Reference Zeng, Guo, Xu, Mascher, Guo, Li, Mao, Liu, Xia, Zhou, Yuan, Tai, Wang, Wei, Song, Zha, Li, Tang, Bai, Zhuang, He, Zhao, Fang, Gao, Yin, Wang, Yang, Zhang, Henry, Stein and Tashi2018). Separation between two- and six-row cultivars was the first observed differentiation by population structure analysis (Ordon et al., Reference Ordon, Ahlemeyer, Werner, Kohler and Friedt2005; Munozamatriain et al., Reference Munozamatriain, Cuestamarcos, Endelman, Comadran, Bonman, Bockelman, Chao, Russell, Waugh, Hayes and Muehlbauer2014; Amezrou et al., Reference Amezrou, Gyawali, Belqadi, Chao, Arbaoui, Mamidi, Rehman, Sreedasyam and Verma2018), after which cultivars bred in the Jiangsu coastal area and used for malt recently were divided from among the two-row cultivars.
The distribution of the genome-wide diversity of the two-rowed cultivated barley recently bred for malting in the Jiangsu coastal area was significantly lower than that of the rest of the cultivated barley genotypes, indicating a limited pool of alleles within the gene pool. Thus, exotic cultivated and wild barley should be included during breeding to increase the genetic diversity of newly cultivated barley in the future (De Wouw et al., Reference De Wouw, Kik, Van Hintum, Van Treuren and Visser2010; Zeng et al., Reference Zeng, Guo, Xu, Mascher, Guo, Li, Mao, Liu, Xia, Zhou, Yuan, Tai, Wang, Wei, Song, Zha, Li, Tang, Bai, Zhuang, He, Zhao, Fang, Gao, Yin, Wang, Yang, Zhang, Henry, Stein and Tashi2018).
Variation in barley starch content
High starch contents are needed in barley for brewing and feeding (Qi et al., Reference Qi, Chen, Wang, Wu, Cao and Zhang2005; Abdel-Haleem et al., Reference Abdel-Haleem, Bowman, Giroux, Kanazin, Talbert, Surber and Blake2010). The phenotype of the starch content was significantly different among the barley germplasm materials, and high-starch content varieties were present within both six-row and two-row barley. The starch content was affected by population structure, and all barley varieties in group 4 had a high starch content in this study, suggesting that high-starch content barely could be selected via structure analysis. Many QTLs of starch content in barley have been detected based on linkage mapping and association mapping, and they are widely distributed across all seven chromosomes; however, in these previous studies, only a few markers were used and no QTL for starch content in barley has been finely mapped until now (Abdel-Haleem et al., Reference Abdel-Haleem, Bowman, Giroux, Kanazin, Talbert, Surber and Blake2010, Reference Abdel-Haleem, Bowman, Surber and Blake2012; Haseneyer et al., Reference Haseneyer, Stracke, Paul, Einfeldt, Broda, Piepho, Graner and Geiger2010; Pasam et al., Reference Pasam, Sharma, Malosetti, Van Eeuwijk, Haseneyer, Kilian and Graner2012; Shu and Rasmussen, Reference Shu and Rasmussen2014). The qSC1-1 and qSC4-1 QTLs detected in this study are seemingly new QTLs for starch content in barley compared to those in previous studies; however, the HORVU1Hr1G039250 gene, which is annotated as encoding cellulose synthase, was located within the interval region of qSC1-1 and could be a candidate gene for this QTL.
Supplementary material
The supplementary material for this article can be found at https://doi.org/10.1017/S1479262120000143.
Acknowledgements
This work was supported by the Natural Science Foundation of Jiangsu Province (BK20160432), Jiangsu Agriculture Science & Technology Innovation Fund (JASTIF), CX(17)3056, the Agriculture Research System of China (CARS-05), Technical system of Jiangsu modern agriculture industry, JATS[2018]139.


